163 East 81st Street - Carnegie Hill
- Apartments
- Overview & Photos
- Maps
- Floorplans
- Sales Data & Comps
- Similar Buildings
- All Units

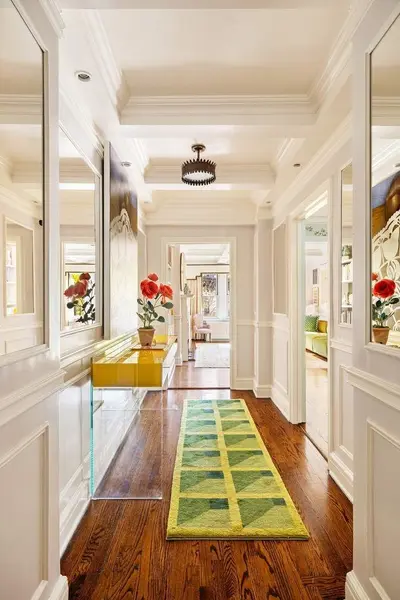

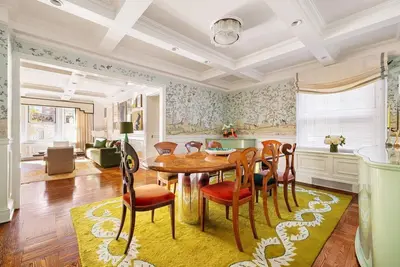


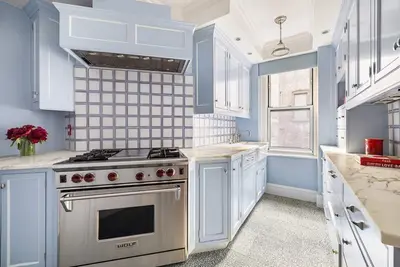

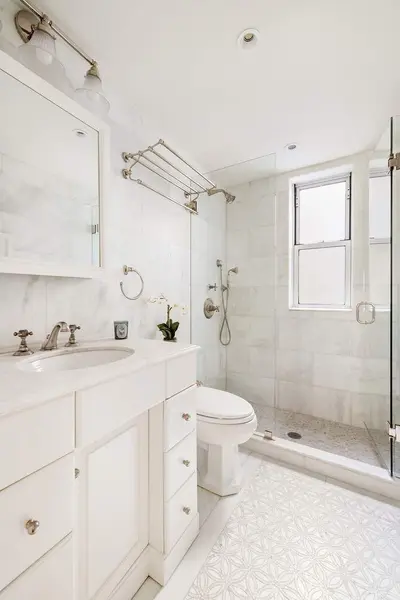
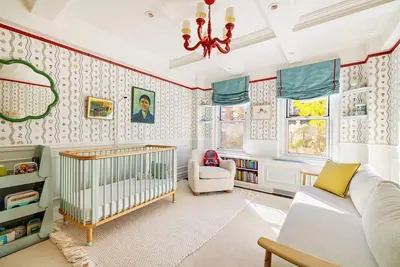
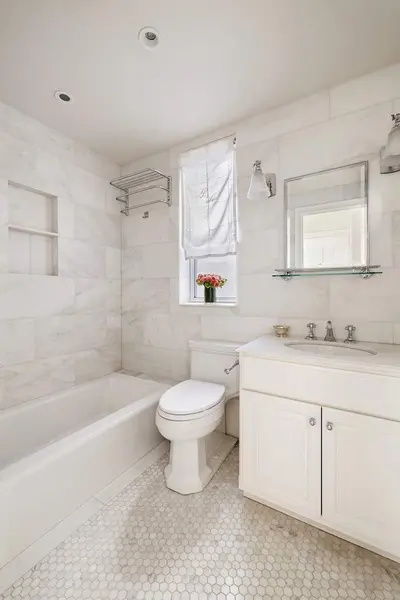
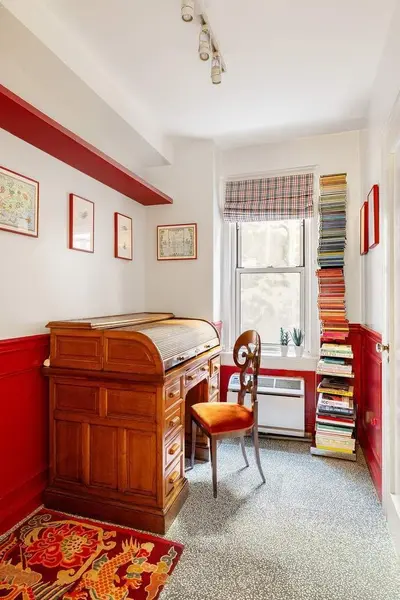
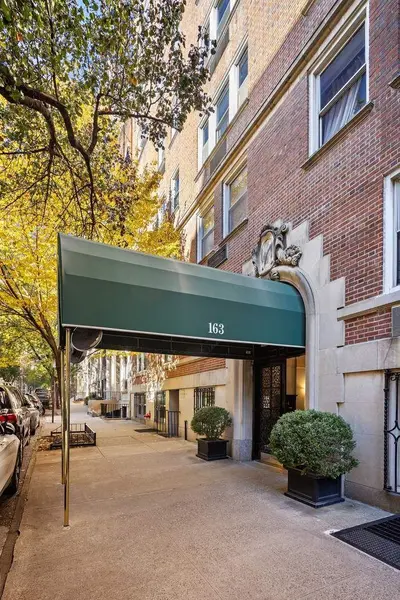
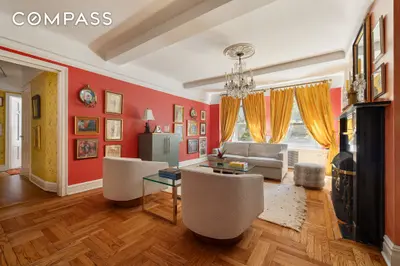

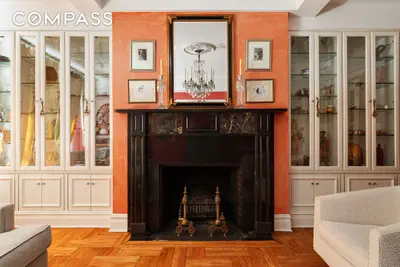
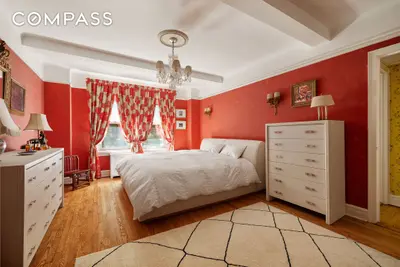
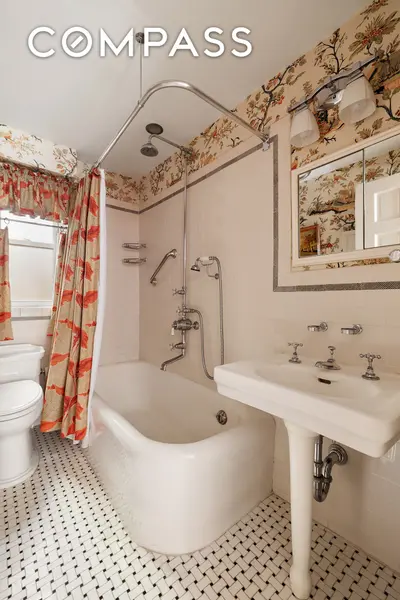
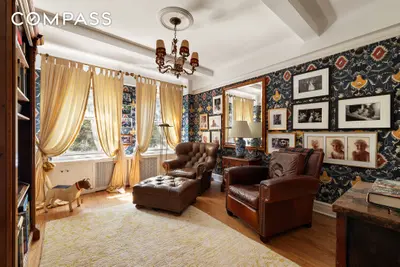
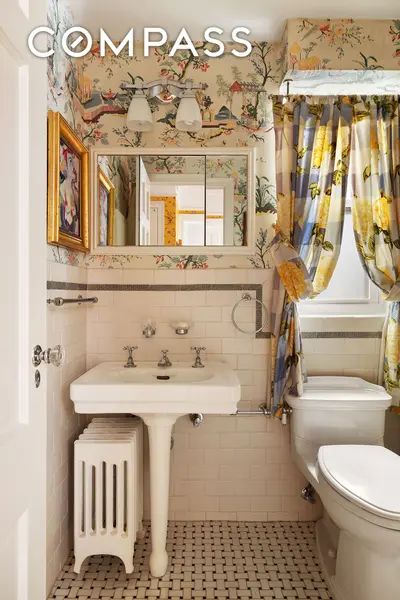
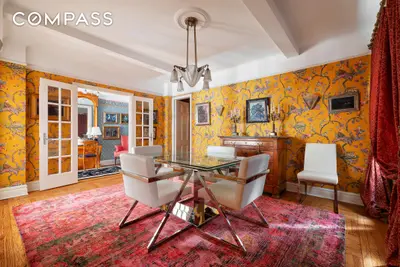
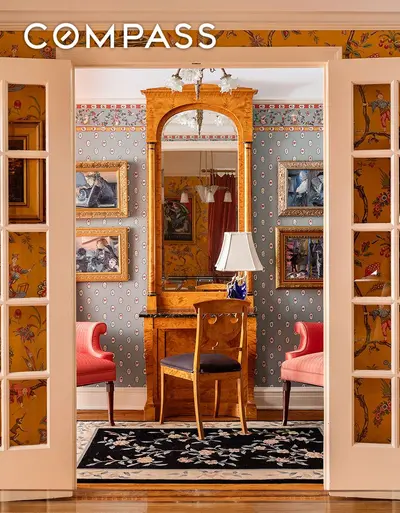
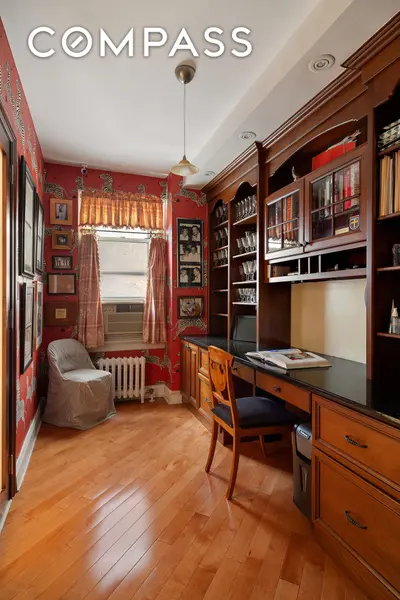
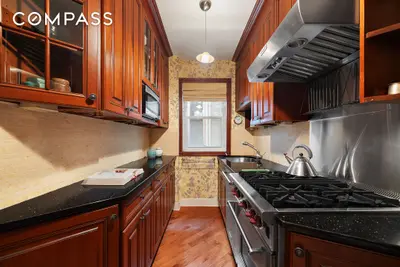
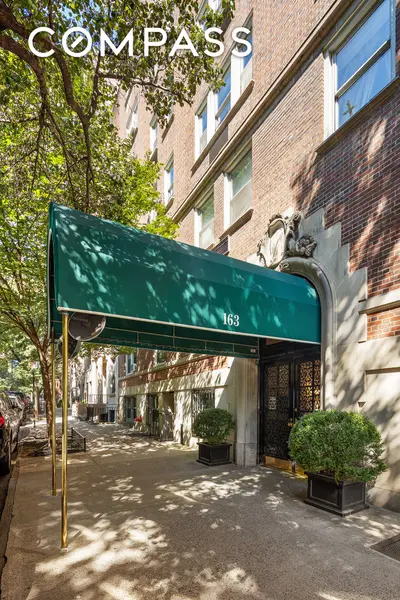
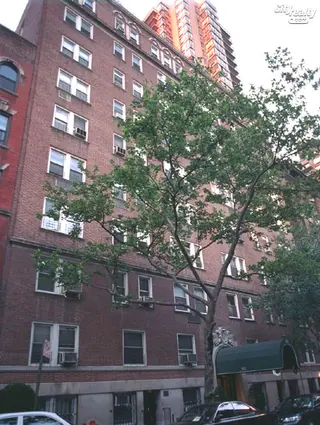
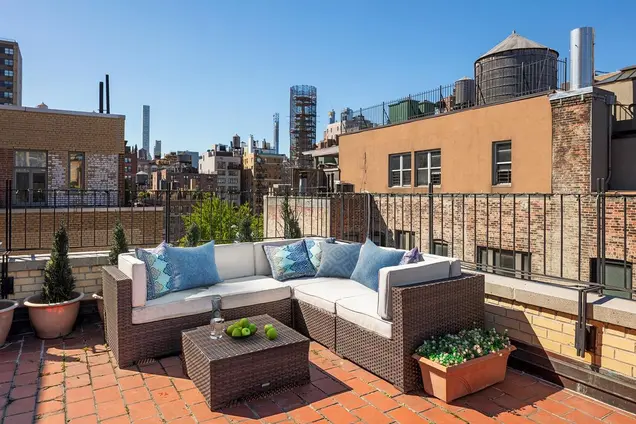
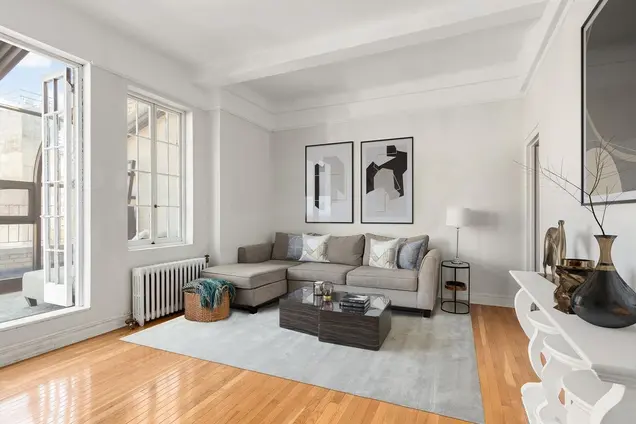
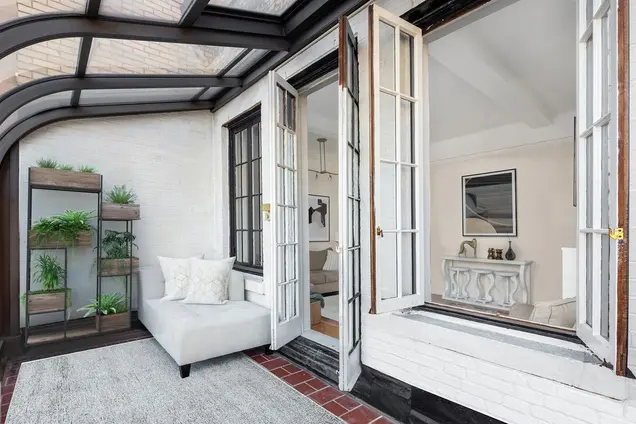
163 East 81st Street is a 10-story prewar cooperative building completed in 1927 and converted in 1947. The red-brick structure features Romanesque-style masonry, a limestone base, and an arched limestone entrance surround. The building contains 42 residential units and maintains many of its original prewar architectural details, including wood-burning fireplaces in several apartments.
The building offers full-time doorman service, a live-in superintendent, and various amenities including a laundry room, bike storage, individual storage units, and a children's playroom. The co-op's policies allow pets and pied-a-terres, with 50% financing permitted and a 2% flip tax paid by buyers.
Located on a tree-lined block between Lexington and Third Avenues, the building sits across from brownstones and enjoys a central Upper East Side location near Lenox Hill Hospital. The property provides convenient access to public transportation, with the 77th Street subway station and crosstown bus service nearby.
The building's apartments feature varying layouts, high ceilings, and large windows. Recent building improvements include a thorough exterior review and refresh, maintaining the property's historic character while ensuring modern functionality.


View school info, local attractions, transportation options & more.
Experience amazing 3D aerial maps and fly throughs.
For some co-ops, instead of price per square foot, we use an estimate of the number of rooms for each sold apartment to chart price changes over time. This is because many co-op listings do not include square footage information, and this makes it challenging to calculate accurate square-foot averages.
By displaying the price per estimated room count, we are able to provide a more reliable and consistent metric for comparing sales in the building. While we hope that this gives you a clearer sense of price trends in the building, all data should be independently verified. All data provided are only estimates and should not be used to make any purchase or sale decision.


