Shh... Many units sell without being publicly listed.
Interested in off-market listings at 45 East 89th Street? Some previously listed residences might be available – contact us for insider details on potential opportunities!
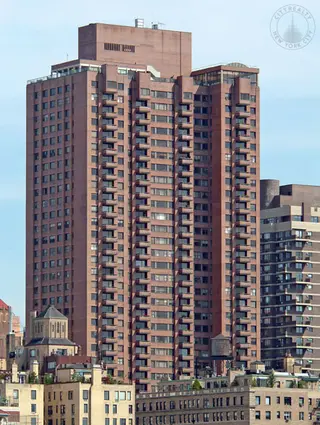
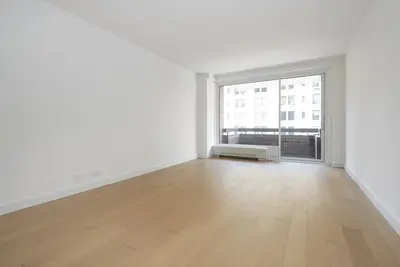
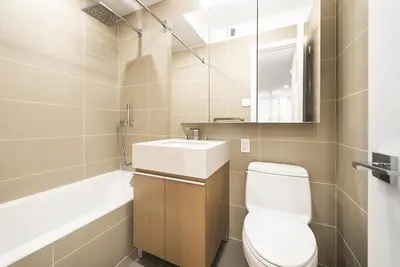
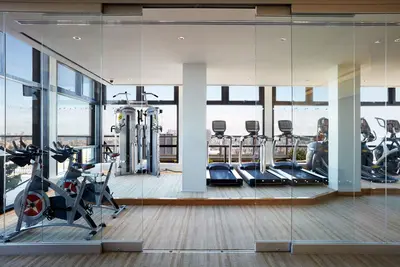
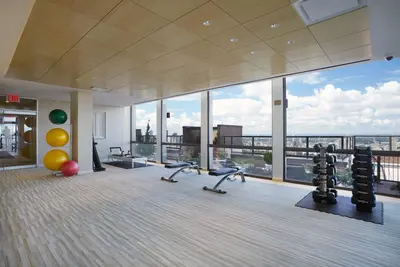
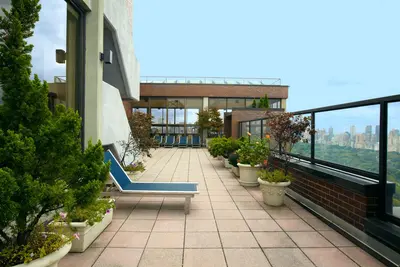
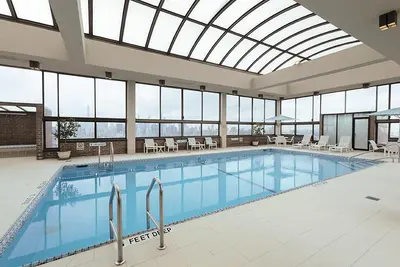
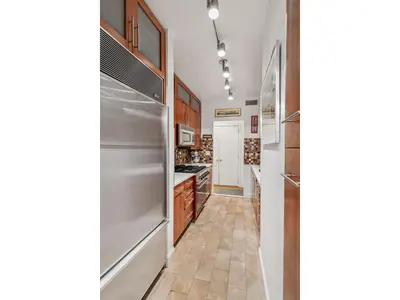
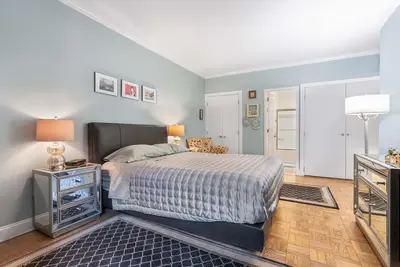
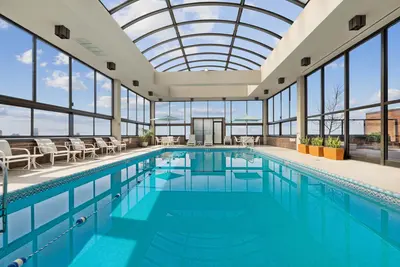
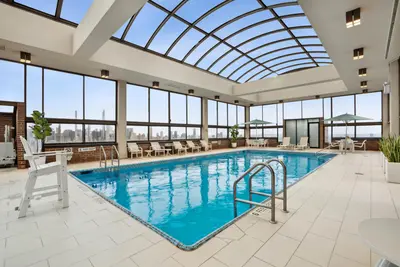
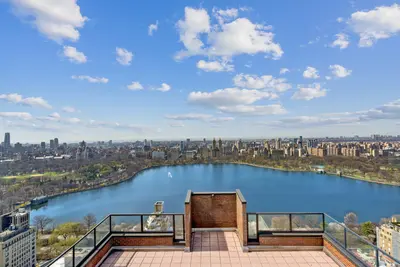
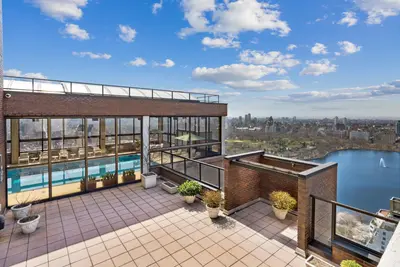
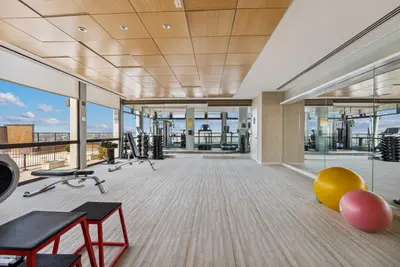
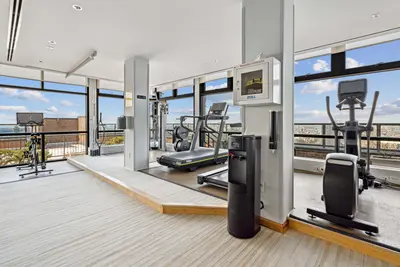
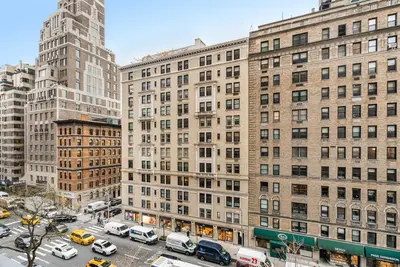
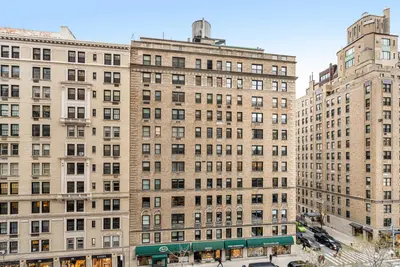
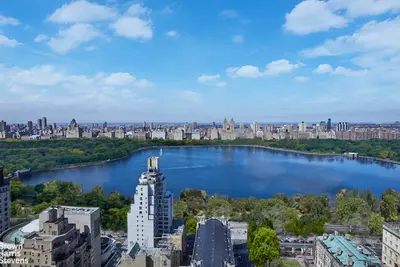
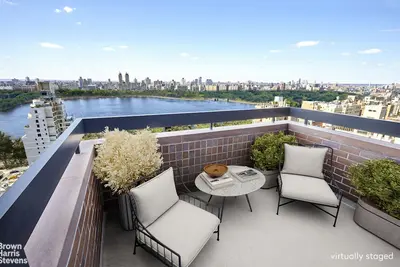
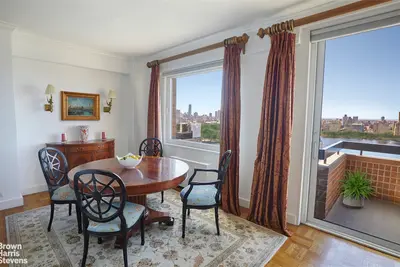
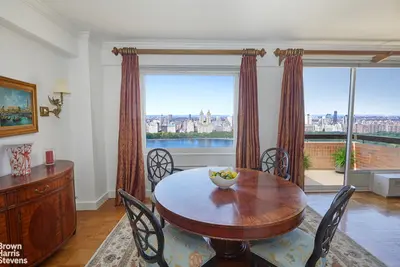
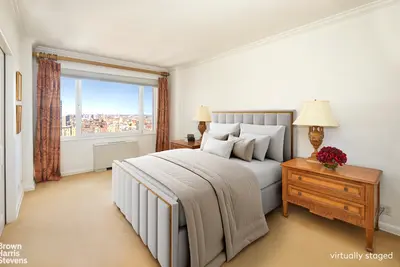
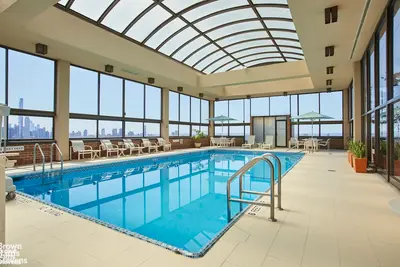
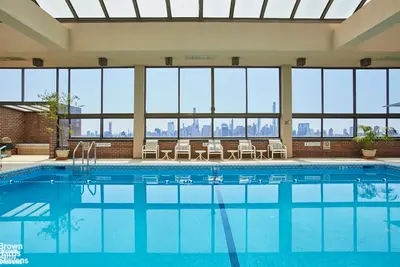
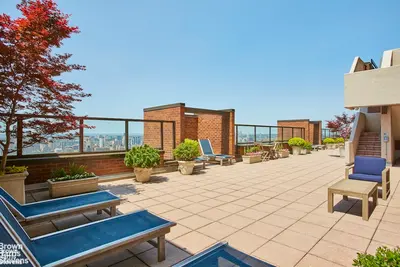
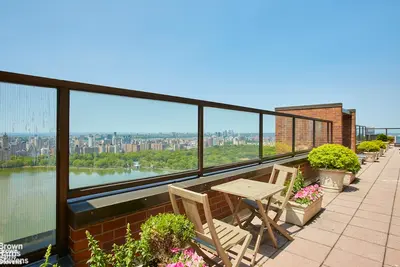
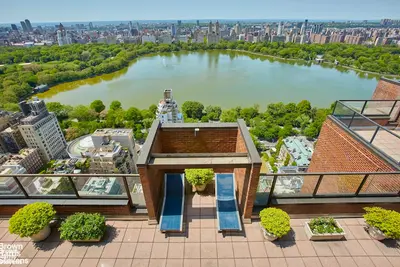
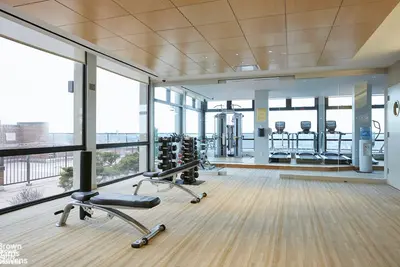
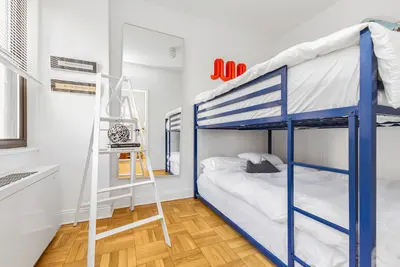
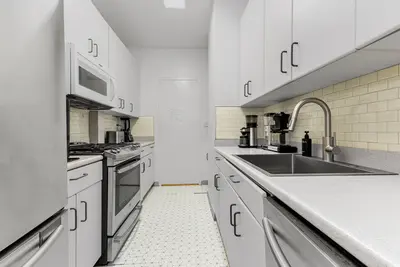
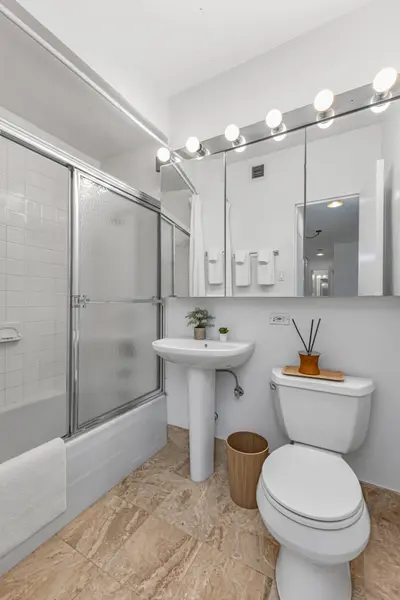
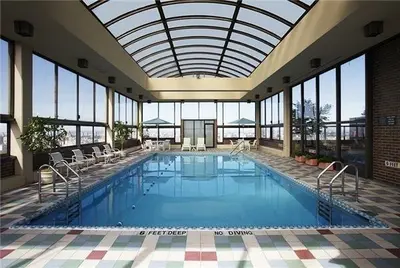

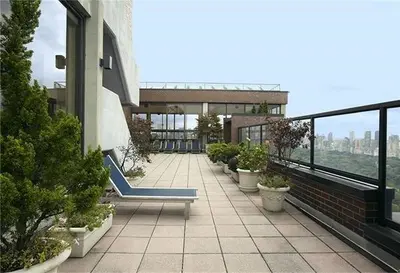
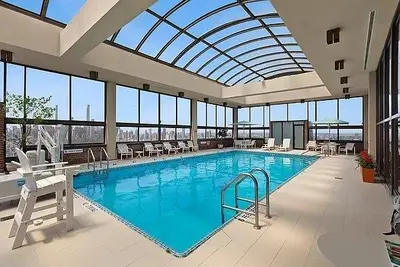


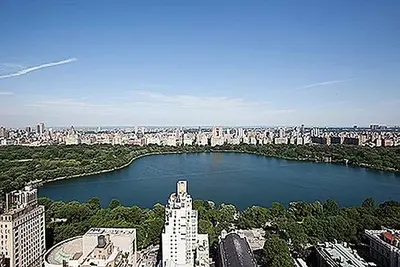
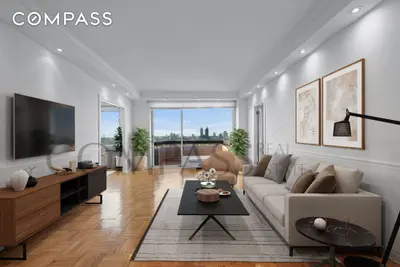
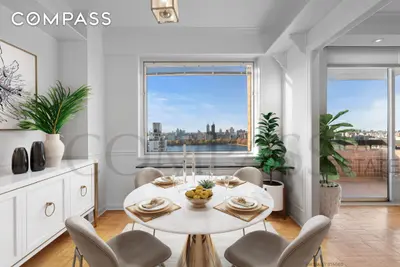
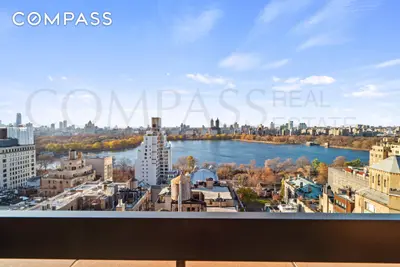
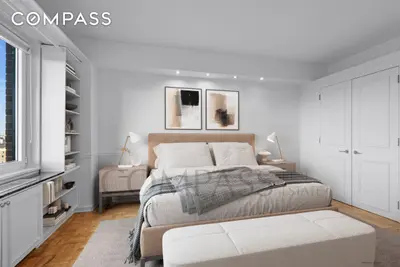
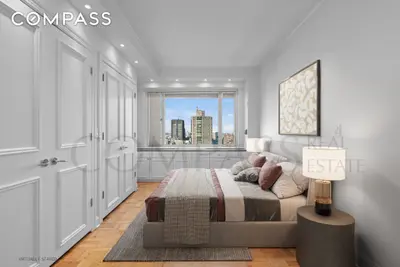
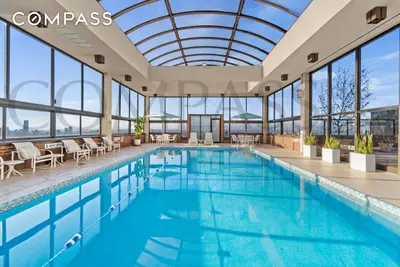
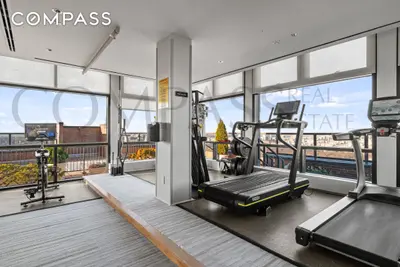
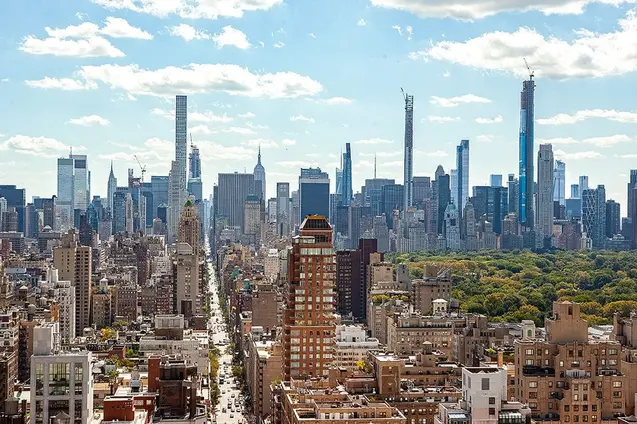
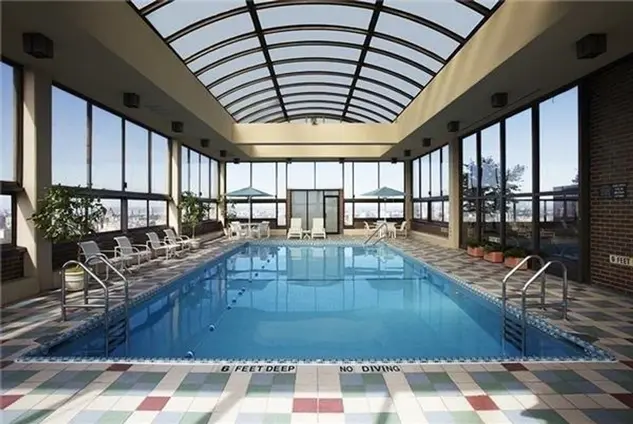
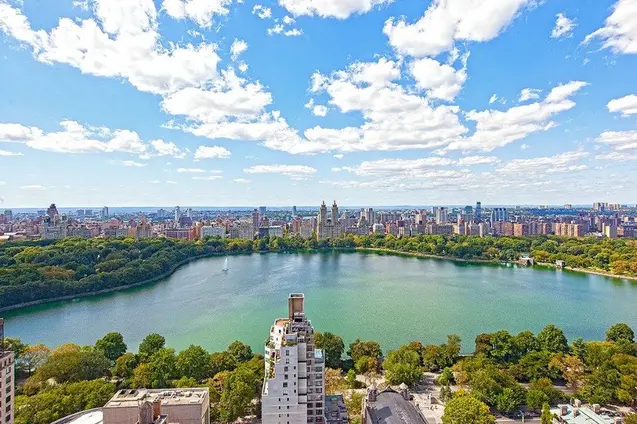
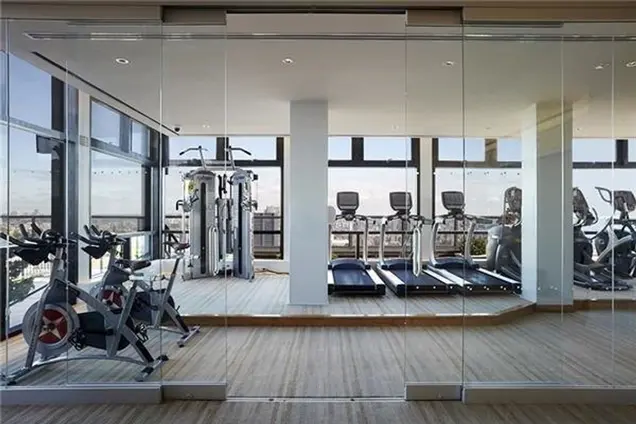
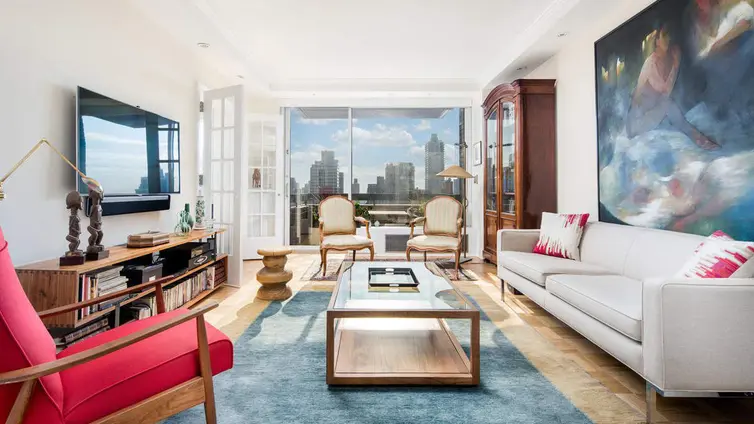
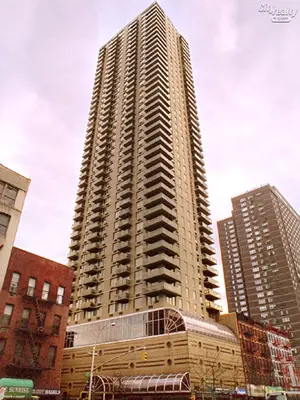
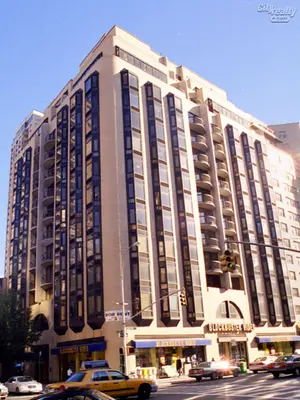
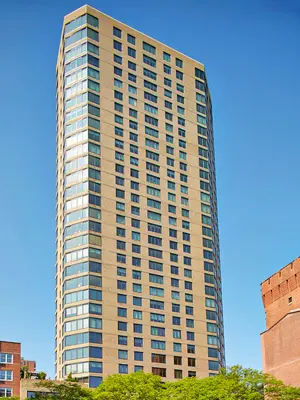
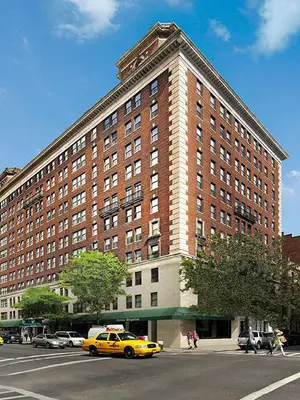
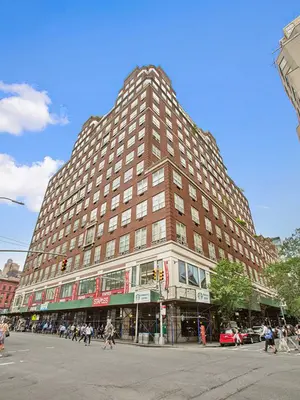
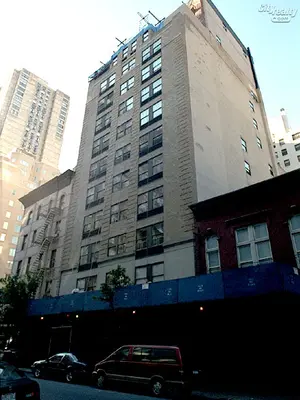
45 East 89th Street is a 38-story, 251-unit condop completed in 1969 and located in the heart of Carnegie Hill. The building has a private circular driveway, the only one of its kind on Madison Avenue, and residents have direct access through the lobby to an on-site parking garage. The roof level features a year-round, state-of-the-art fitness center overlooking Central Park, a furnished and landscaped two-story terrace, and a residents' lounge with full kitchen that can be reserved for private events. Additional amenities include a concierge, children's playroom, storage bins, and bike storage. The building is investor-, pet-, and pied-a-terre friendly.

Interested in off-market listings at 45 East 89th Street? Some previously listed residences might be available – contact us for insider details on potential opportunities!

View school info, local attractions, transportation options & more.
Experience amazing 3D aerial maps and fly throughs.
|
Year
Avg Price / Ft2 (Est)
Median Price / Ft2 (Est)
Avg. Actual Price
Med. Actual Price
Transactions
2025
-
-
-
-
0
2024
$1,796
$2,929,708
$1,796
$2,784,417
4
2023
$2,346
$3,364,286
$2,443
$3,450,000
7
2022
$1,880
$3,365,000
$1,880
$3,125,000
4
2021
$2,025
$3,707,500
$2,046
$3,425,000
6
2020
$1,824
$3,116,667
$1,824
$3,100,000
3
2019
$1,920
$2,400,000
$1,920
$2,400,000
1
2018
$1,960
$2,942,000
$1,939
$3,200,000
5
2017
$2,284
$3,324,286
$2,440
$3,000,000
7
2016
$2,456
$3,171,721
$2,590
$2,942,676
9
2015
$2,035
$3,094,607
$1,998
$2,300,000
19
2014
$1,685
$2,048,750
$1,685
$2,060,000
4
|
Year
Avg Price / Ft2 (Est)
Median Price / Ft2 (Est)
Avg. Actual Price
Med. Actual Price
Transactions
2013
$1,619
$2,735,714
$1,565
$2,065,000
7
2012
$1,655
$2,349,792
$1,818
$2,301,875
6
2011
$1,471
$1,887,475
$1,376
$1,755,000
13
2010
$1,326
$1,490,714
$1,333
$1,610,000
7
2009
$1,607
$2,614,667
$1,583
$2,280,000
9
2008
$1,745
$2,382,945
$1,731
$2,032,500
8
2007
$1,796
$1,946,277
$1,852
$1,946,438
14
2006
$1,401
$2,032,531
$1,382
$1,855,974
12
2005
$1,627
$2,371,302
$1,627
$2,100,000
10
2004
$1,146
$1,684,109
$1,194
$1,729,514
15
2003
$1,004
$1,704,628
$957
$1,432,779
22
|
the following is a slider of images. For screen reader users, all slides are visible at all time so you may ignore control buttons.
Sign-up and we'll email you new listings in this building!
Whether you’re a buyer, investor, or simply curious, this report is your key to unlocking in-depth insights and analysis on .
Please confirm your details:


Broker & Buyer Comments