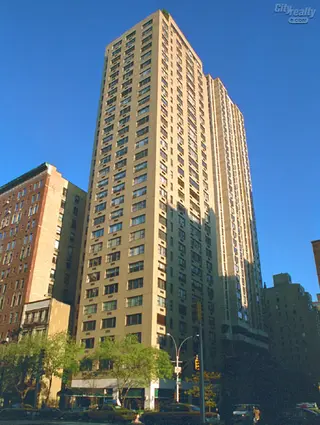
The Carlton Park, 1065 Park Avenue - Carnegie Hill
- Apartments
- Overview & Photos
- Maps
- Floorplans
- Sales Data & Comps
- Similar Buildings
- All Units


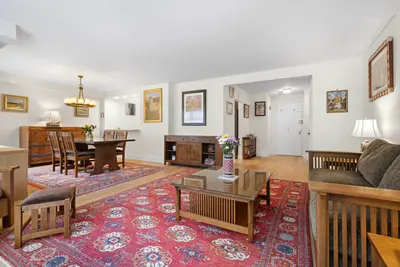
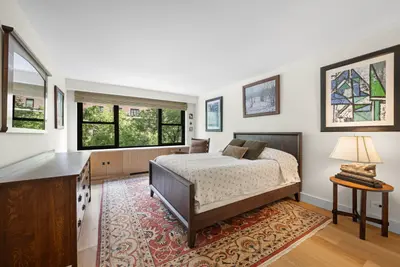


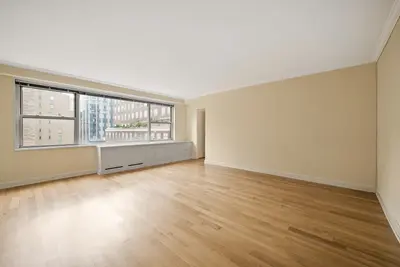

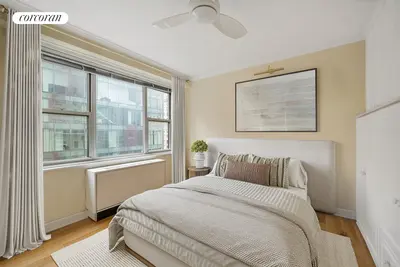

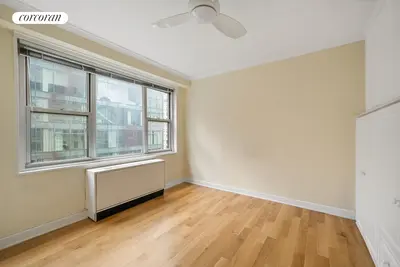
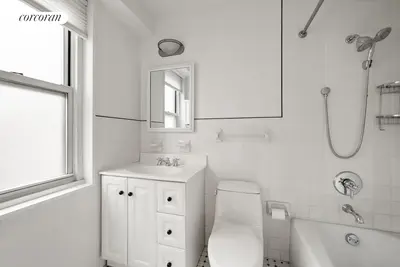

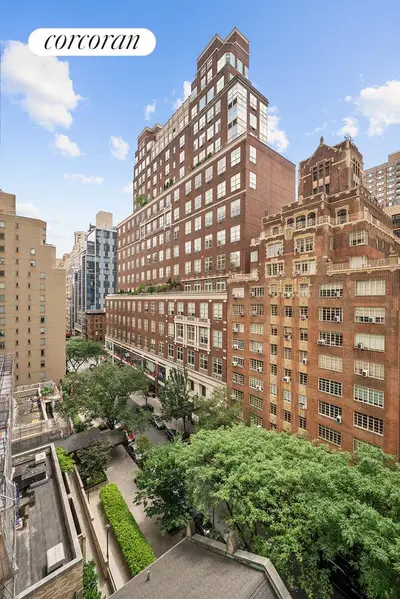
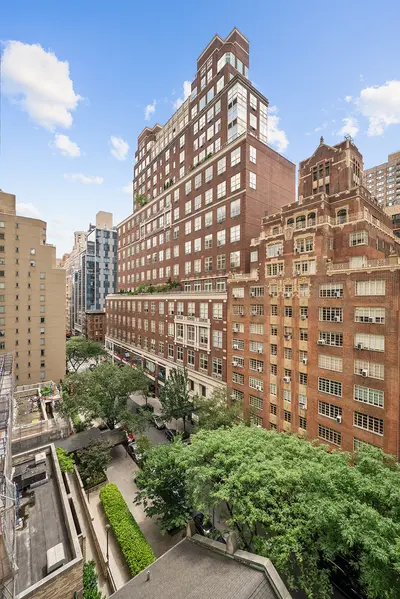


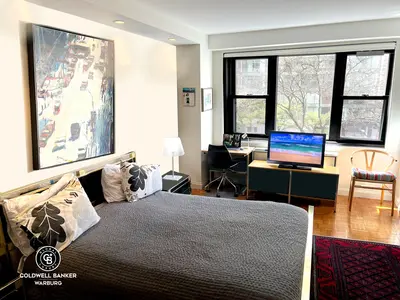


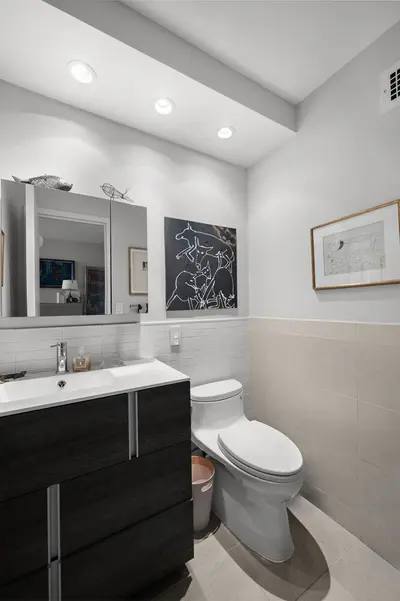


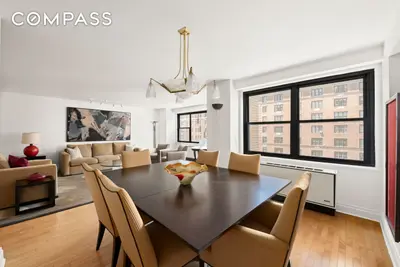


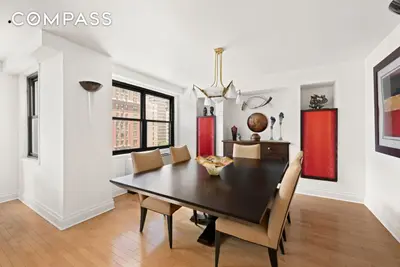


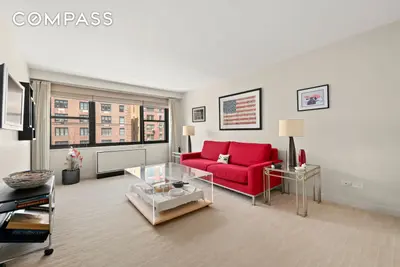


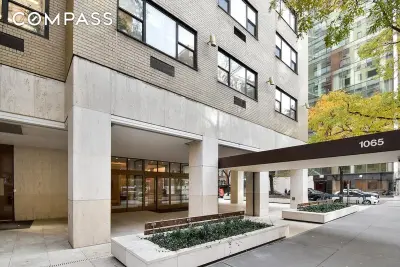
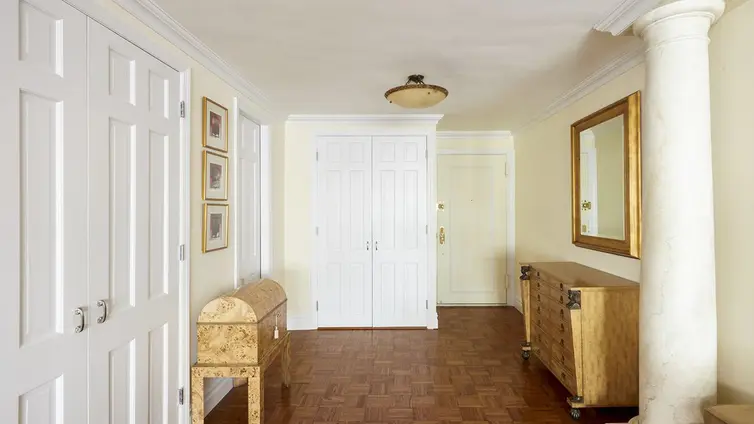
1065 Park Avenue was built in 1974 and has a total of 106 apartments. Located in Carnegie Hill, The Carlton Park is very close to the 4, 5 and 6 subway lines.
There are currently 4 apartments for sale at 1065 Park Avenue, ranging in price from $575,000 to $2,045,000. The most recent closing in the building was in September 2025 - a six plus bedroom that closed for $660,000.
During the past two years, 11 apartments have sold: the most expensive was a four bedroom that sold for $3,100,000, and the least expensive was a one bedroom that sold for $560,000.
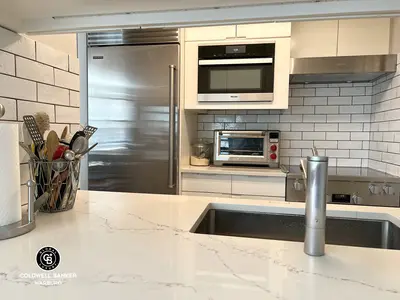
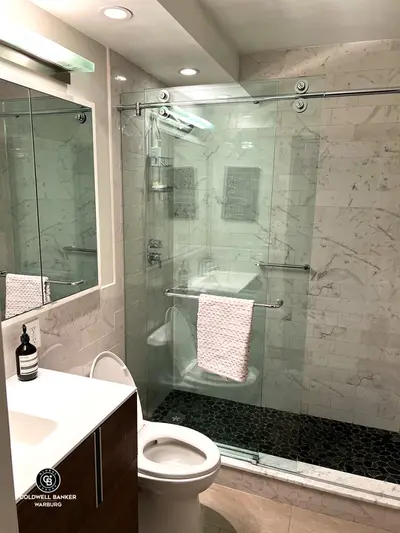
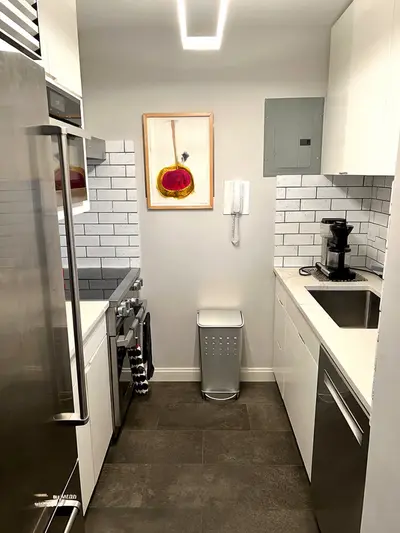
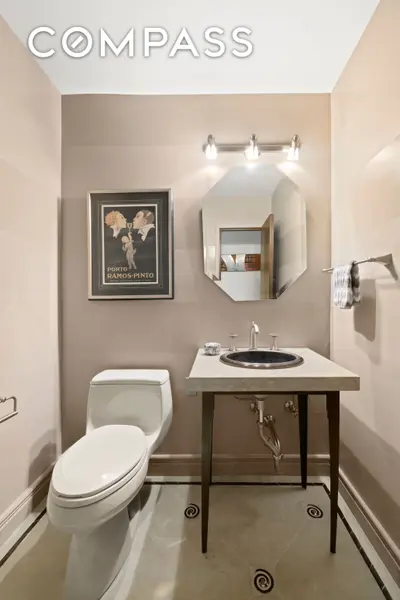
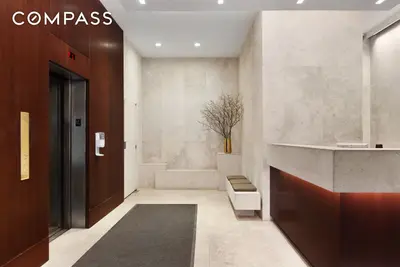
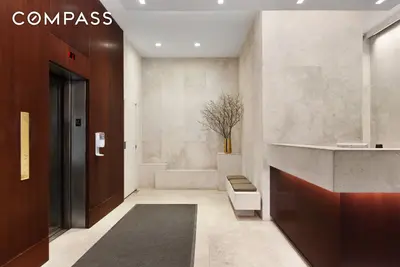
Amenities at this post war building include doorman, rooftop terrace, concierge and central ac.
Similar nearby buildings include 1060 Park Avenue, 993 Park Avenue, 120 East 81st Street and 309 East 87th Street.

View school info, local attractions, transportation options & more.
Experience amazing 3D aerial maps and fly throughs.
For some co-ops, instead of price per square foot, we use an estimate of the number of rooms for each sold apartment to chart price changes over time. This is because many co-op listings do not include square footage information, and this makes it challenging to calculate accurate square-foot averages.
By displaying the price per estimated room count, we are able to provide a more reliable and consistent metric for comparing sales in the building. While we hope that this gives you a clearer sense of price trends in the building, all data should be independently verified. All data provided are only estimates and should not be used to make any purchase or sale decision.