The Alden, 225 Central Park West - Upper West Side
- Apartments
- Overview & Photos
- Maps
- Floorplans
- Sales Data & Comps
- Similar Buildings
- All Units

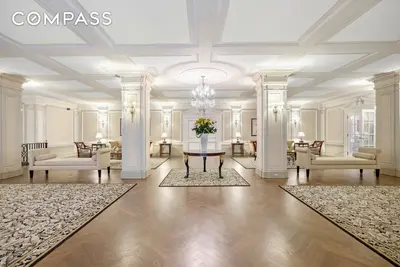

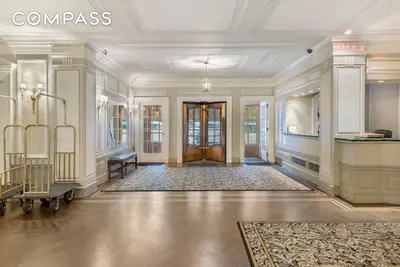
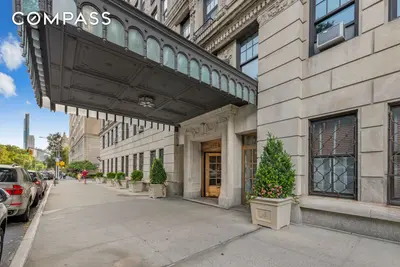
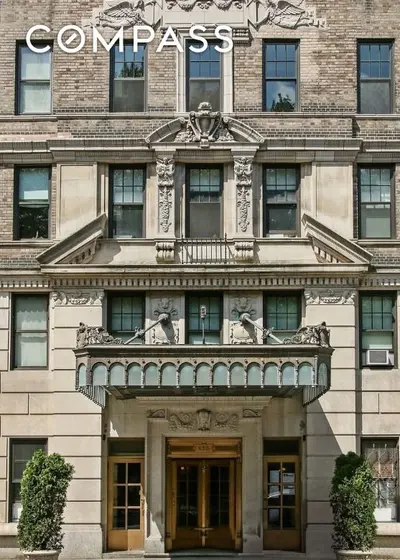
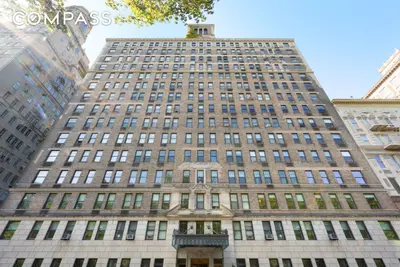

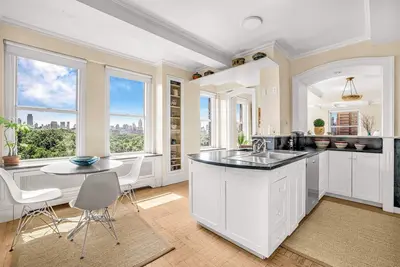


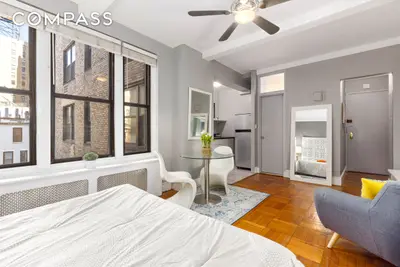


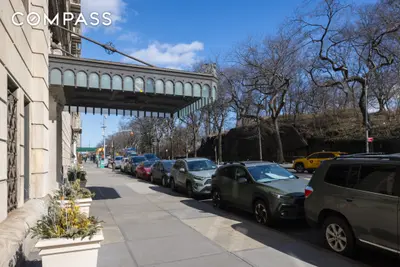
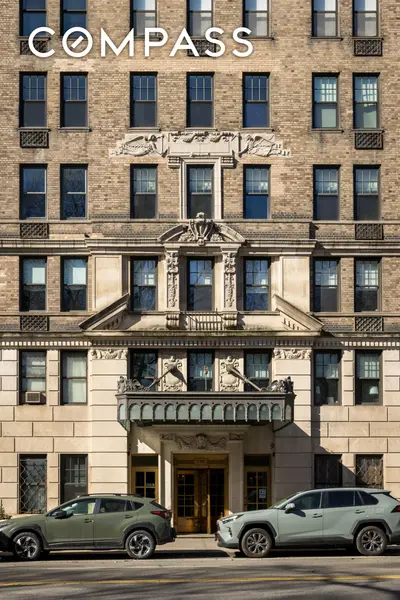
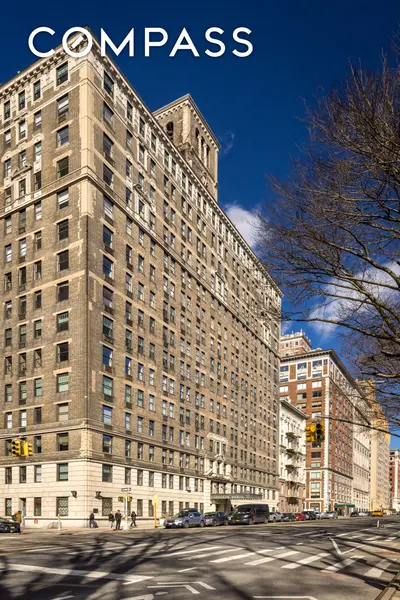

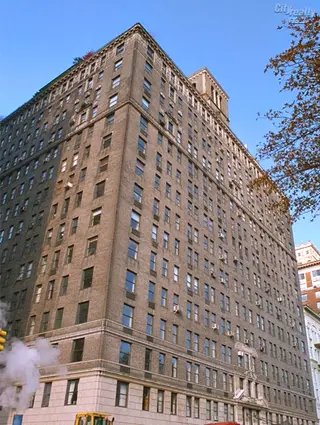
The Alden stands as one of Central Park West's distinguished prewar cooperatives, designed by renowned architect Emery Roth in 1926 and developed by Bing & Bing. This 15 story landmarked building at 225 Central Park West features Neo Renaissance architecture with beige brick façade and a two story rusticated limestone base. The building was converted to a co-op in 1984 and contains 250 apartments ranging from studios to four bedroom residences, many offering coveted Central Park views.
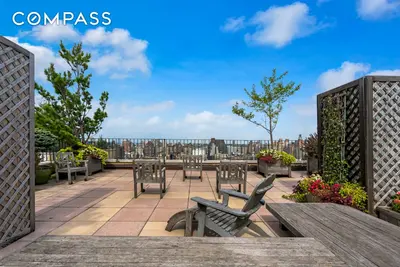
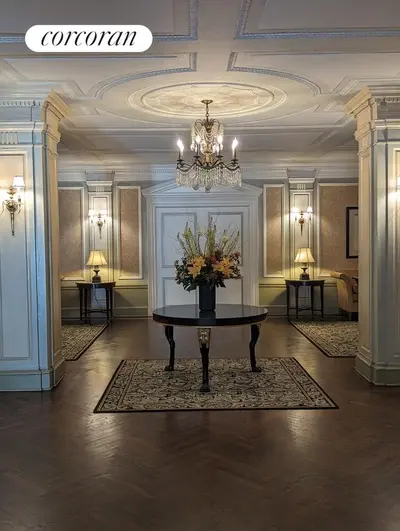
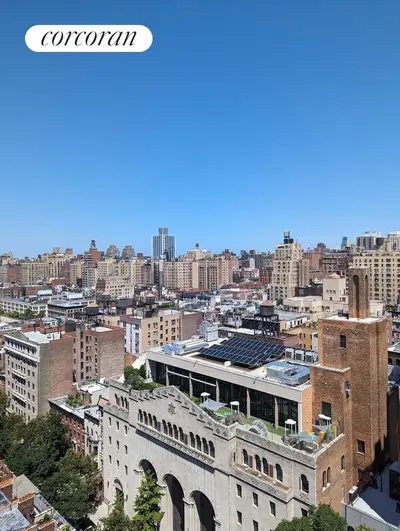
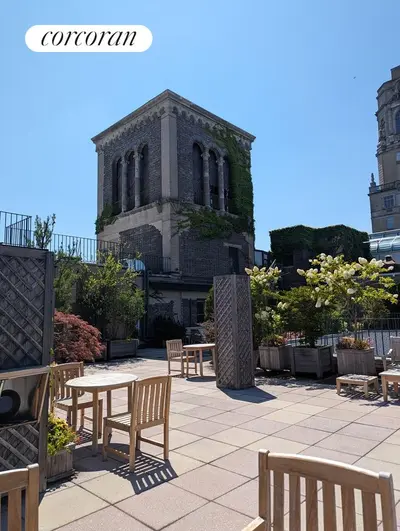
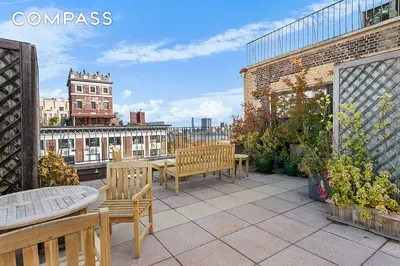
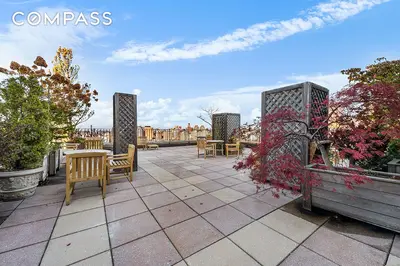
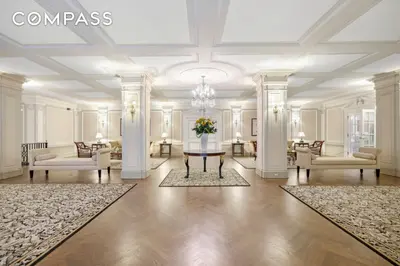
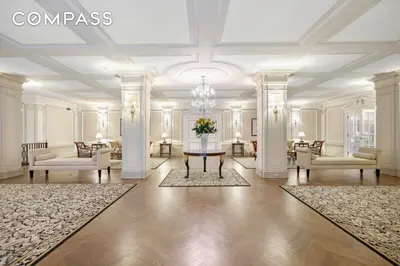
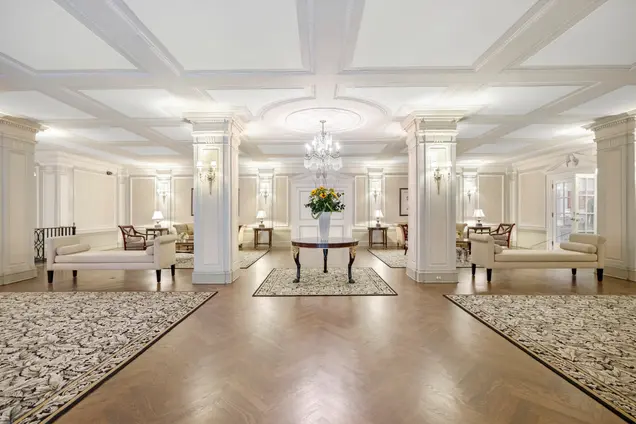
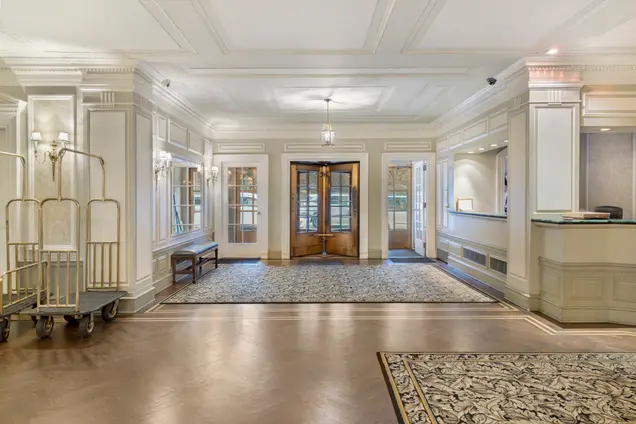
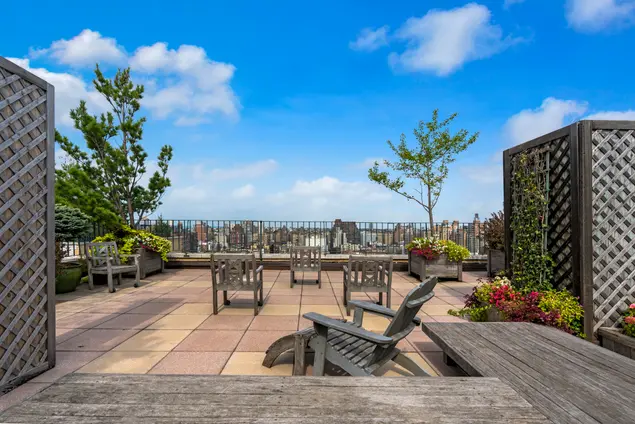
Residents enjoy white glove service with a 24 hour doorman, concierge, live-in superintendent, and on-site resident manager. The building's crown jewel is its furnished roof deck with panoramic views of Central Park and the Jacqueline Kennedy Onassis Reservoir, which notably served as the location for the final shot in the movie "The Big Short." Additional amenities include garage access from within the building, bike storage, central laundry facilities, a library, and five elevators.
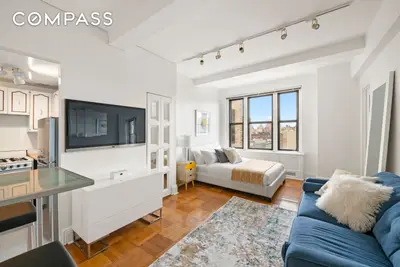
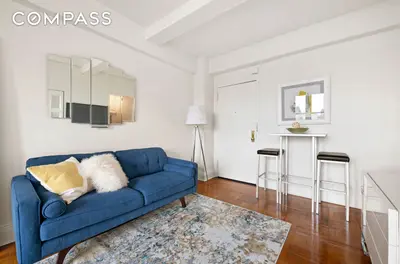
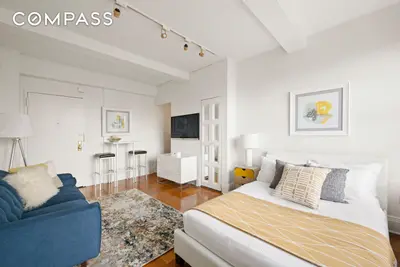
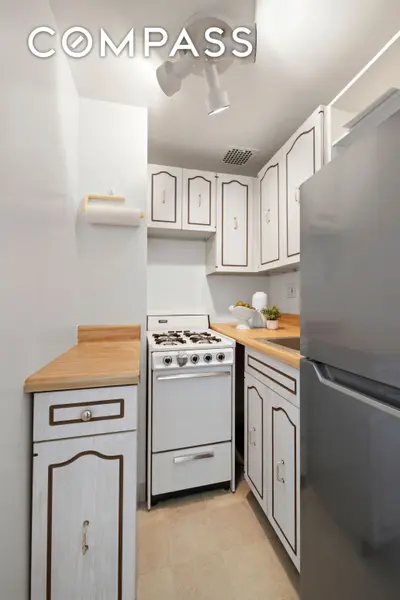
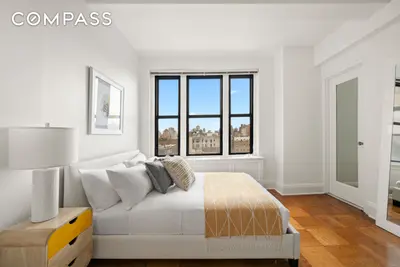
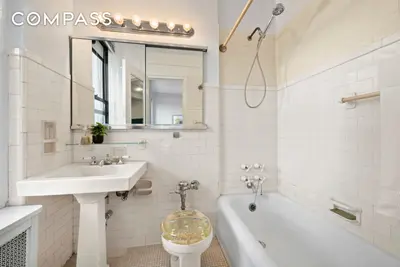
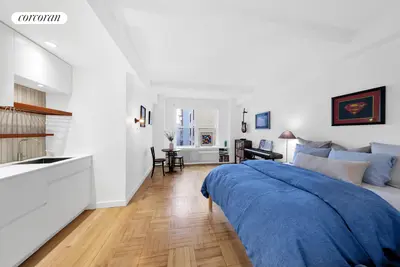
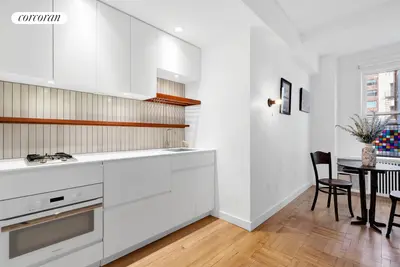
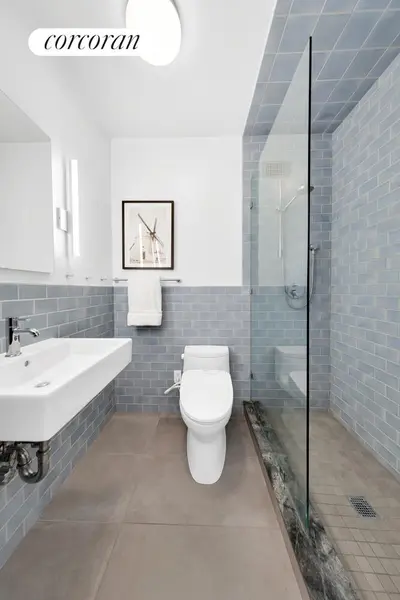
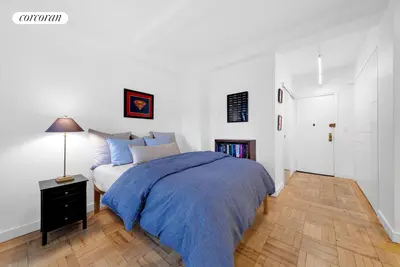
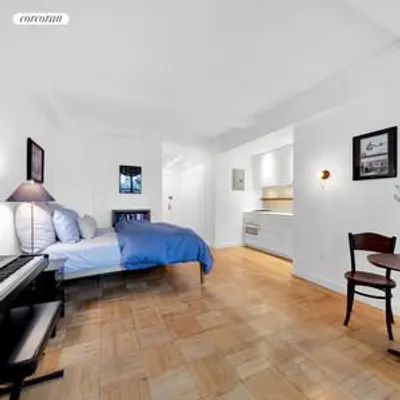
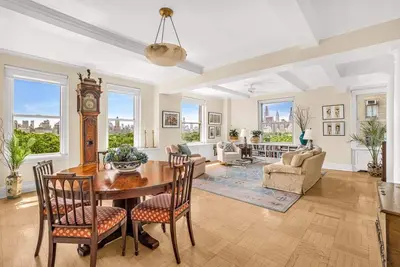
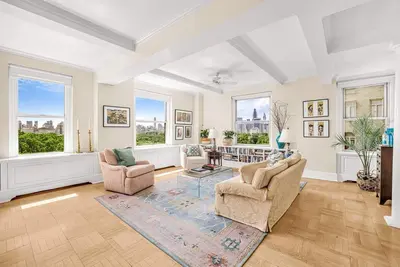
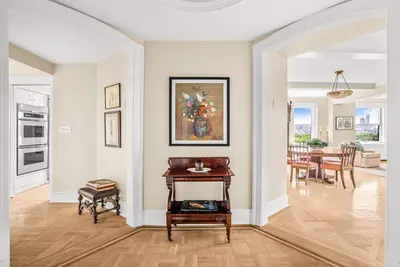
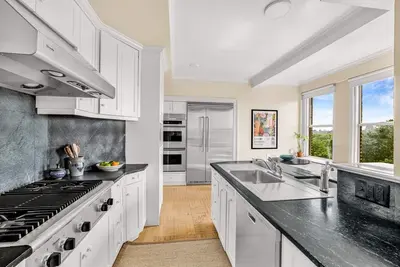
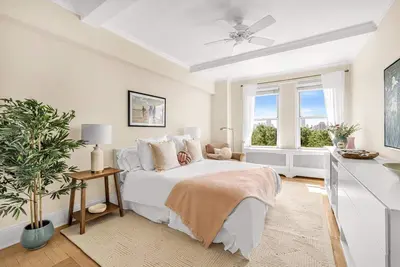
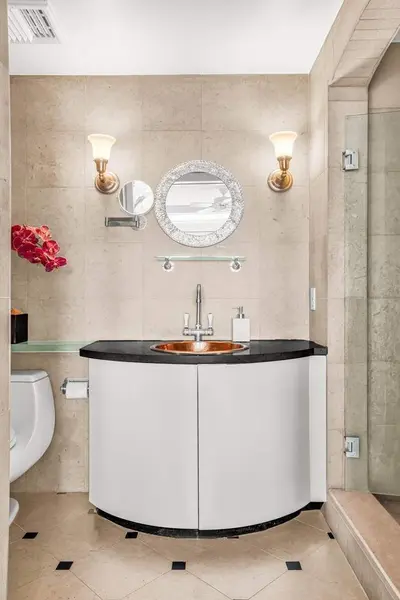
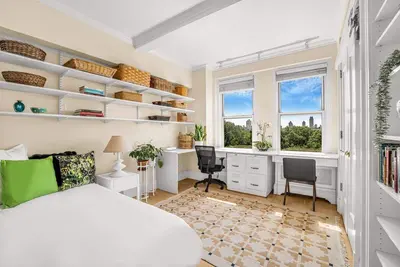
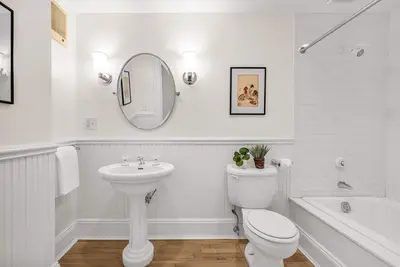
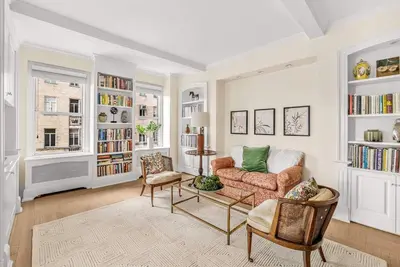
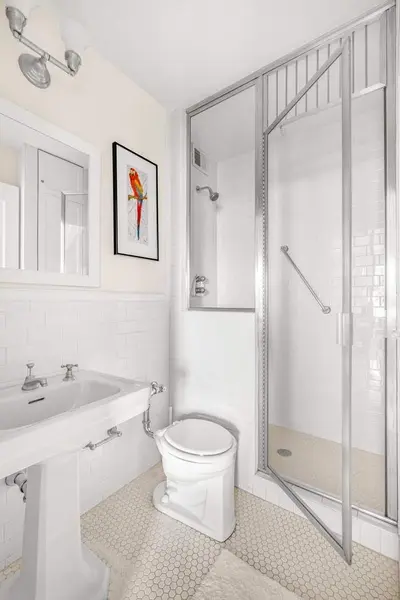
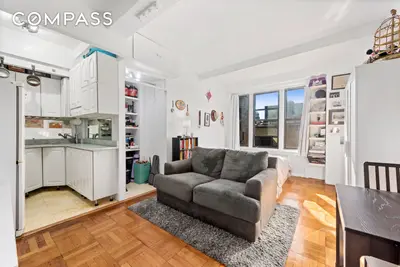
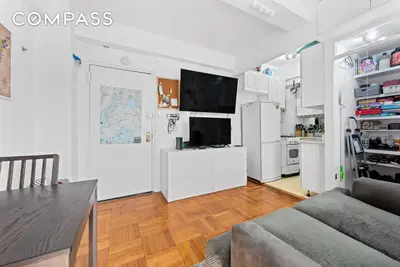
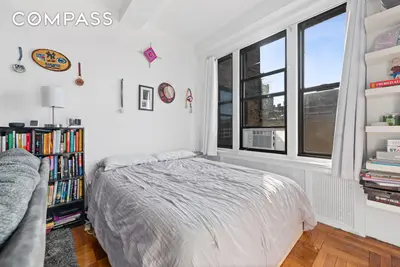
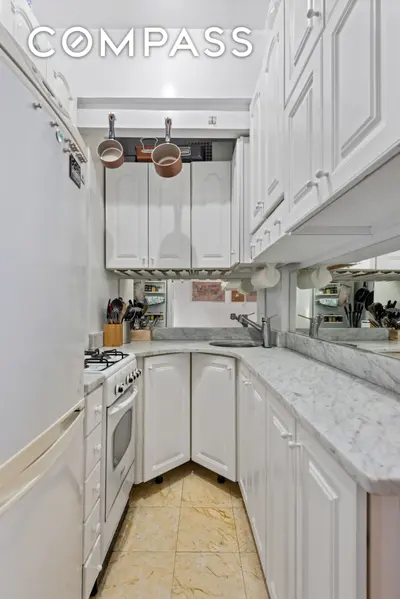
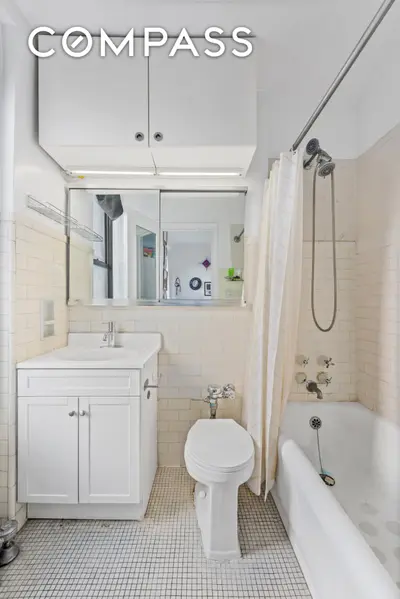
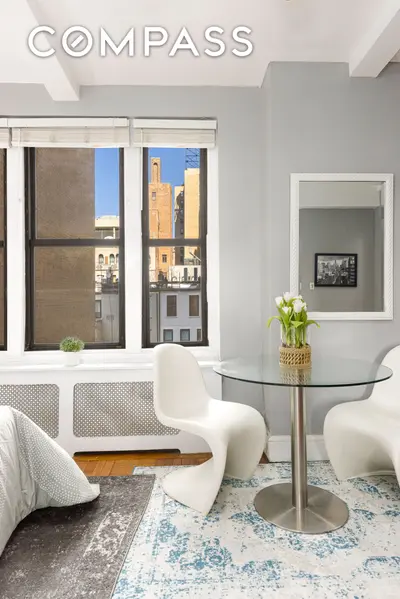
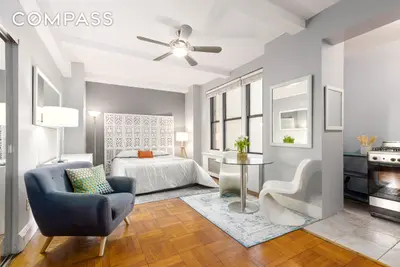
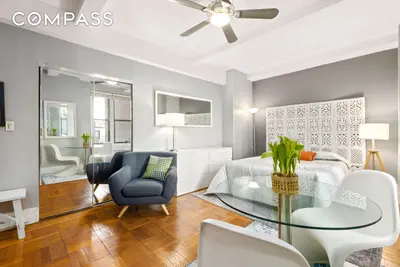
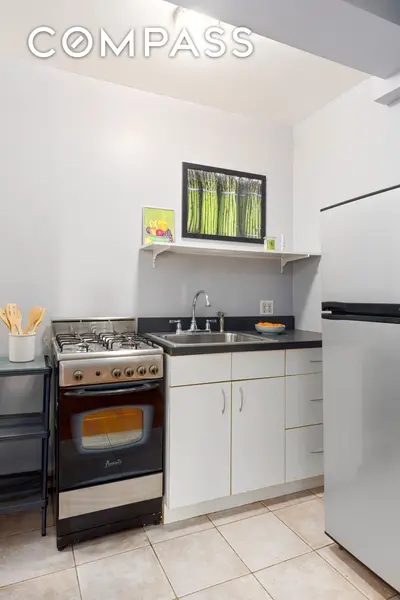
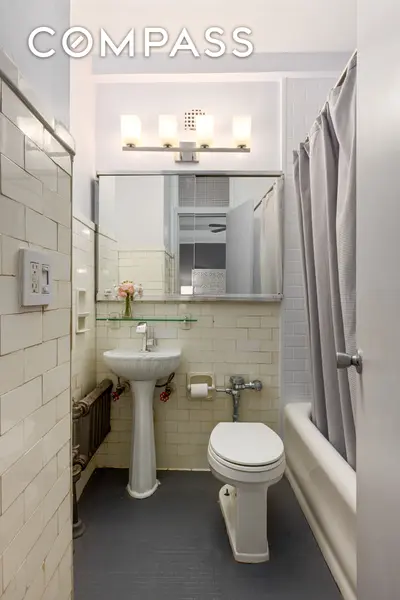
Apartments at The Alden showcase classic prewar details including high beamed ceilings (typically 9 feet or more), hardwood floors, and oversized windows. Many units have been thoughtfully renovated with modern kitchens featuring high end appliances and luxurious marble bathrooms. Notable residences include penthouse units with expansive terraces, such as Penthouse 1701 with its 33 foot roof terrace, and Apartment 1706 featuring a 60 foot Central Park facing terrace that wraps around the corner.
The building's prime location directly across from Central Park places residents steps from the American Museum of Natural History, with convenient access to B/C subway lines and crosstown transportation. The Alden welcomes pets and considers pied-à-terre purchases case by case, with financing permitted up to 60 percent and no flip tax, making it an attractive option for both primary residents and those seeking a Manhattan retreat.


View school info, local attractions, transportation options & more.
Experience amazing 3D aerial maps and fly throughs.
For some co-ops, instead of price per square foot, we use an estimate of the number of rooms for each sold apartment to chart price changes over time. This is because many co-op listings do not include square footage information, and this makes it challenging to calculate accurate square-foot averages.
By displaying the price per estimated room count, we are able to provide a more reliable and consistent metric for comparing sales in the building. While we hope that this gives you a clearer sense of price trends in the building, all data should be independently verified. All data provided are only estimates and should not be used to make any purchase or sale decision.
Broker & Buyer Comments