Shh... Many units sell without being publicly listed.
Limited off-market opportunities might be available at 300 West 23rd Street – ideal for those looking to explore listings not currently on the market. Contact us to learn more.
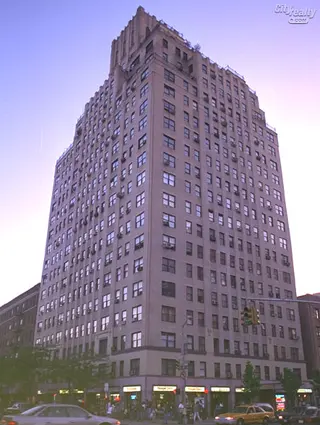
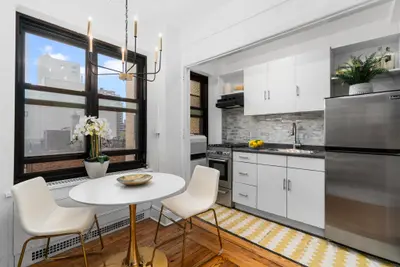
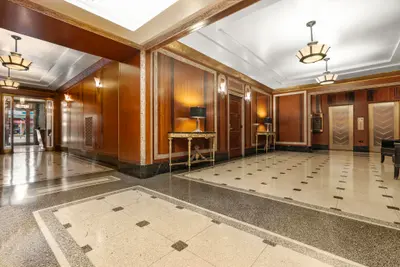
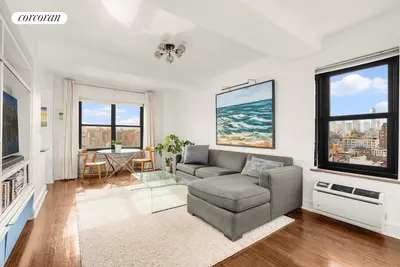
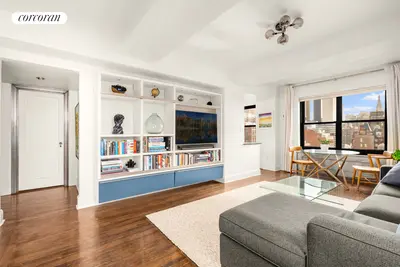
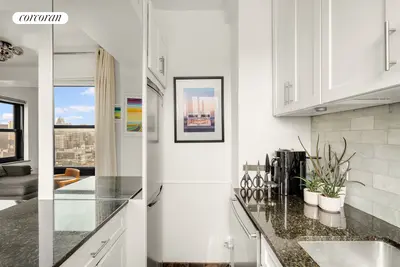
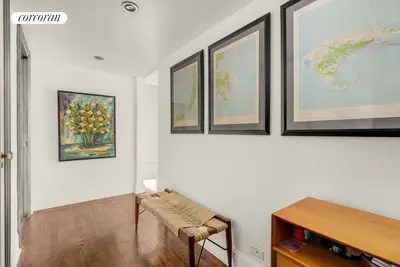
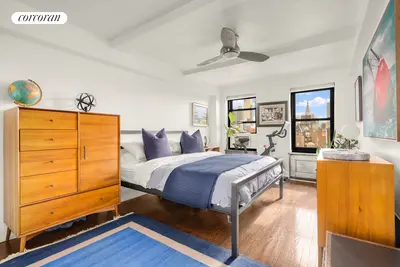
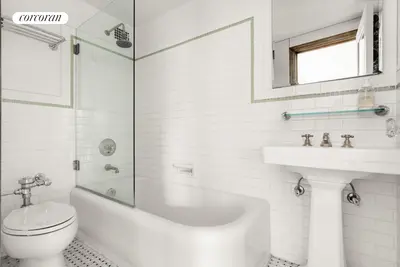
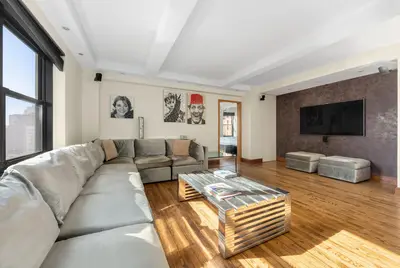
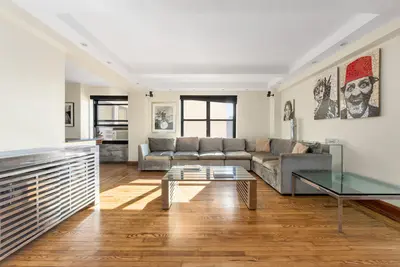
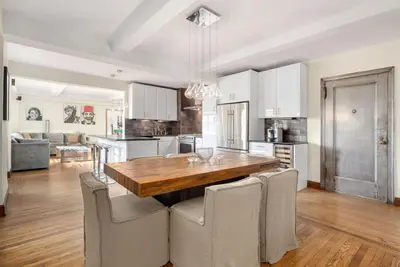
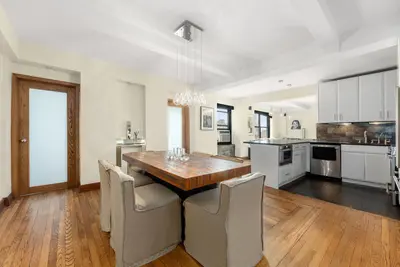
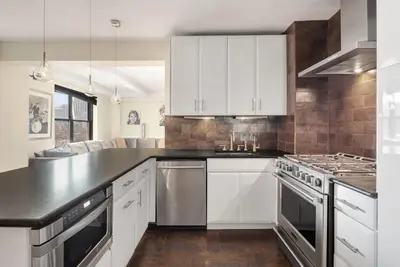
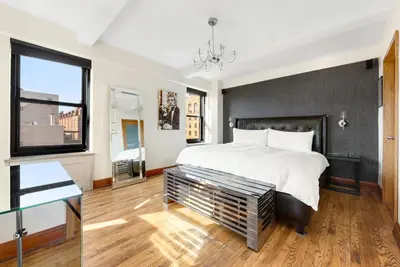
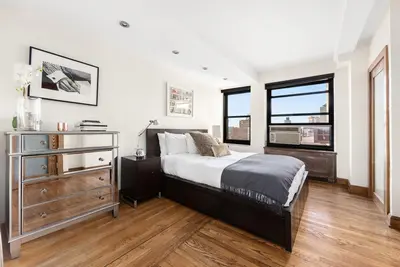
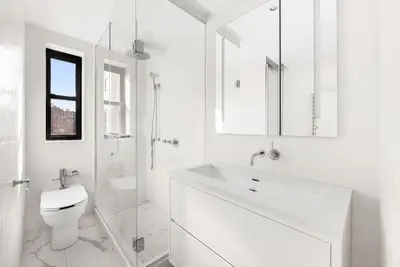
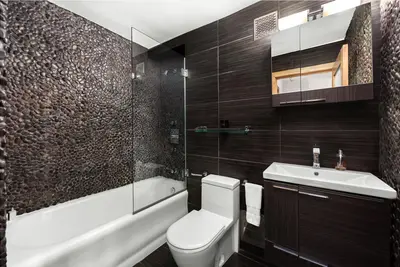

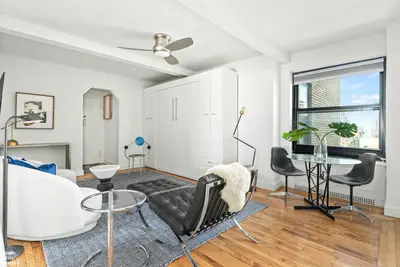
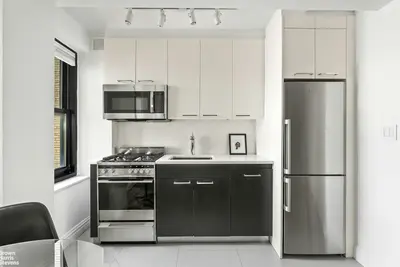
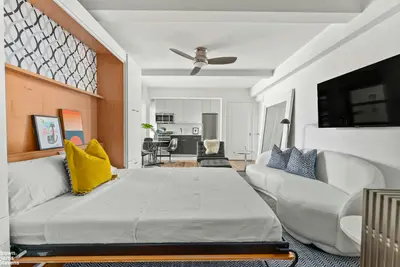
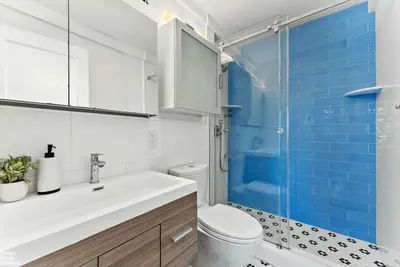
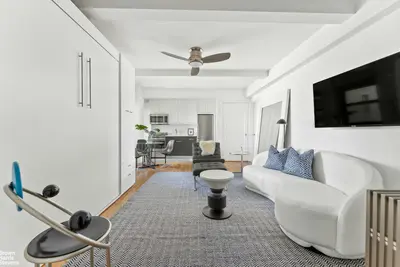
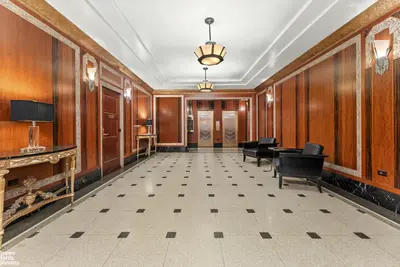


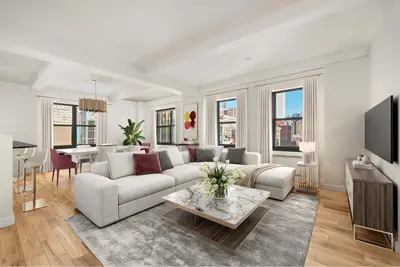
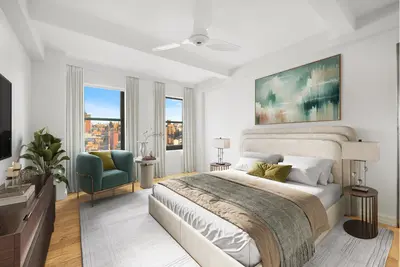
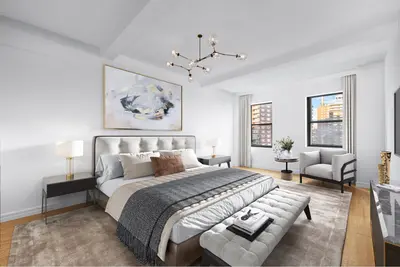
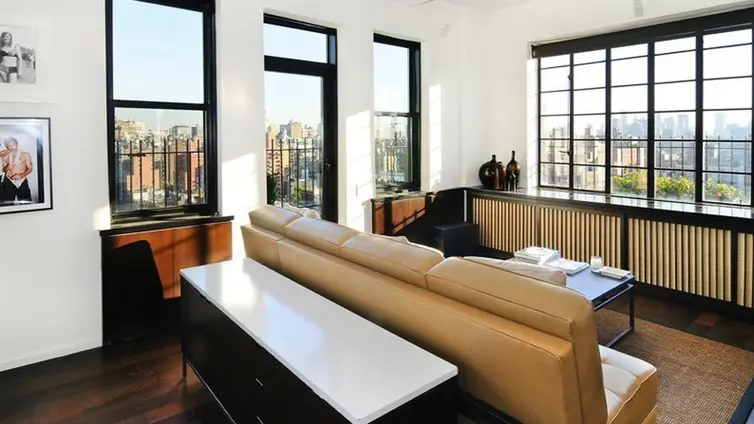
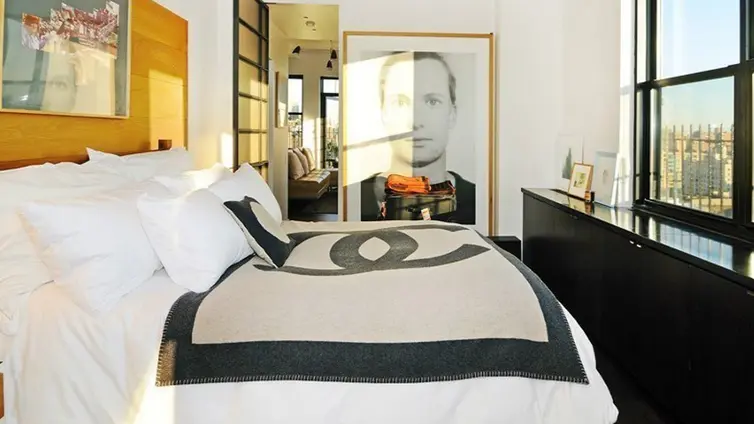
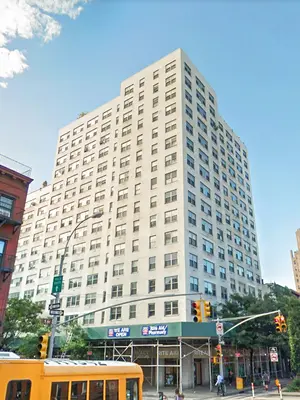
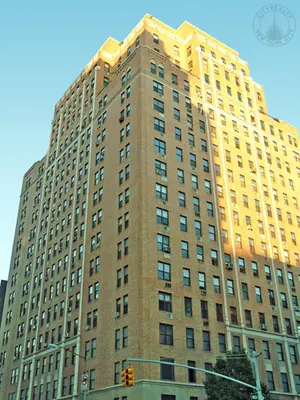
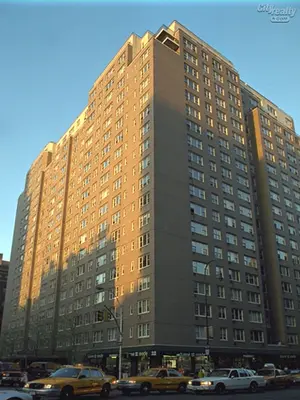
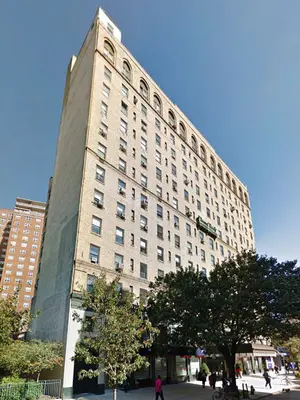
300 West 23rd Street is a 19-story, 218-unit prewar cooperative designed by Emery Roth and beautifully restored to period perfection inside and out. Amenities include 24-hour doorman, live-in resident building manager, laundry room, bike room, and additional onsite storage space for rent.
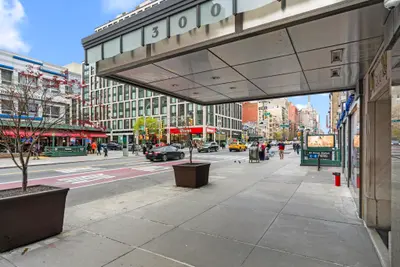
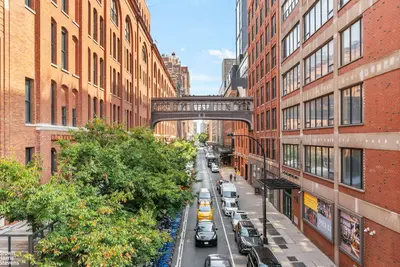
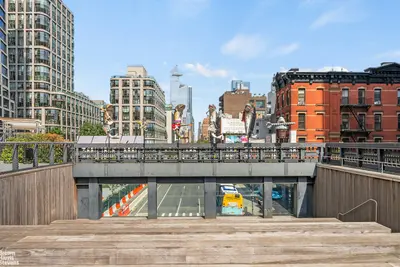
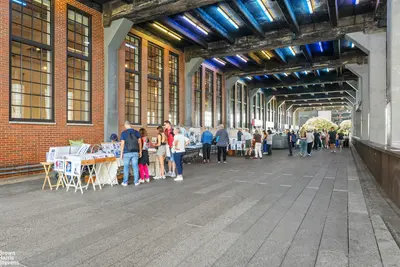
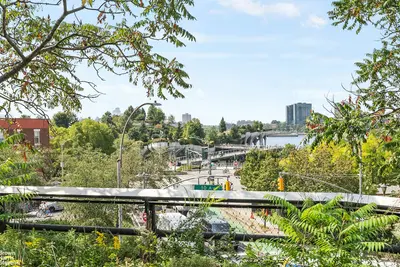
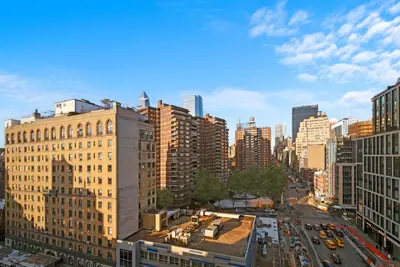
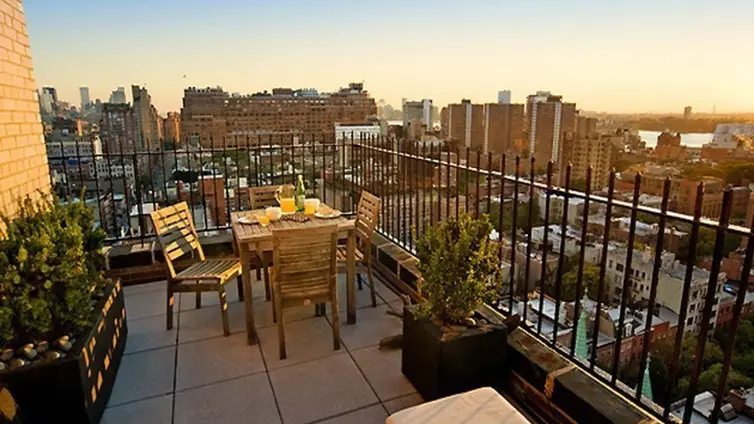
300 West 23rd Street is in a prime Chelsea location near the subway, popular restaurants, and Hudson River Park. Pets, pied-a-terres, co-purchasing, and parents buying for children are all permitted.

Limited off-market opportunities might be available at 300 West 23rd Street – ideal for those looking to explore listings not currently on the market. Contact us to learn more.

View school info, local attractions, transportation options & more.
Experience amazing 3D aerial maps and fly throughs.
For some co-ops, instead of price per square foot, we use an estimate of the number of rooms for each sold apartment to chart price changes over time. This is because many co-op listings do not include square footage information, and this makes it challenging to calculate accurate square-foot averages.
By displaying the price per estimated room count, we are able to provide a more reliable and consistent metric for comparing sales in the building. While we hope that this gives you a clearer sense of price trends in the building, all data should be independently verified. All data provided are only estimates and should not be used to make any purchase or sale decision.
|
Year
Avg Price / Room (Est)
Avg. Actual Price
Med. Actual Price
Transactions
2025
$197,806
$630,000
3
2024
$214,167
$531,667
3
2023
$176,220
$541,786
7
2022
$255,055
$848,083
12
2021
$360,417
$1,058,500
8
2020
$229,952
$910,375
4
2019
$223,927
$659,000
11
2018
$222,200
$702,000
5
2017
$236,447
$826,818
11
2016
$411,891
$1,646,250
4
2015
$252,689
$945,636
11
2014
$223,550
$698,833
12
|
Year
Avg Price / Room (Est)
Avg. Actual Price
Med. Actual Price
Transactions
2013
$236,833
$699,500
15
2012
$188,974
$646,611
9
2011
$173,604
$549,500
16
2010
$159,305
$480,500
8
2009
$156,200
$439,000
5
2008
$225,705
$649,857
7
2007
$230,267
$676,000
11
2006
$205,242
$594,000
11
2005
$200,961
$787,042
12
2004
$120,745
$345,915
19
2003
$129,445
$347,191
15
|
the following is a slider of images. For screen reader users, all slides are visible at all time so you may ignore control buttons.
Sign-up and we'll email you new listings in this building!
Whether you’re a buyer, investor, or simply curious, this report is your key to unlocking in-depth insights and analysis on .
Please confirm your details:


Broker & Buyer Comments