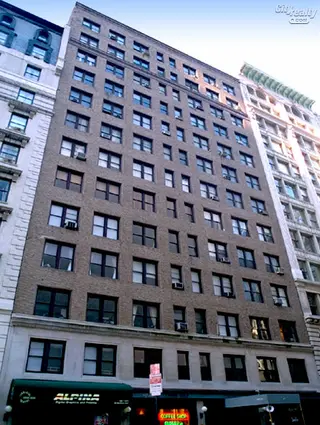
The Madison Parq, 66 Madison Avenue - Flatiron/Union Square
- Apartments
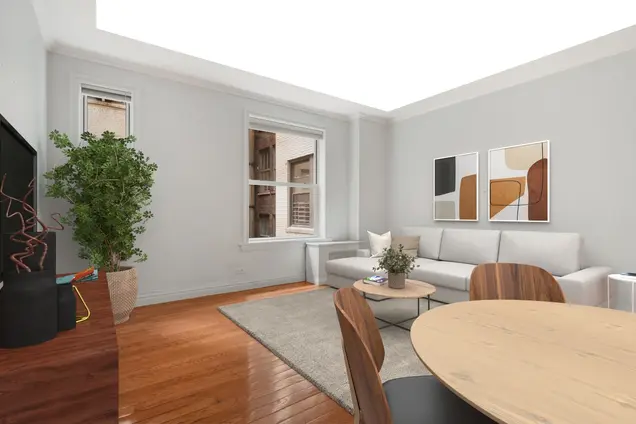
- Overview & Photos
- Maps
- Floorplans
- Sales Data & Comps
- Similar Buildings
- All Units


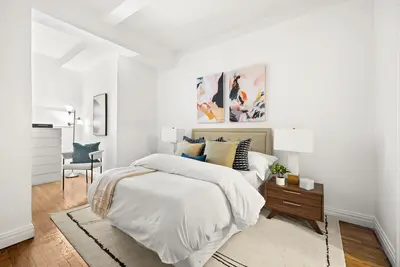

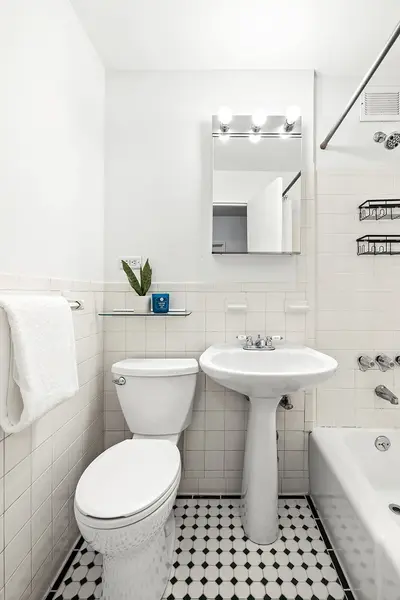
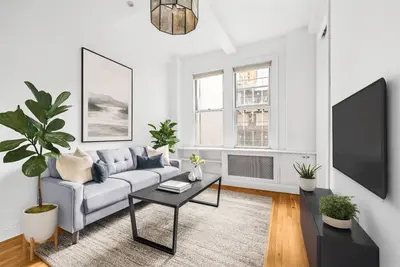
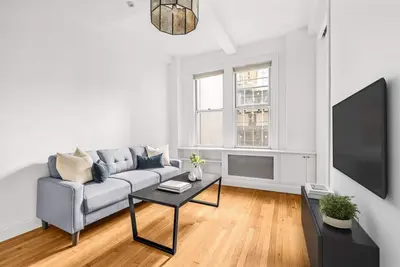
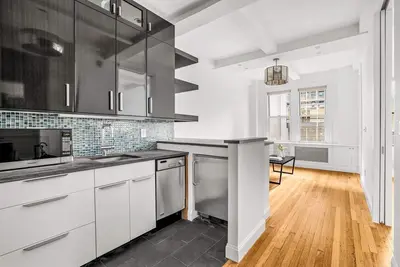
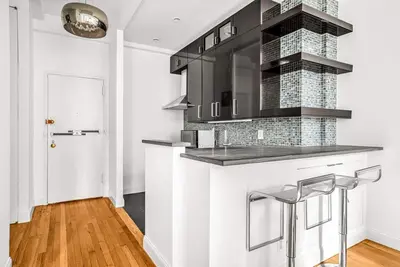
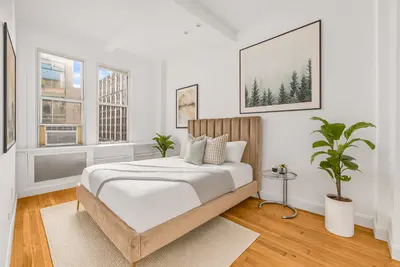
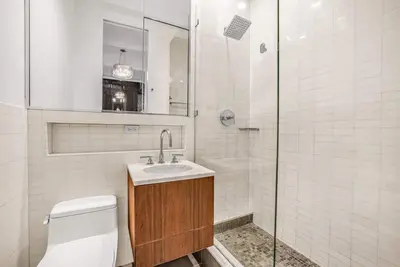
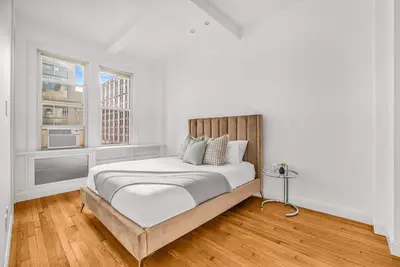


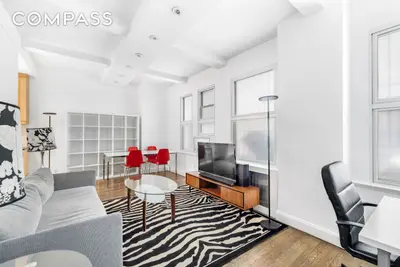
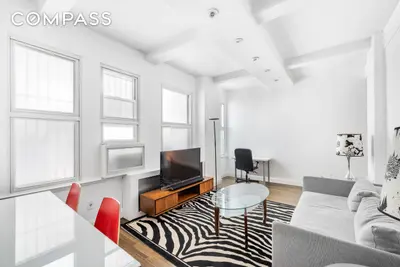
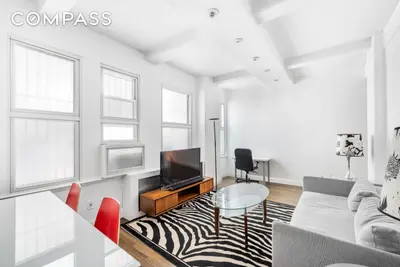

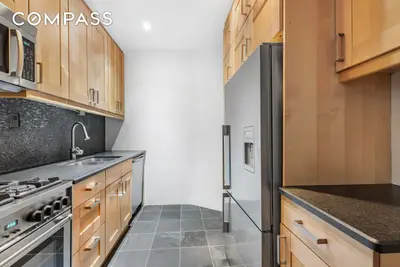

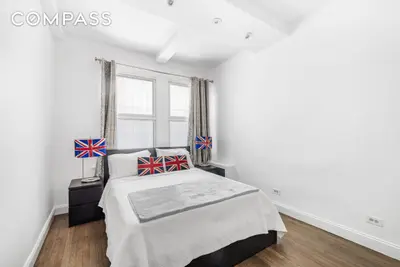
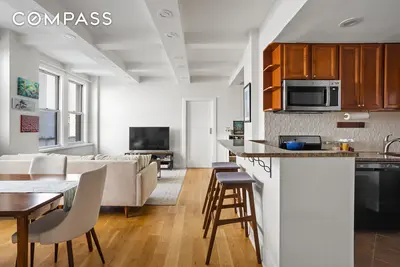


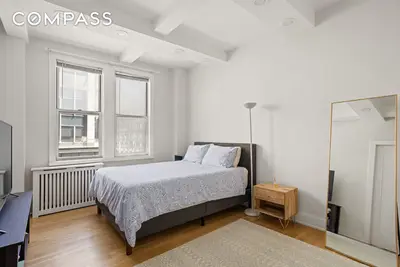


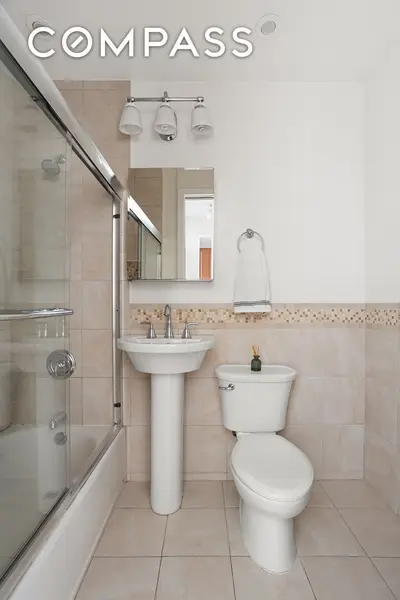

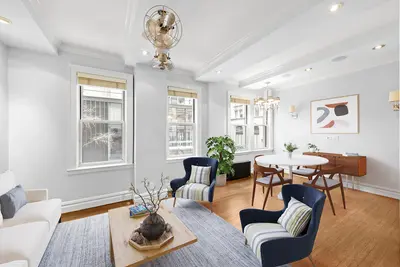


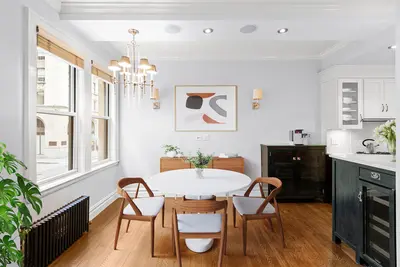
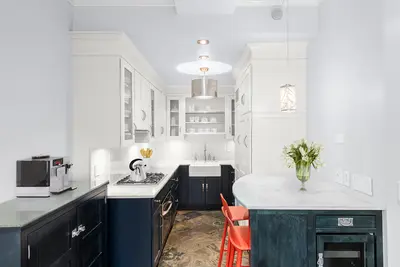
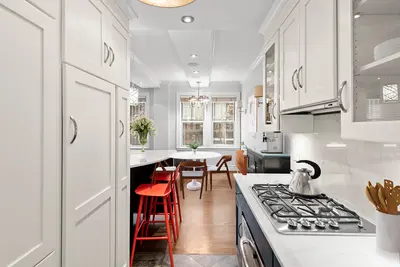
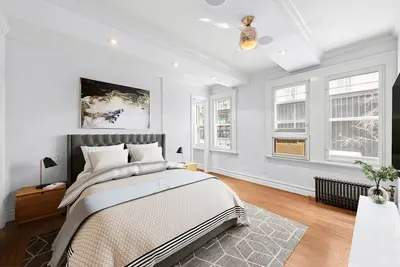
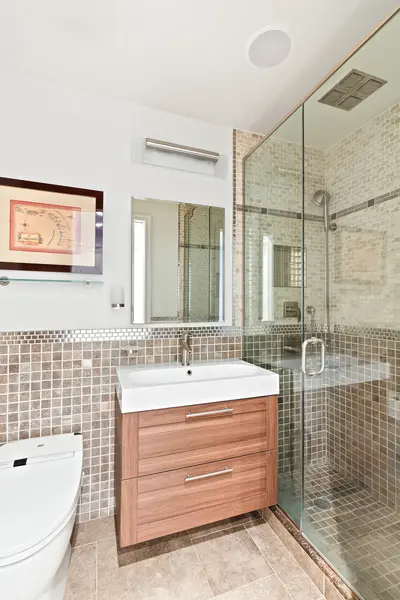
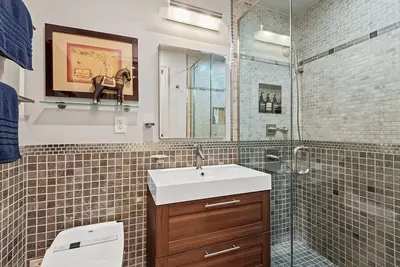
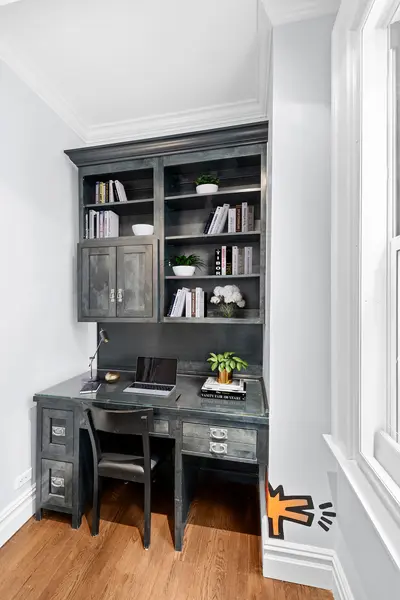
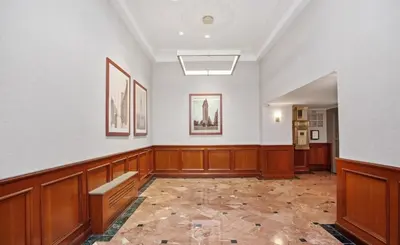
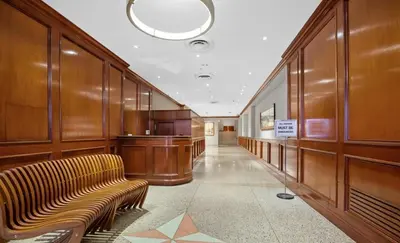
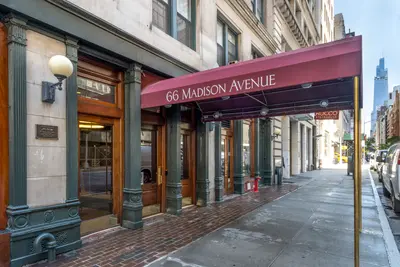
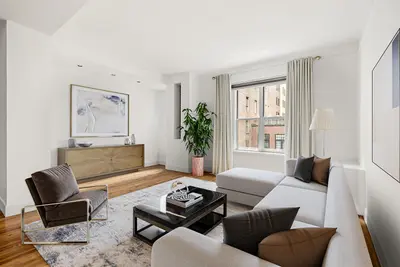
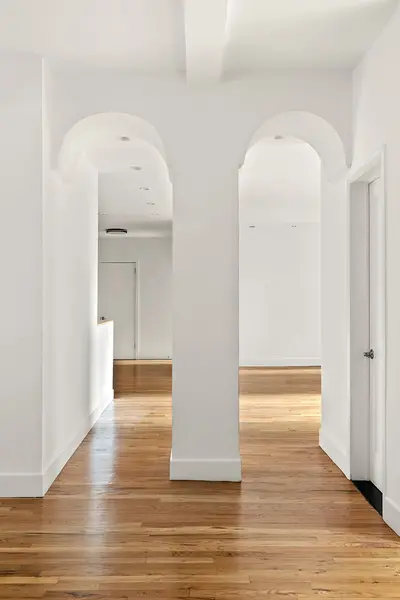
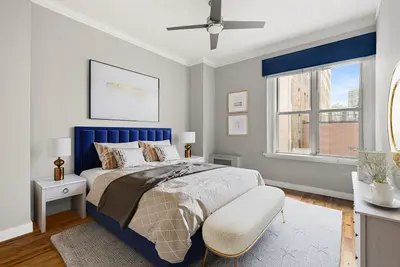
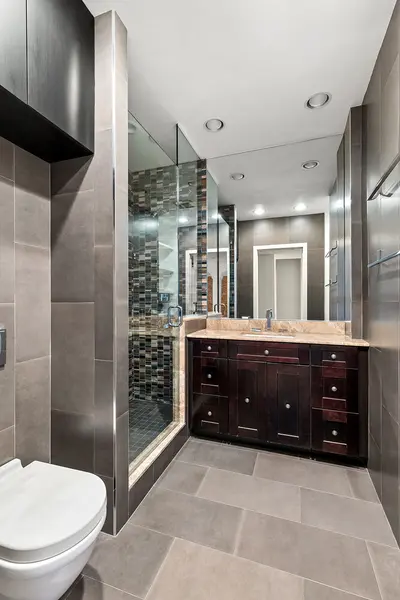
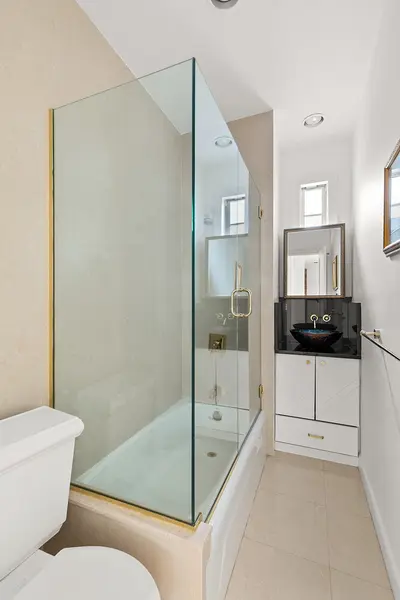
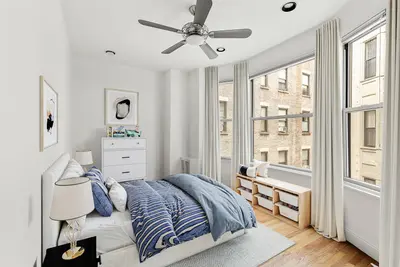
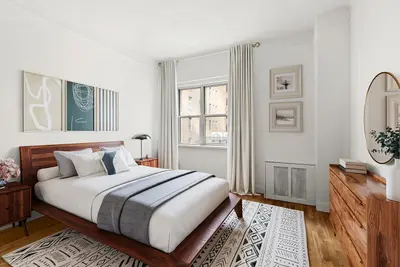
The Madison Parq is a stylish prewar cooperative located at 66 Madison Avenue. The white-glove staff includes 24-hour doormen, live-in superintendent, and full-time porters. There are laundry rooms on every floor, and storage is available for an additional fee.
The Madison Parq's NoMad address is one block north of Madison Square Park and close to popular culinary destinations like Eataly, La Pecorina Bianca, The Smith, Scarpetta, and the original Shake Shack. A Whole Foods outpost is expected to open across the street, and the N, R, and 6 trains are close by. The building allows pets, 80% financing, parents purchasing, co-purchasing, pied-a-terres, and foreign investors. Unlimited subletting is permitted after two years.

View school info, local attractions, transportation options & more.
Experience amazing 3D aerial maps and fly throughs.
For some co-ops, instead of price per square foot, we use an estimate of the number of rooms for each sold apartment to chart price changes over time. This is because many co-op listings do not include square footage information, and this makes it challenging to calculate accurate square-foot averages.
By displaying the price per estimated room count, we are able to provide a more reliable and consistent metric for comparing sales in the building. While we hope that this gives you a clearer sense of price trends in the building, all data should be independently verified. All data provided are only estimates and should not be used to make any purchase or sale decision.
Broker & Buyer Comments