The Rutherford, 230 East 15th Street - Gramercy Park
- Apartments
- Overview & Photos
- Maps
- Floorplans
- Sales Data & Comps
- Similar Buildings
- All Units
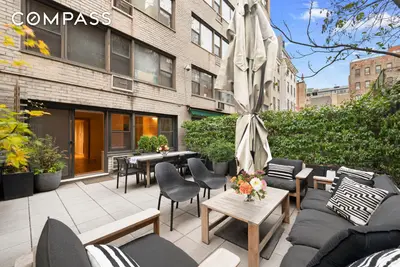
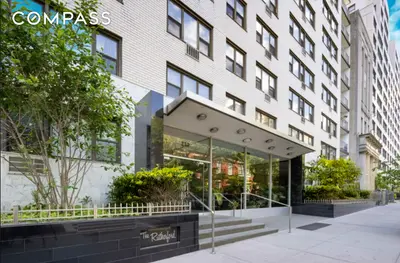
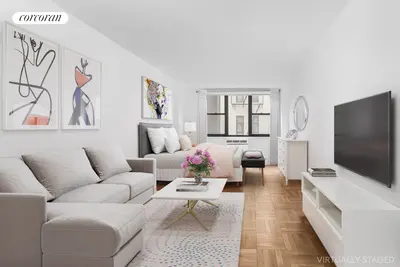
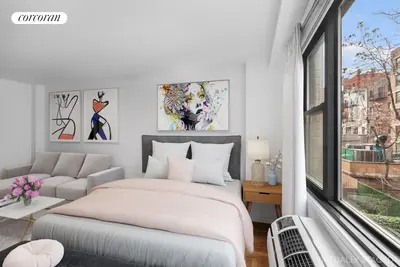
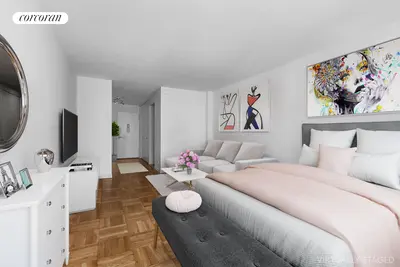
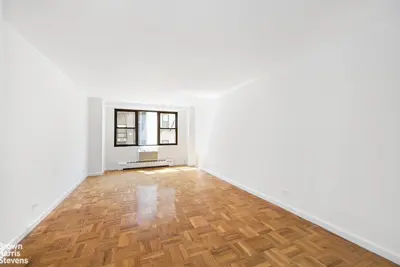
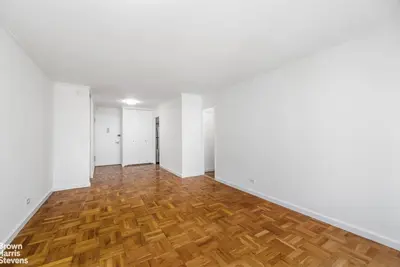
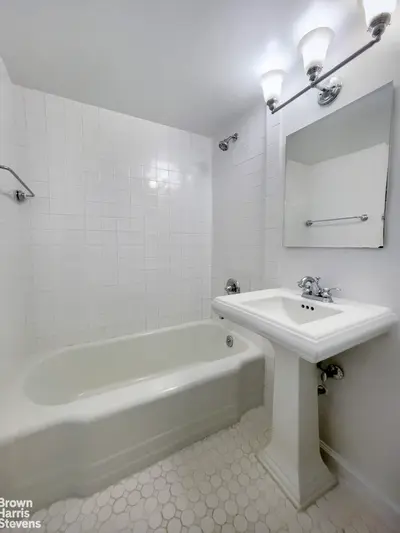
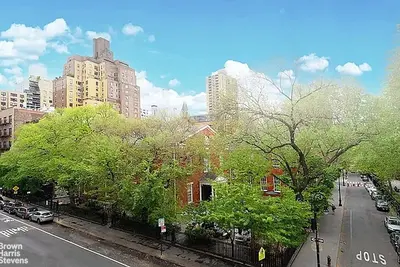
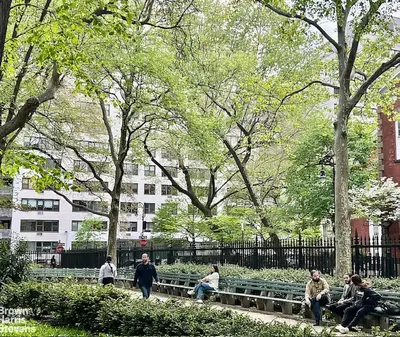

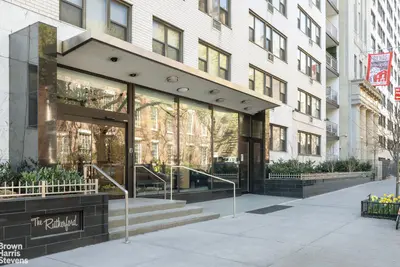
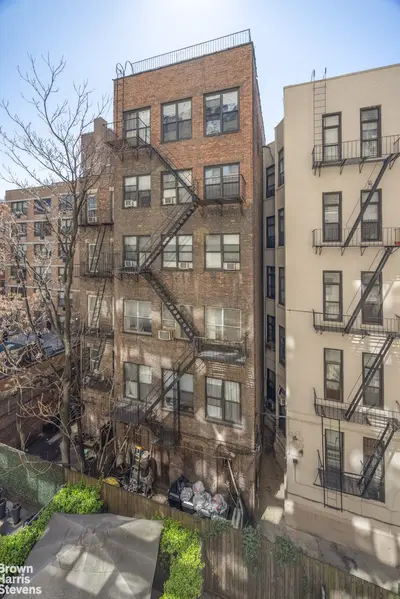
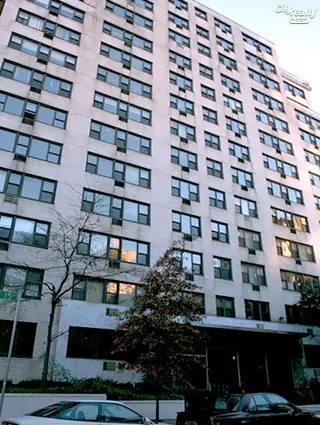
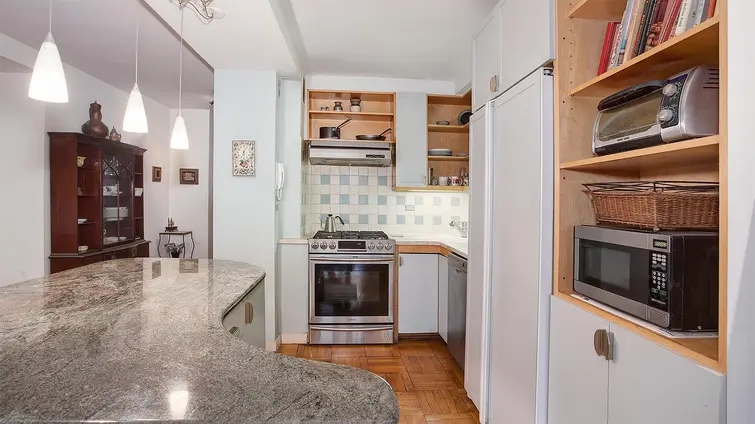
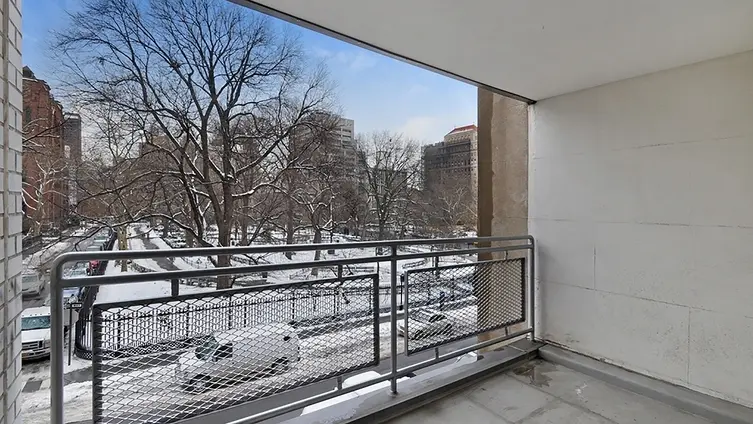
The Rutherford, located at 230 East 15th Street, is a 13-story white-brick cooperative building erected in 1959 and converted to co-op in 1983. The building contains 176 apartments and sits directly across from Stuyvesant Square Park, offering protected views of the park and the Empire State Building from many units. Its distinctive entrance features green marble columns supporting an angled marquee, with a three-step-up entrance and thoughtful sidewalk landscaping.
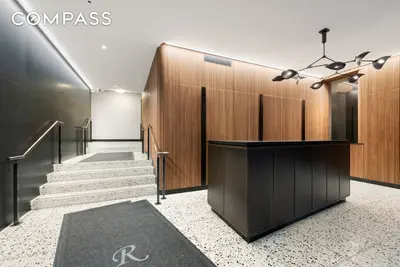
The building's architecture includes balconies at its east and west ends, discrete air-conditioners, and large windows throughout. Notable building amenities include a 24-hour doorman, live-in superintendent, on-site parking garage, bike storage, laundry facilities, and a landscaped roof deck with Wi-Fi and panoramic city views. The lobby and elevators have been recently renovated.
As a co-op, The Rutherford allows pets, co-purchasing, and subletting after two years of ownership (permitted for five out of seven years). A 2% flip tax applies to sales, paid by the seller. The building maintains a well-regarded reputation for its meticulous upkeep and welcoming staff.
Situated in the Gramercy neighborhood, the location offers exceptional access to multiple transportation options, including the 4/5/6, L, and N/Q/R/W subway lines. The area features numerous amenities, including Whole Foods, Trader Joe's, the Union Square Greenmarket, and an array of restaurants and entertainment venues. The building's position across from Stuyvesant Square Park provides residents with immediate access to green space, while remaining close to Union Square's shopping and dining options.

View school info, local attractions, transportation options & more.
Experience amazing 3D aerial maps and fly throughs.
For some co-ops, instead of price per square foot, we use an estimate of the number of rooms for each sold apartment to chart price changes over time. This is because many co-op listings do not include square footage information, and this makes it challenging to calculate accurate square-foot averages.
By displaying the price per estimated room count, we are able to provide a more reliable and consistent metric for comparing sales in the building. While we hope that this gives you a clearer sense of price trends in the building, all data should be independently verified. All data provided are only estimates and should not be used to make any purchase or sale decision.