Shh... Many units sell without being publicly listed.
Interested in off-market listings at The Norville House? Some previously listed residences might be available – contact us for insider details on potential opportunities!
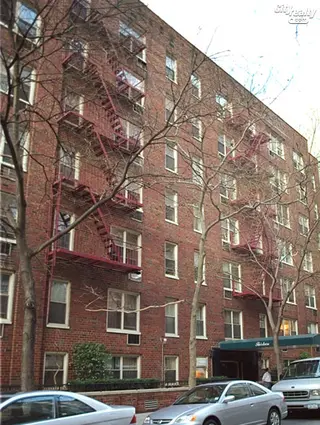
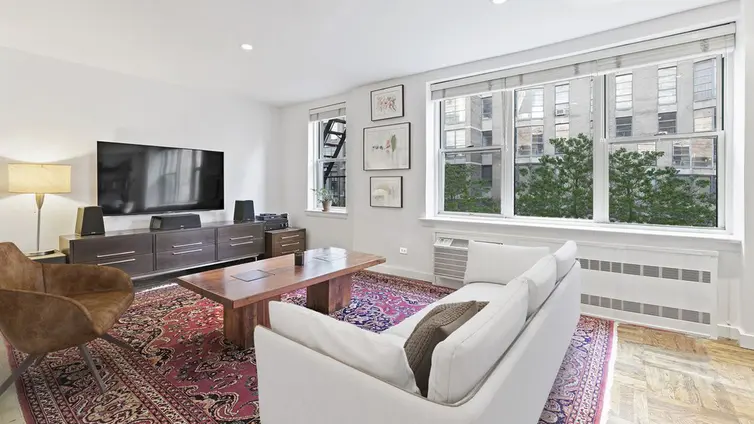
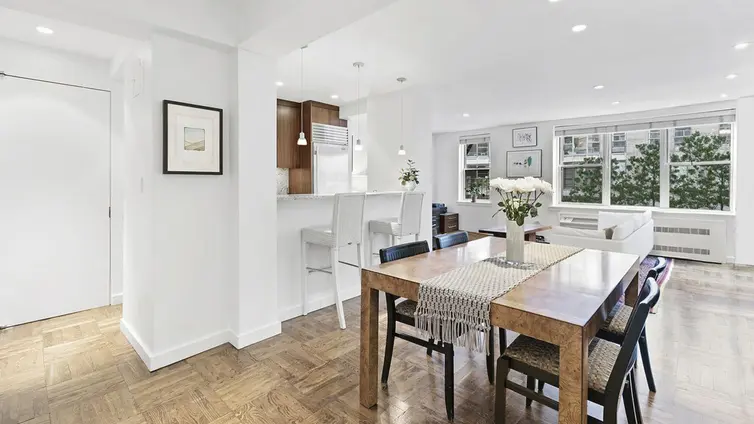
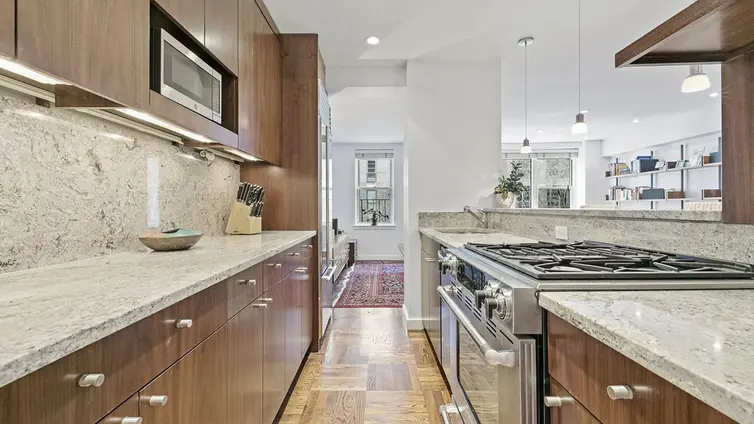
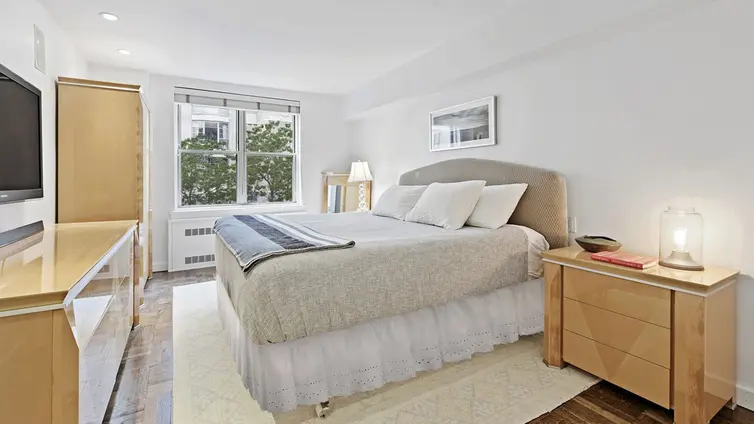
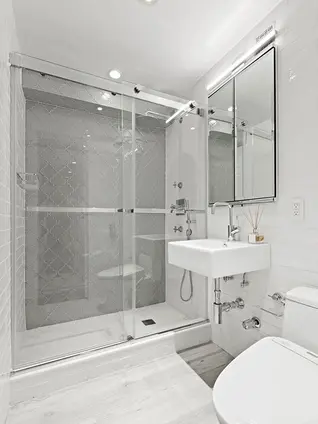
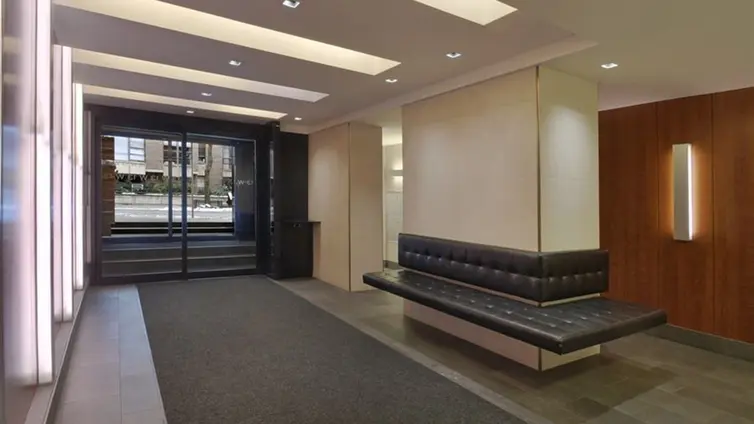
The Norville House is a postwar cooperative finished in 1962 and located at 13 West 13th Street in the heart of Greenwich Village. A part-time doorman and live-in superintendent are on staff, and amenities include a renovated lobby, a private garage, a new central laundry room, and private storage.
The Norville House is close to popular downtown restaurants, gourmet supermarkets, the Union Square Greenmarket, and multiple subway lines. The building is pet-friendly and permits pied-a-terres.
Interested in off-market listings at The Norville House? Some previously listed residences might be available – contact us for insider details on potential opportunities!
View school info, local attractions, transportation options & more.
Experience amazing 3D aerial maps and fly throughs.
For some co-ops, instead of price per square foot, we use an estimate of the number of rooms for each sold apartment to chart price changes over time. This is because many co-op listings do not include square footage information, and this makes it challenging to calculate accurate square-foot averages.
By displaying the price per estimated room count, we are able to provide a more reliable and consistent metric for comparing sales in the building. While we hope that this gives you a clearer sense of price trends in the building, all data should be independently verified. All data provided are only estimates and should not be used to make any purchase or sale decision.
Year
Avg Price / Ft2 (Est)
Median Price / Ft2 (Est)
Avg. Actual Price
Med. Actual Price
Transactions
2025
-
-
-
-
0
2024
$1,094
$692,333
$1,094
$555,000
3
2023
$1,261
$1,325,000
$1,261
$1,200,000
3
2022
$967
$662,500
$967
$682,500
3
2021
$1,121
$1,069,583
$1,063
$1,132,500
6
2020
$1,135
$951,250
$1,074
$935,000
4
2019
$1,074
$846,688
$1,067
$834,875
4
2018
$1,079
$804,667
$1,034
$720,000
9
2017
$1,213
$1,254,400
$1,171
$1,360,000
5
2016
$966
$785,375
$1,038
$793,250
4
2015
$1,058
$894,067
$1,063
$815,000
5
2014
$1,132
$851,710
$1,153
$780,130
6
|
Year
Avg Price / Ft2 (Est)
Median Price / Ft2 (Est)
Avg. Actual Price
Med. Actual Price
Transactions
2013
$1,083
$752,250
$1,083
$662,500
4
2012
$896
$684,800
$889
$740,000
5
2011
$890
$802,875
$857
$718,625
6
2010
$813
$660,000
$812
$660,000
3
2009
$804
$562,667
$804
$548,000
3
2008
$913
$561,667
$913
$617,000
3
2007
$939
$765,040
$936
$780,000
10
2006
$887
$727,833
$894
$613,500
6
2005
$797
$567,650
$780
$600,000
10
2004
$683
$425,754
$636
$445,278
7
2003
$473
$299,583
$473
$275,000
6
Please note that price/ft2 calculations is from only 63% of total transactions during the period
|
Sign-up and we'll email you new listings in this building!
Whether you’re a buyer, investor, or simply curious, this report is your key to unlocking in-depth insights and analysis on .
Please confirm your details: