43 East 10th Street - Greenwich Village
- Apartments
- Overview & Photos
- Maps
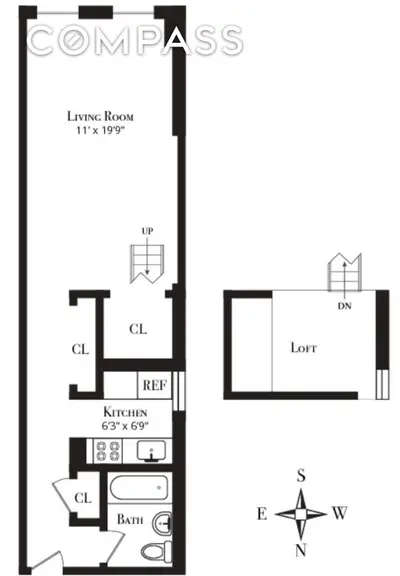
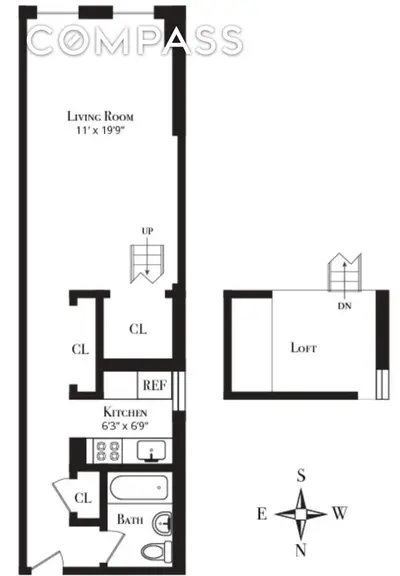
- Floorplans
- Sales Data & Comps
- Similar Buildings
- All Units
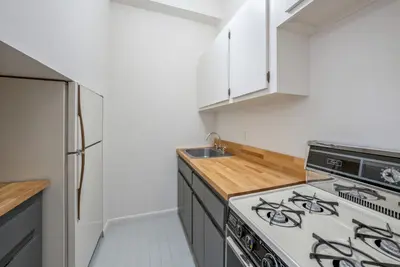
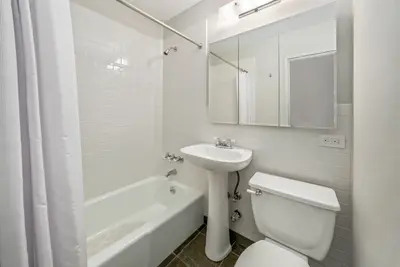

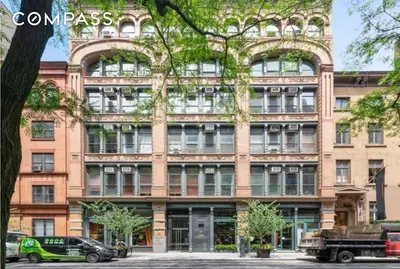
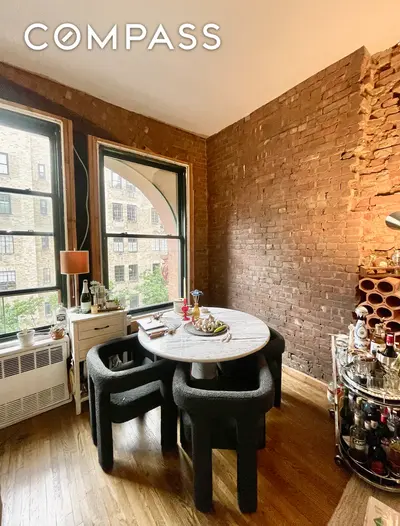

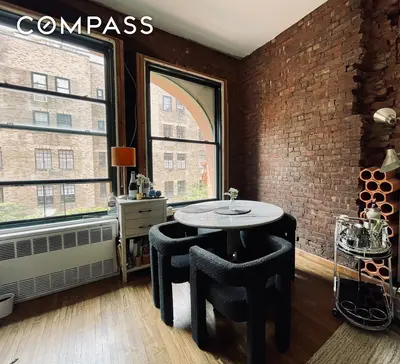
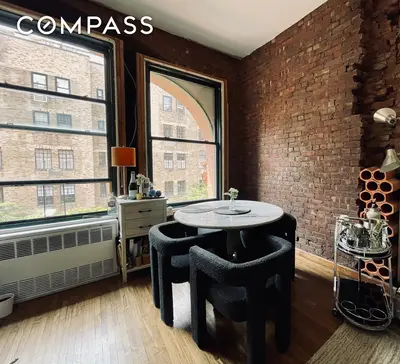

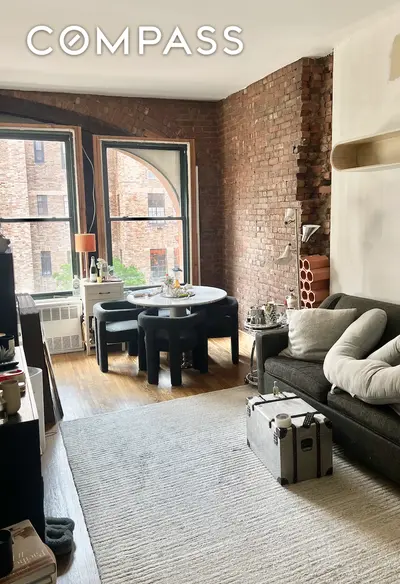

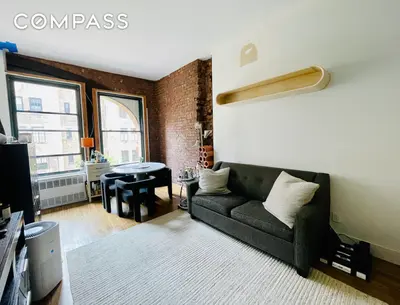


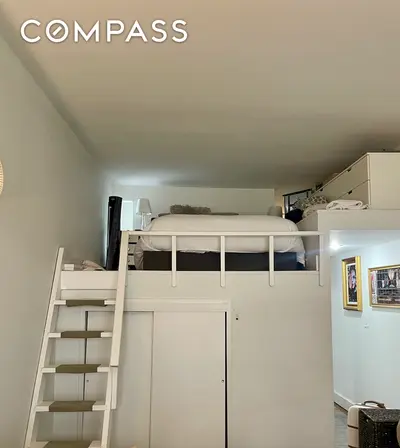


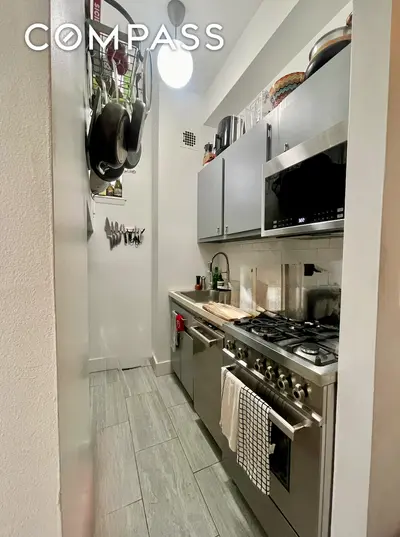

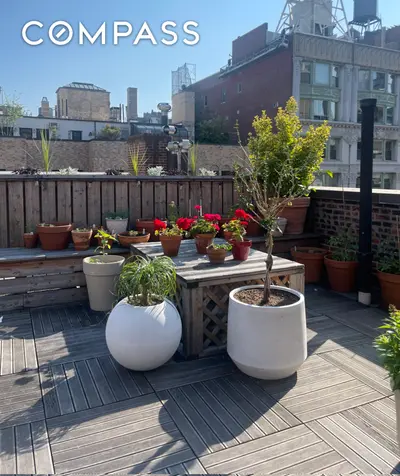


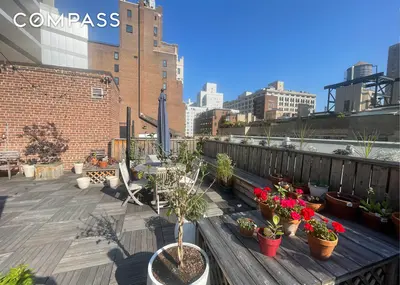

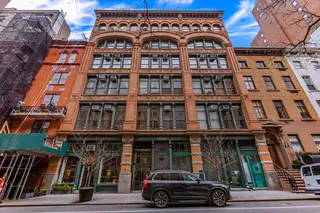
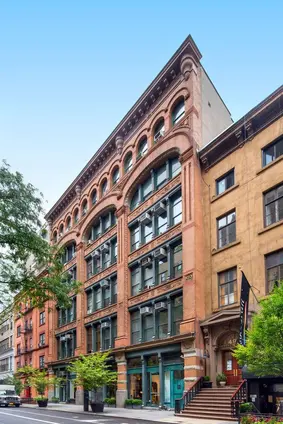
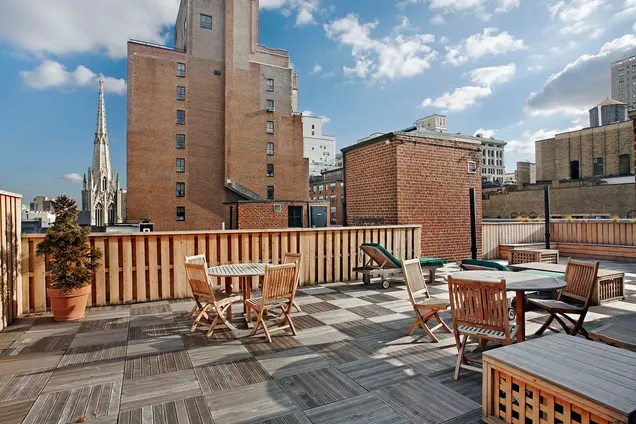
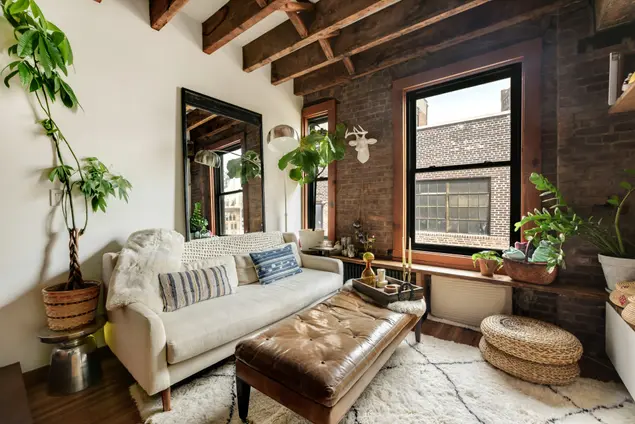
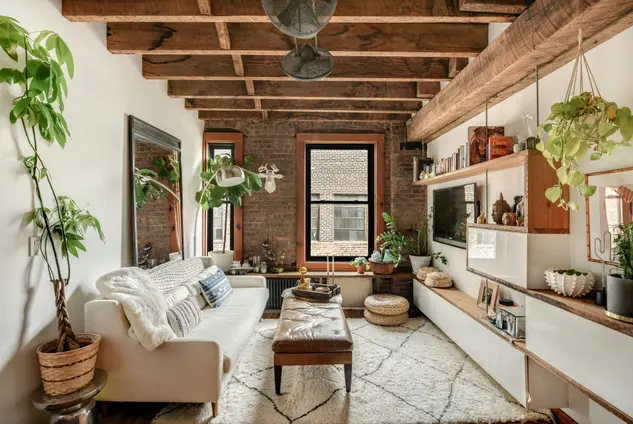
43 East 10th Street is a cast iron building originally built in 1904 and converted to a cooperative in 1982. Amenities include an elegantly renovated lobby, live-in super, video intercom, laundry room, and beautiful roof deck overlooking the Lower Manhattan skyline.
The building is tucked away on a quiet ‘Gold Coast' central Village street with easy access to the West Village, East Village, NoHo, Irving Place, Washington Square Park, Madison Square Park, and Union Square - in the midst of New York City's best restaurants and retail. Nearby transportation includes the N/R/W/4/5/6 and Path trains.

View school info, local attractions, transportation options & more.
Experience amazing 3D aerial maps and fly throughs.
For some co-ops, instead of price per square foot, we use an estimate of the number of rooms for each sold apartment to chart price changes over time. This is because many co-op listings do not include square footage information, and this makes it challenging to calculate accurate square-foot averages.
By displaying the price per estimated room count, we are able to provide a more reliable and consistent metric for comparing sales in the building. While we hope that this gives you a clearer sense of price trends in the building, all data should be independently verified. All data provided are only estimates and should not be used to make any purchase or sale decision.