Shh... Many units sell without being publicly listed.
Limited off-market opportunities might be available at 135 Ocean Parkway – ideal for those looking to explore listings not currently on the market. Contact us to learn more.
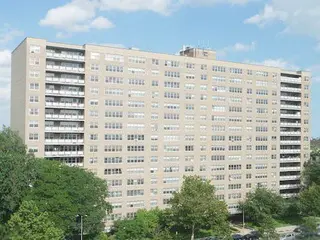
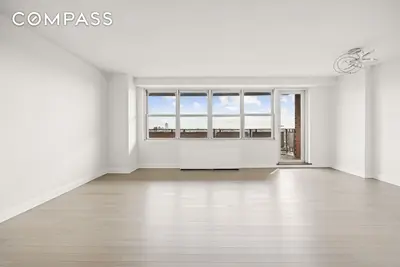
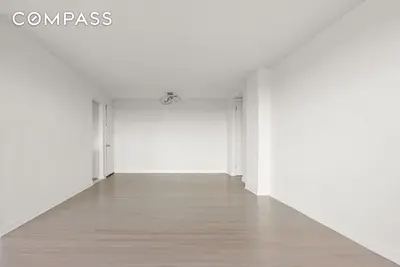
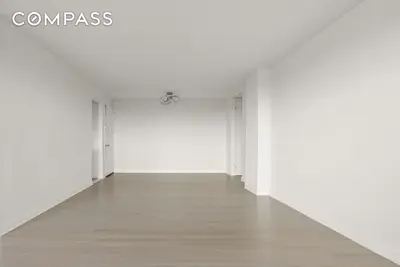
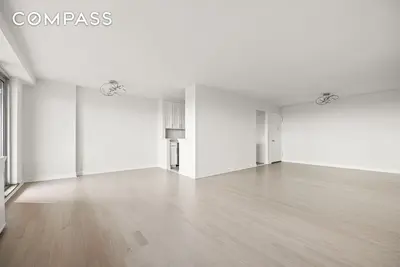
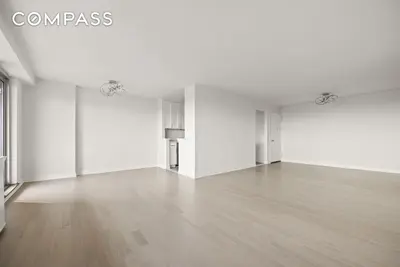
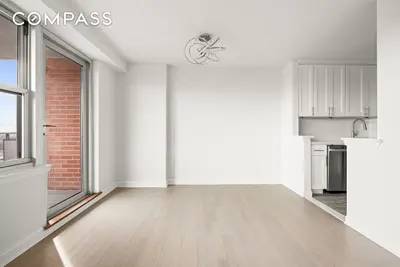
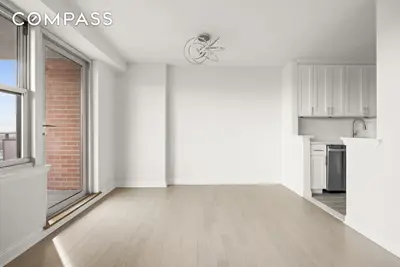
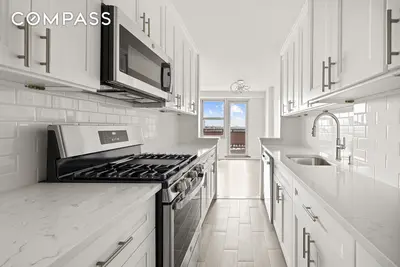
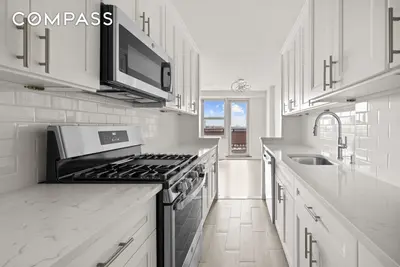
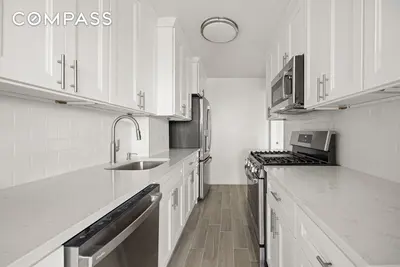
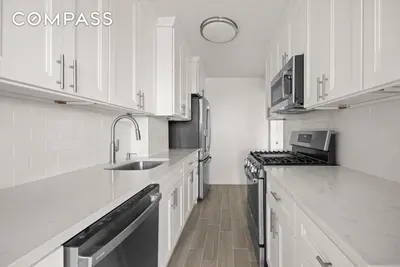
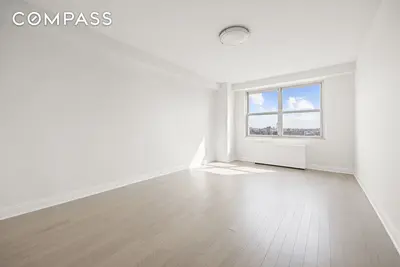
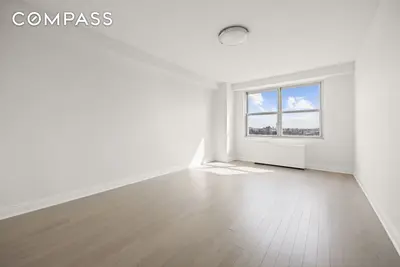
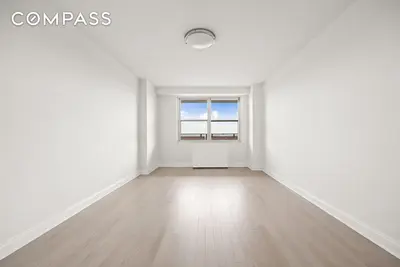
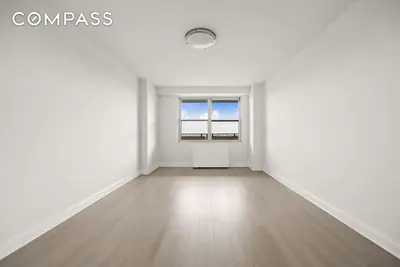
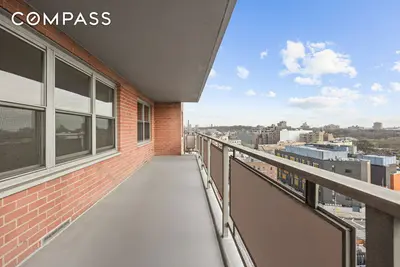
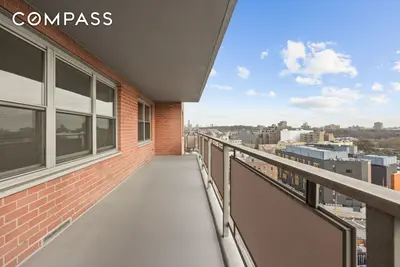
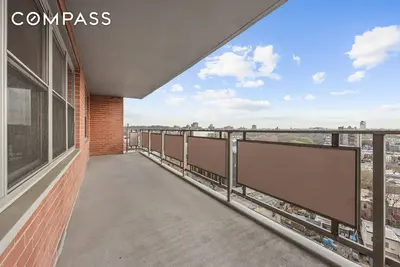
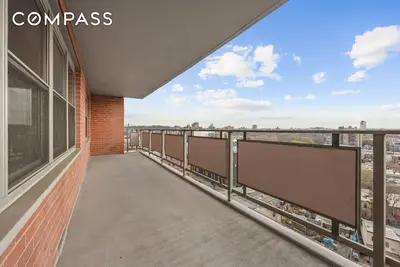


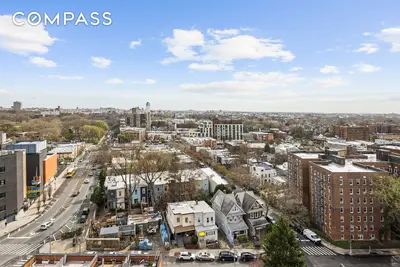
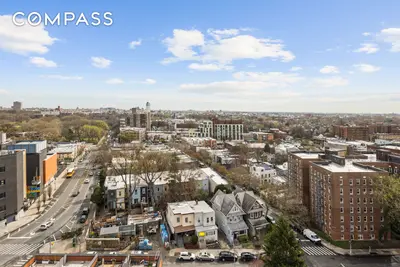
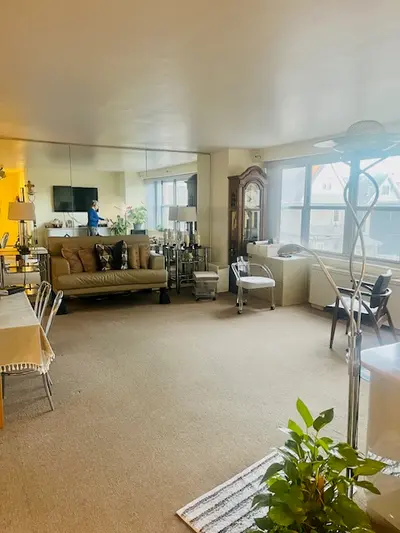
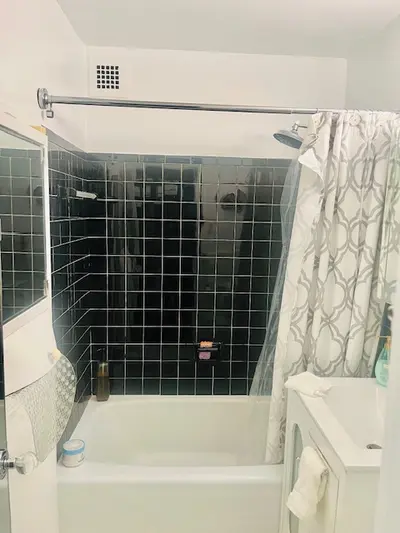
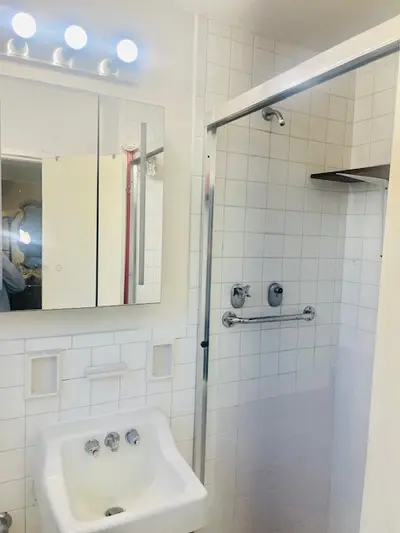
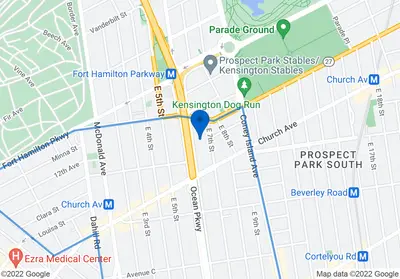

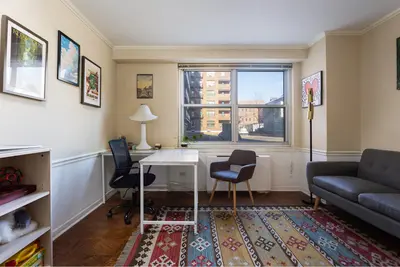
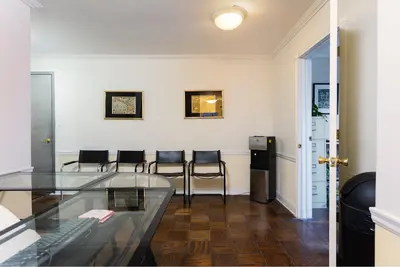
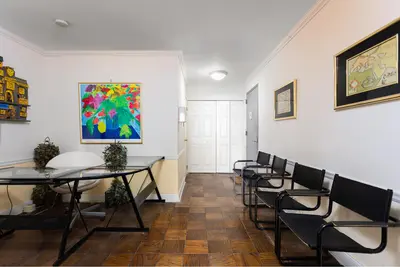
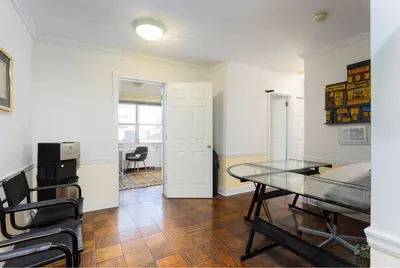
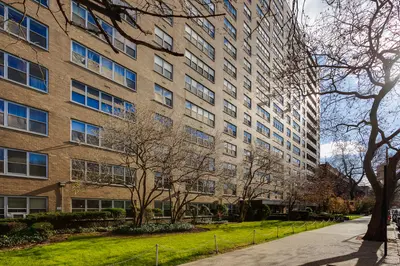
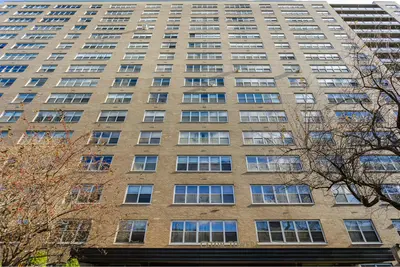
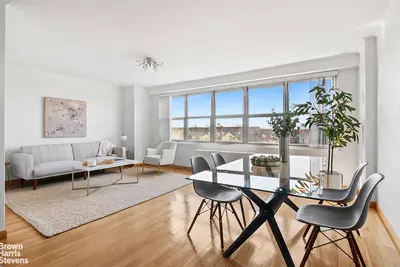

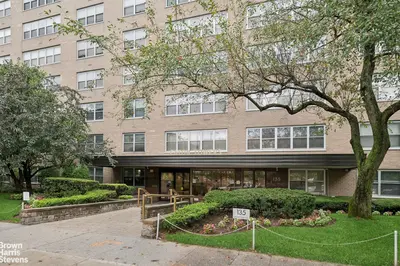


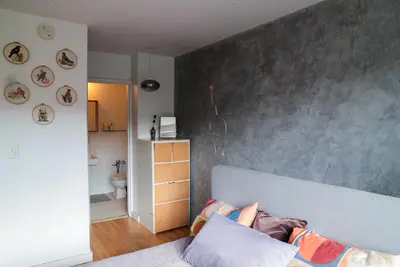
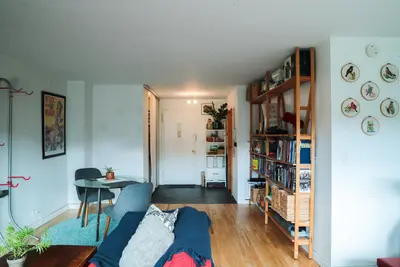
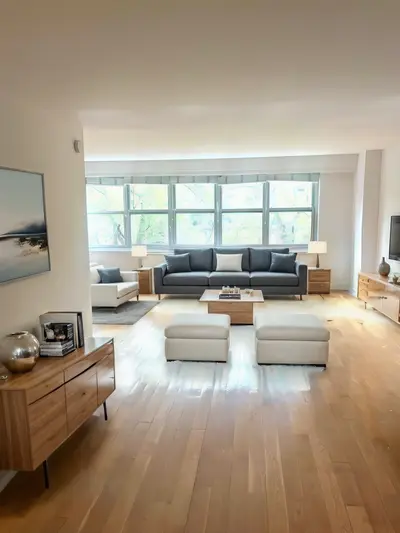
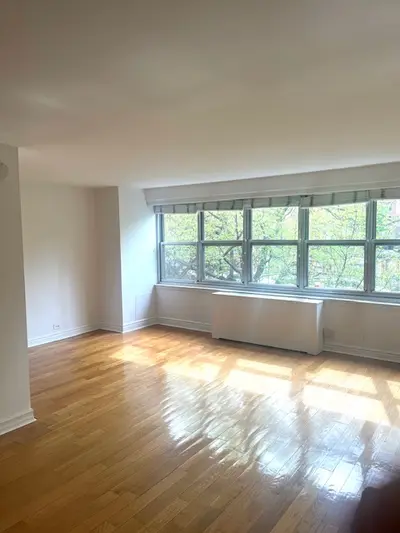
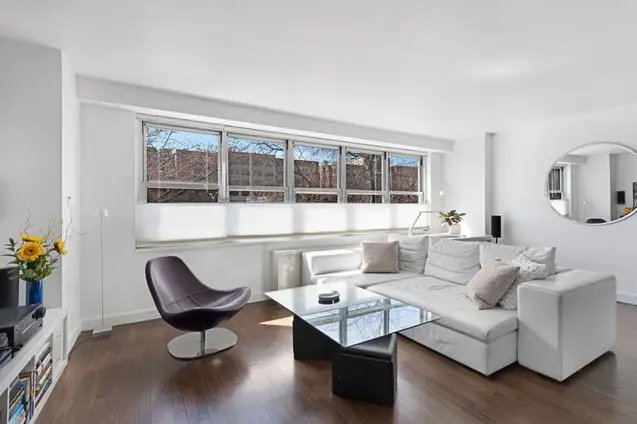
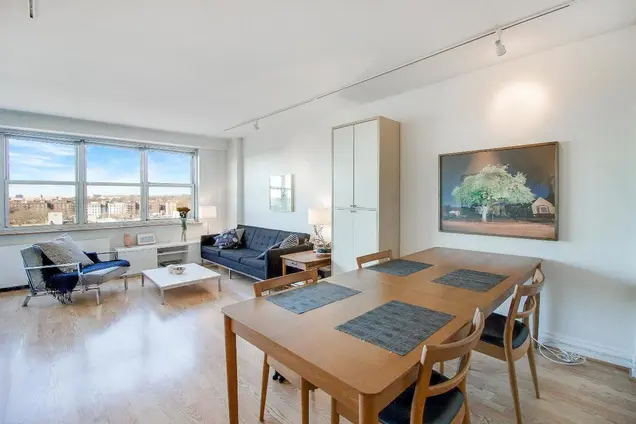
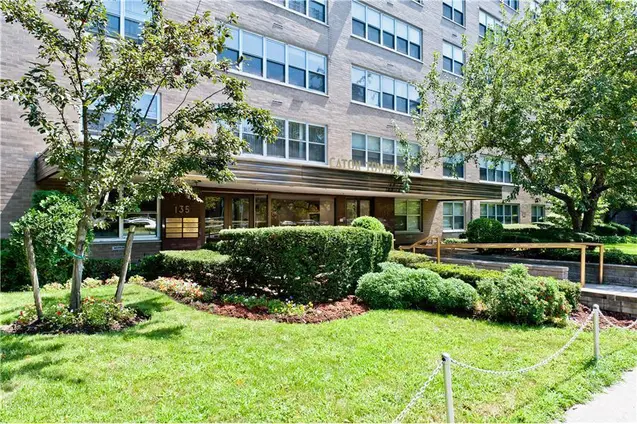
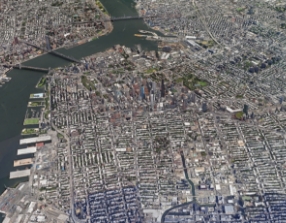
Caton Towers, built in 1965 at 135 Ocean Parkway, is a 16-story post-war co-op building containing 274 units on the border of Kensington and Windsor Terrace. As the tallest building in the area, it stands as one of the neighborhood's most sought-after full-service residences.
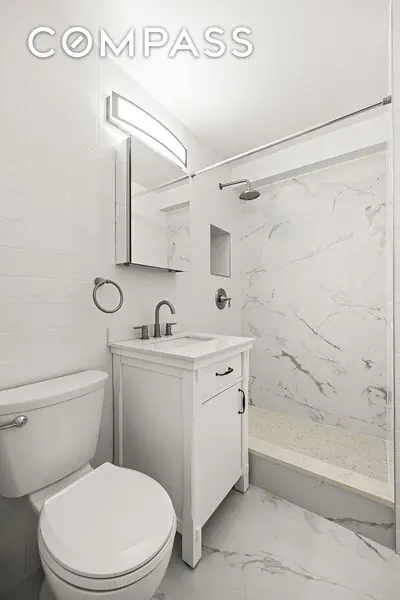
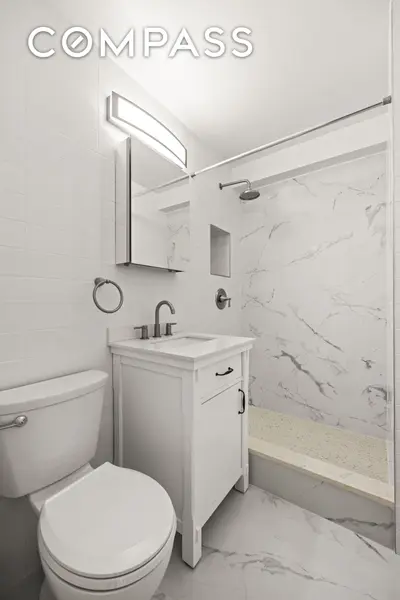
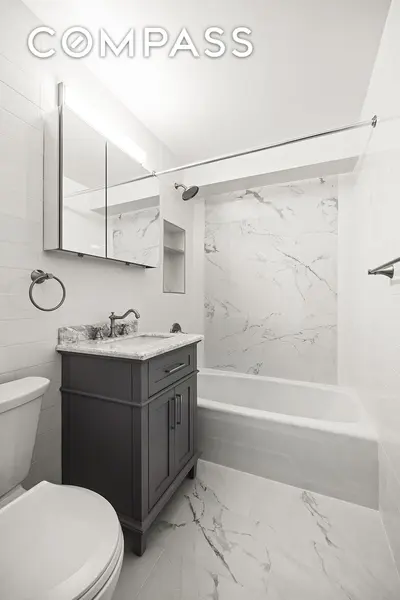
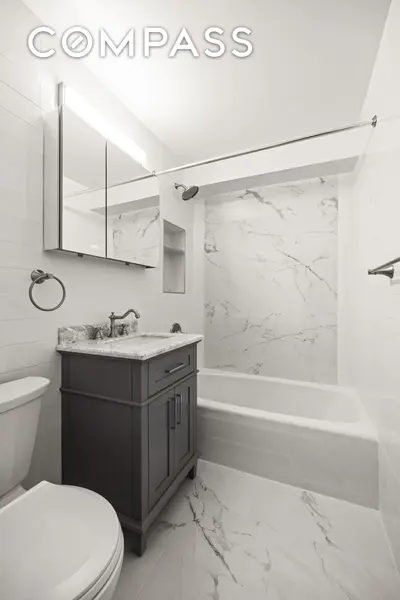
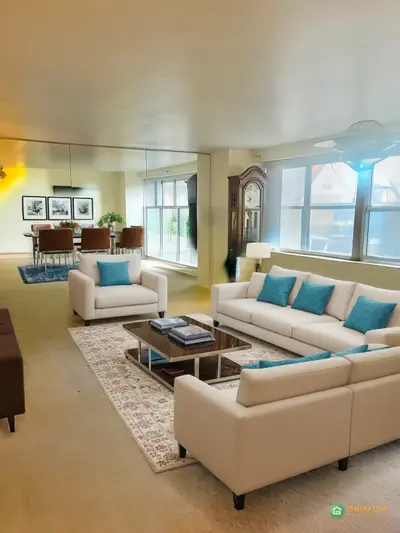
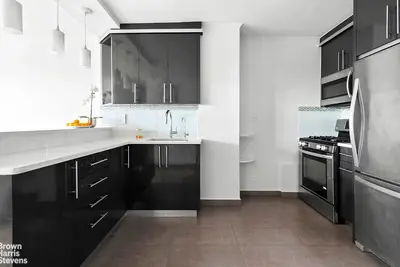
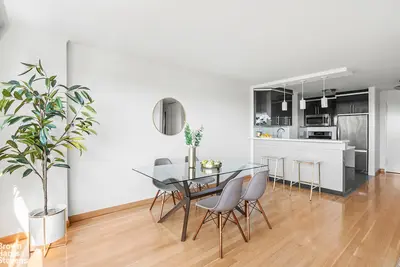
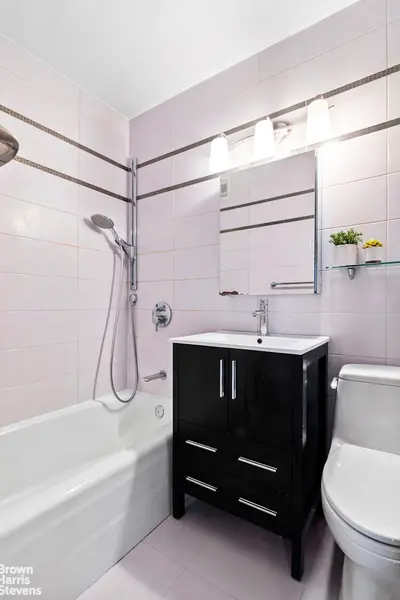
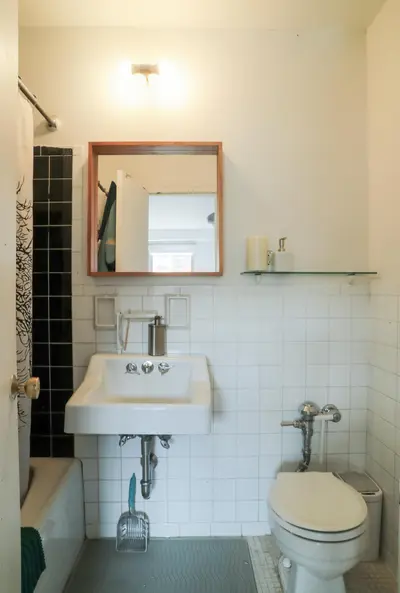
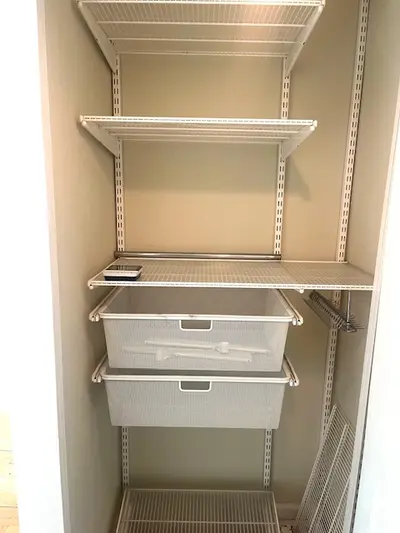
The building offers comprehensive amenities including 24-hour doorman service, a live-in superintendent, porters, and video security throughout. Residents have access to a laundry facility, bike storage, and both storage units and parking spaces (though both currently have waiting lists). The building maintains strong financials with healthy reserves and boasts over 90% owner occupancy.
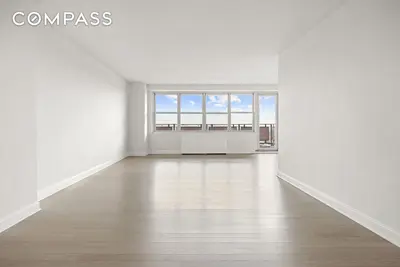
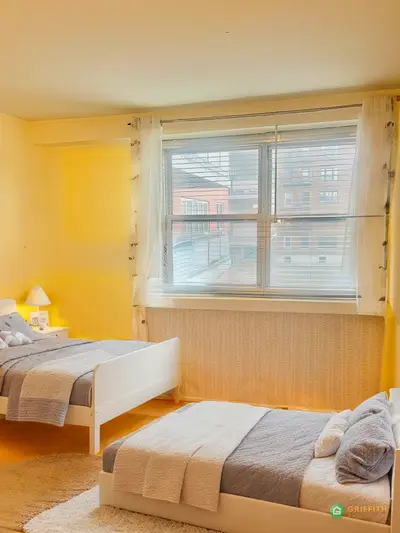
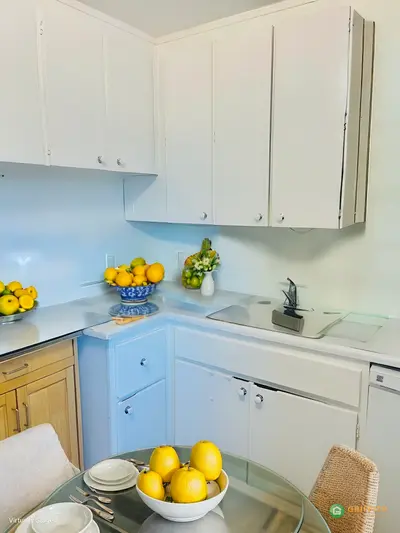
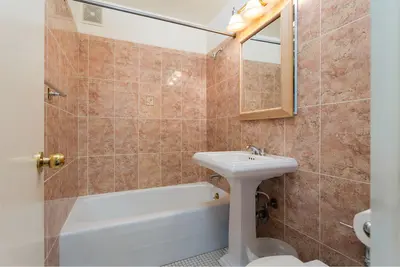
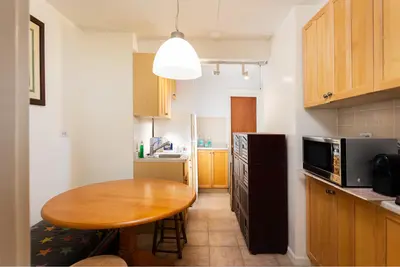
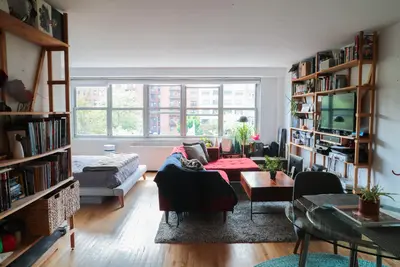
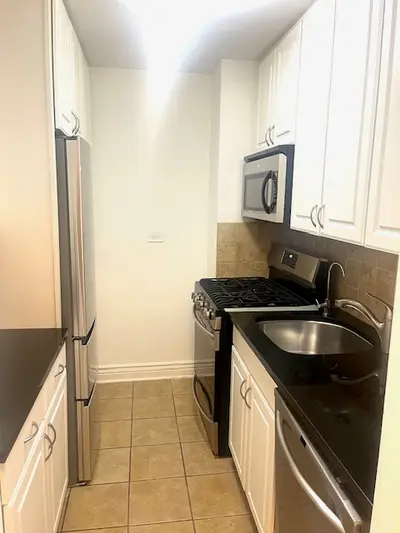
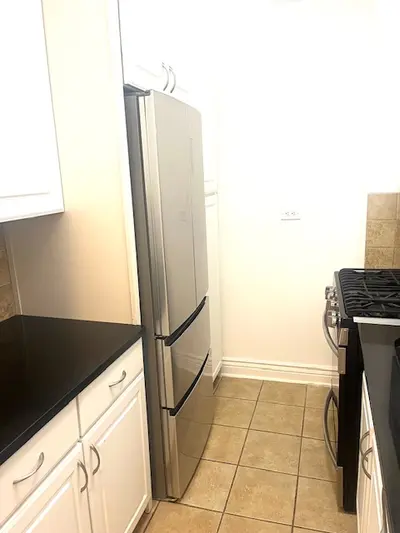
Units in the building feature central air and heating, which are included in the maintenance along with water and gas. The pet policy allows cats, while dogs are accepted on a ratio basis with a current waitlist. The co-op has demonstrated ongoing commitment to maintenance, with recent renovations to common areas and hallways.
The location offers excellent accessibility, situated near the F/G subway lines and express bus service to Manhattan. The property's position provides easy access to Prospect Park, the historic Ocean Parkway bike path, and numerous local dining establishments and shops in both Kensington and Windsor Terrace neighborhoods.
Limited off-market opportunities might be available at 135 Ocean Parkway – ideal for those looking to explore listings not currently on the market. Contact us to learn more.
View school info, local attractions, transportation options & more.
Experience amazing 3D aerial maps and fly throughs.
For some co-ops, instead of price per square foot, we use an estimate of the number of rooms for each sold apartment to chart price changes over time. This is because many co-op listings do not include square footage information, and this makes it challenging to calculate accurate square-foot averages.
By displaying the price per estimated room count, we are able to provide a more reliable and consistent metric for comparing sales in the building. While we hope that this gives you a clearer sense of price trends in the building, all data should be independently verified. All data provided are only estimates and should not be used to make any purchase or sale decision.
|
Year
Avg Price / Room (Est)
Avg. Actual Price
Med. Actual Price
Transactions
2025
$144,333
$396,500
2
2024
$138,558
$458,667
9
2023
$145,926
$482,444
9
2022
$171,125
$626,350
10
2021
$171,583
$531,833
12
2020
$143,875
$441,250
8
2019
$147,771
$571,000
9
2018
$139,113
$582,445
7
2017
$161,318
$545,926
12
2016
$150,607
$439,077
13
2015
$126,294
$456,111
9
2014
$69,722
$318,366
9
|
Year
Avg Price / Room (Est)
Avg. Actual Price
Med. Actual Price
Transactions
2013
$87,393
$278,344
16
2012
$82,212
$312,897
11
2011
$82,658
$271,014
14
2010
$80,448
$301,577
13
2009
$83,510
$289,366
8
2008
$80,896
$246,879
16
2007
$76,053
$237,857
29
2006
$68,984
$312,846
27
2005
$64,979
$237,295
43
2004
$31,129
$102,119
21
2003
$32,906
$98,879
14
|
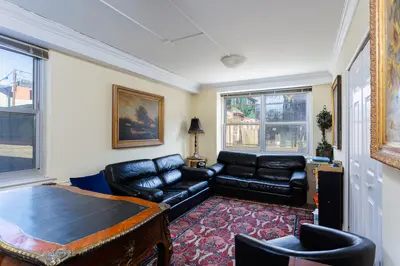
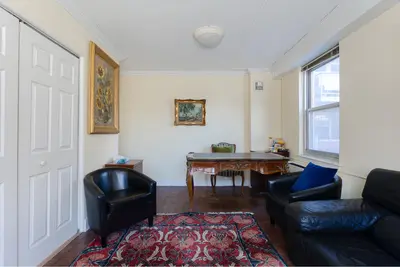
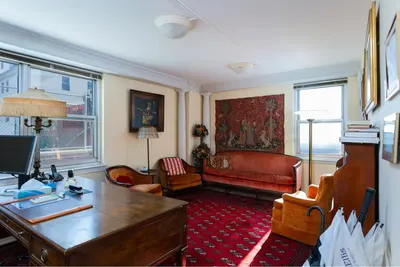
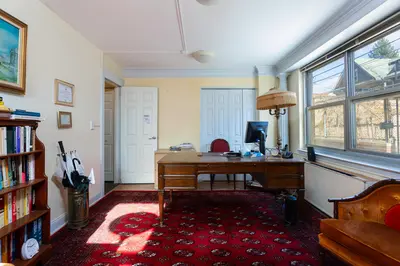
the following is a slider of images. For screen reader users, all slides are visible at all time so you may ignore control buttons.
Sign-up and we'll email you new listings in this building!
Whether you’re a buyer, investor, or simply curious, this report is your key to unlocking in-depth insights and analysis on .
Please confirm your details: