
200 East 57th Street - Midtown East
- Apartments
- Overview & Photos
- Maps
- Floorplans
- Sales Data & Comps
- Similar Buildings
- All Units


200 East 57th Street is a 19-story white brick cooperative built in 1961 on the southeast corner of Third Avenue. Designed by Hyman Isaac Feldman, whose other Manhattan projects include the Park Lane Tower at 185 East 85th Street and 1025 Fifth Avenue, the building contains 199 apartments with setbacks beginning at the 14th floor, some featuring distinctive angled corner windows. For many years, the building's large corner retail space housed elegant establishments such as Maurice Villency furniture and Schumacher fabrics, reflecting the neighborhood's design-focused character.
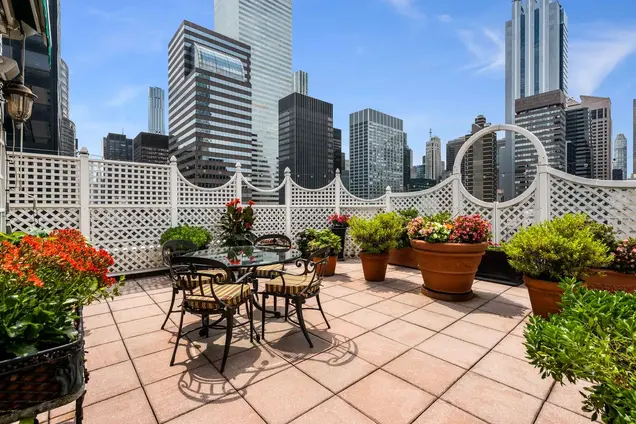
The building occupies a prime Midtown location convenient to Bloomingdale's, Whole Foods, Central Park, and major subway lines including the 4/5/6, N/Q/R, and E/M trains. Amenities include a 24 hour doorman and concierge, live-in resident manager, recently renovated lobby and hallways, landscaped roof deck with skyline views, fitness center, lushly landscaped rear courtyard garden, bike storage, laundry facilities, private storage (waitlist), and an elevator accessible parking garage with discounted rates for shareholders. Monthly maintenance includes all utilities, basic cable, and high speed internet.
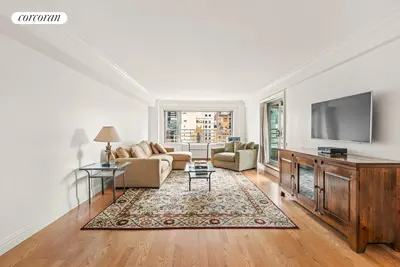
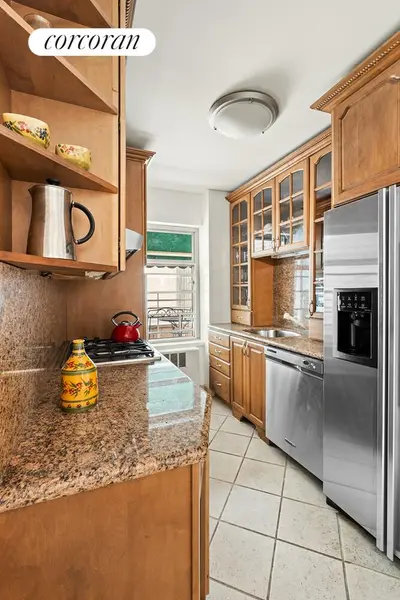
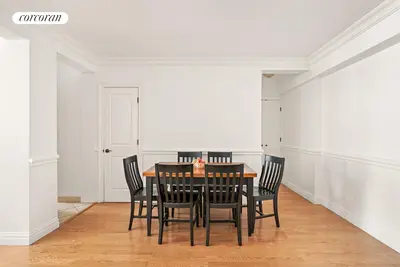
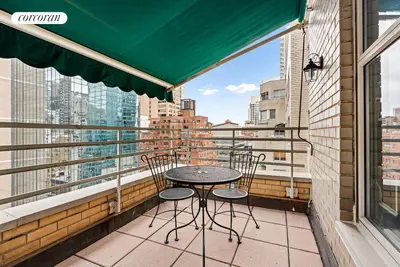
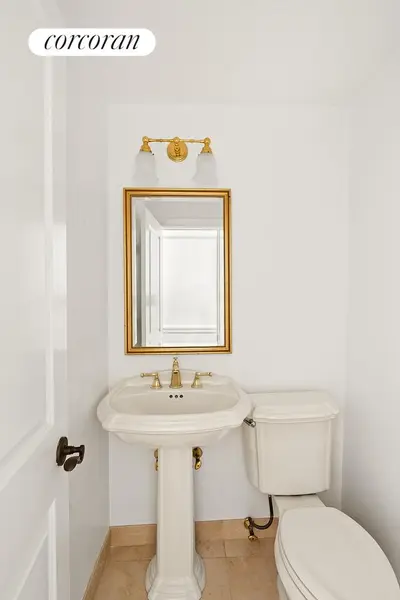
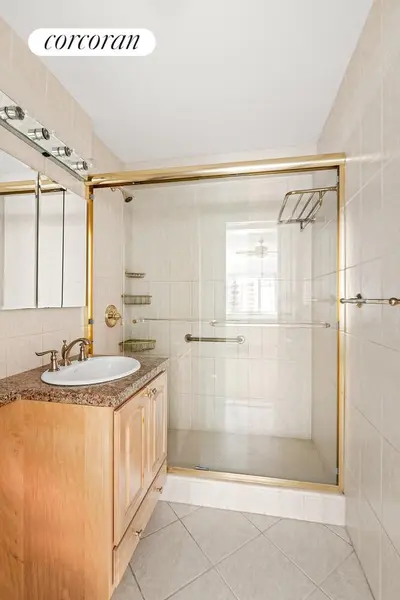
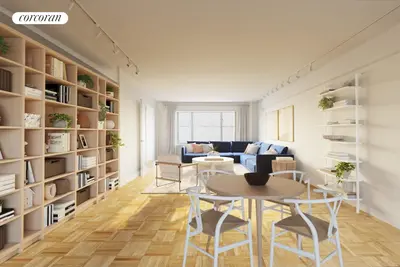
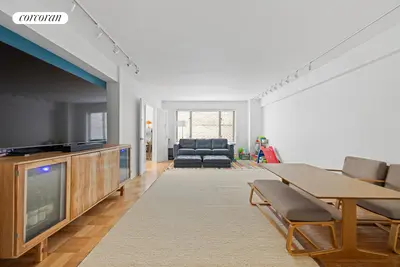
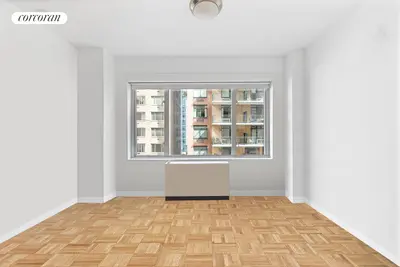
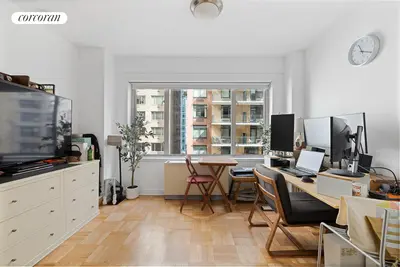
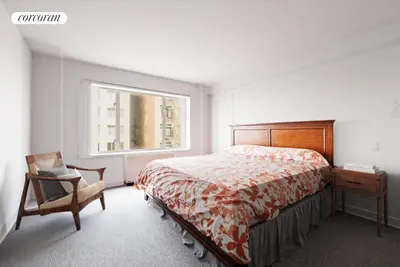
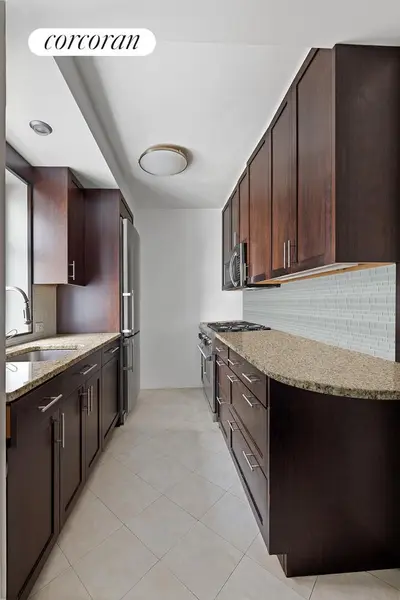
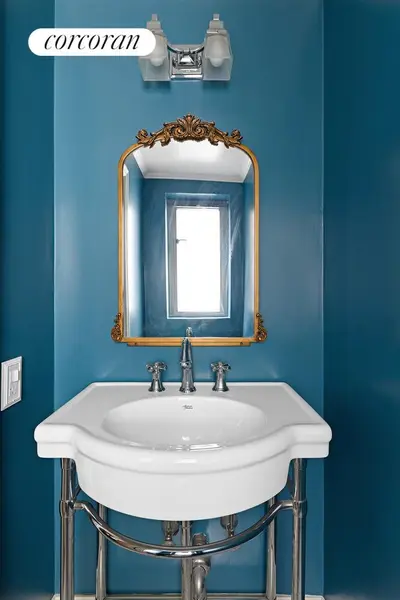
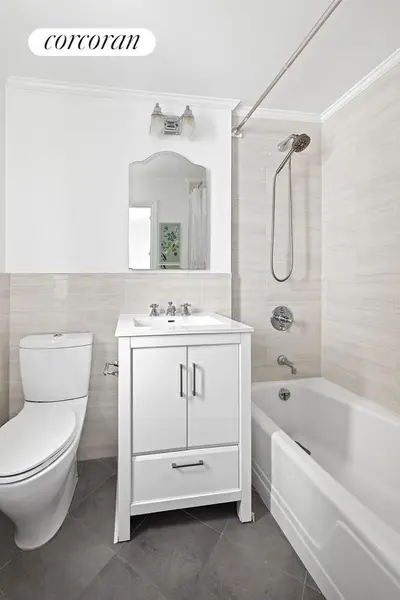
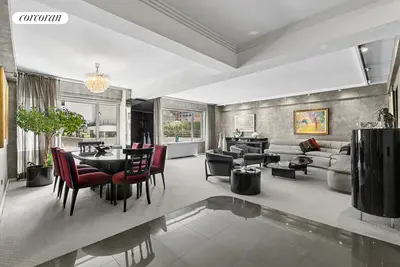
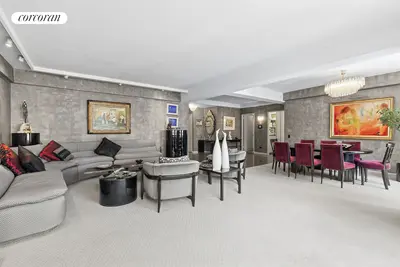
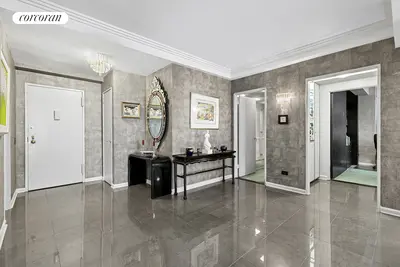
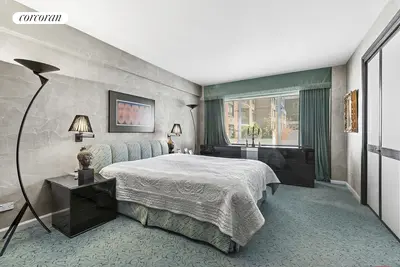
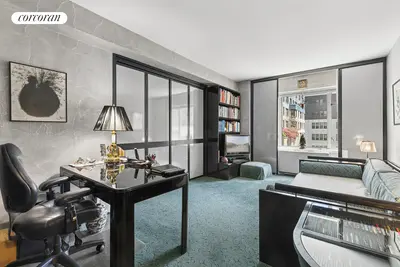
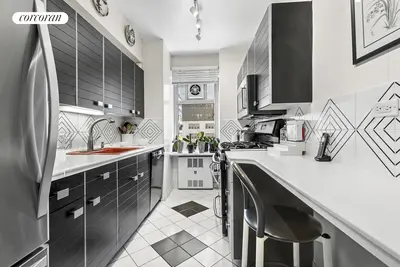
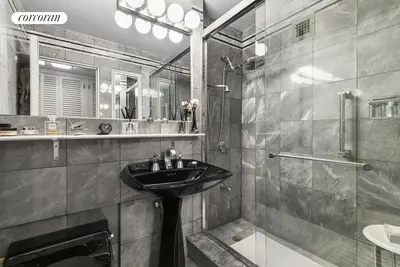
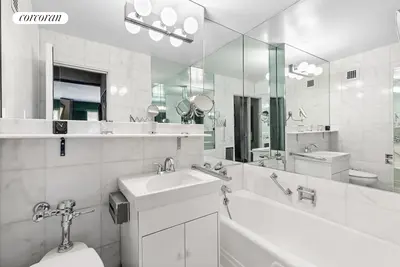
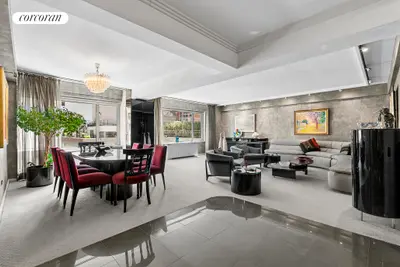
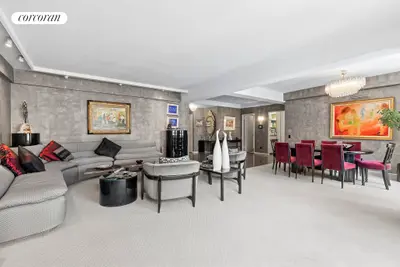
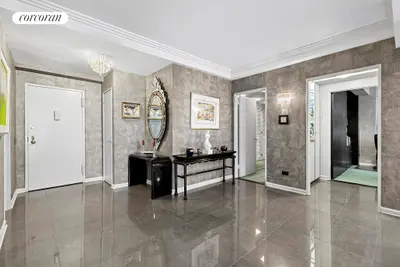
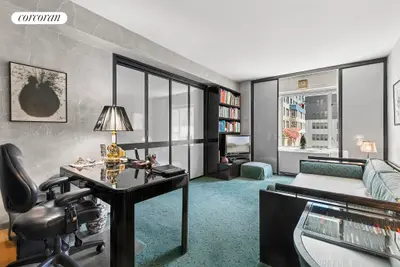
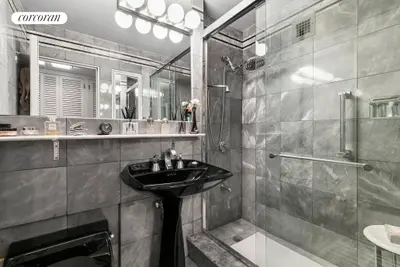
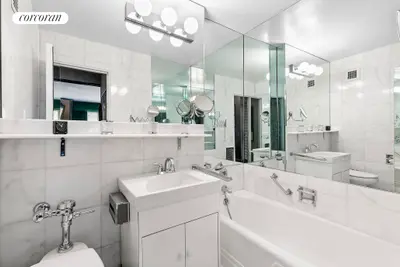
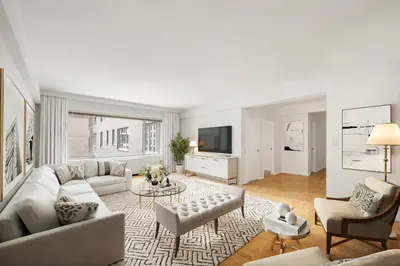
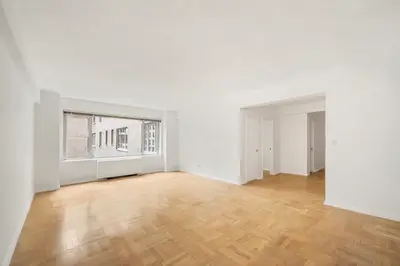
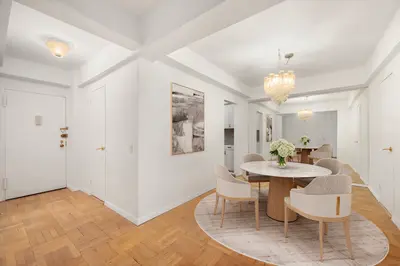
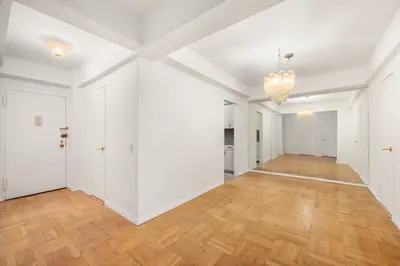
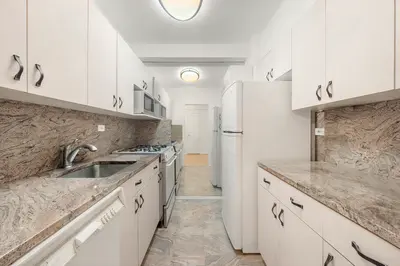
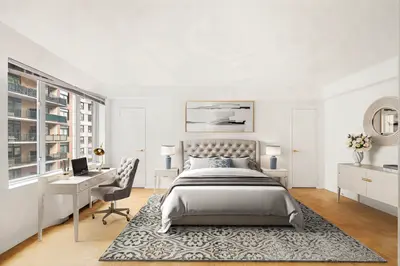
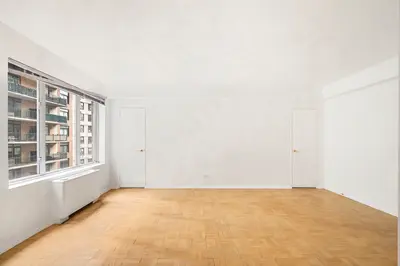
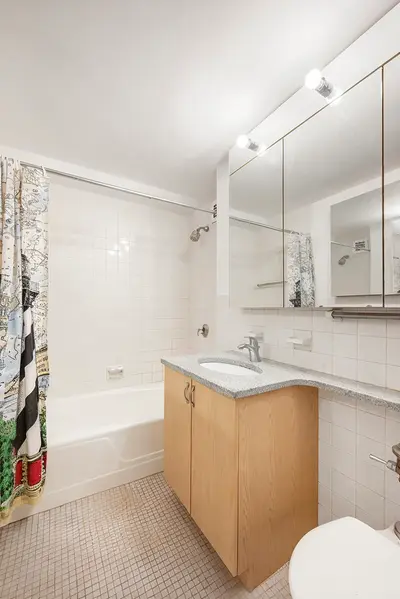
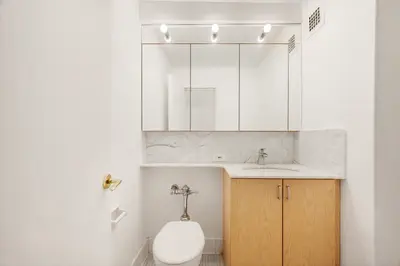
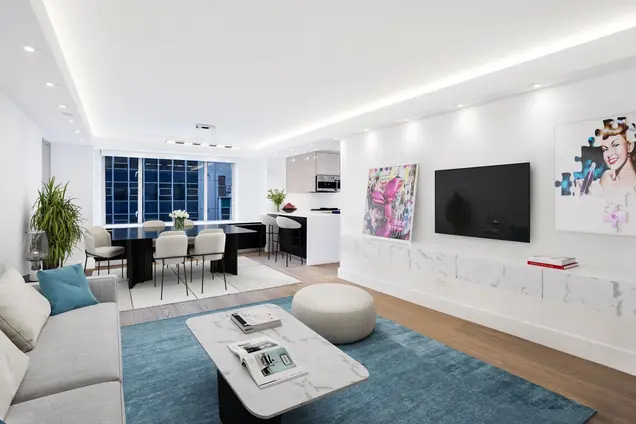
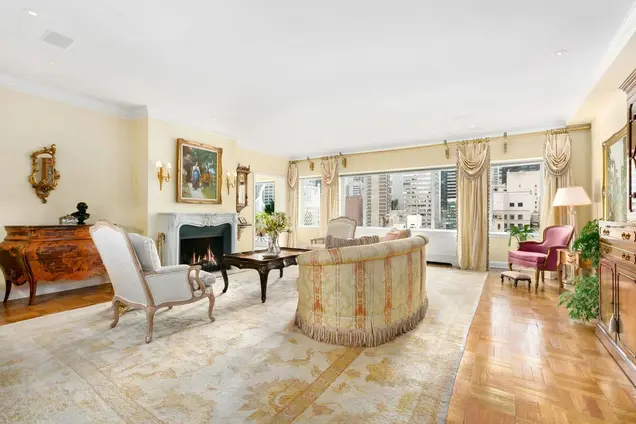
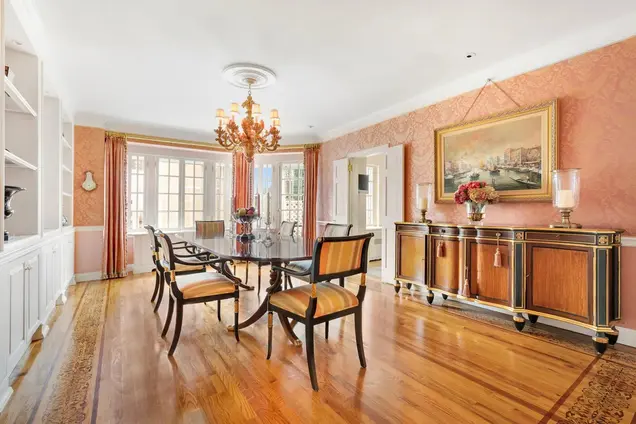
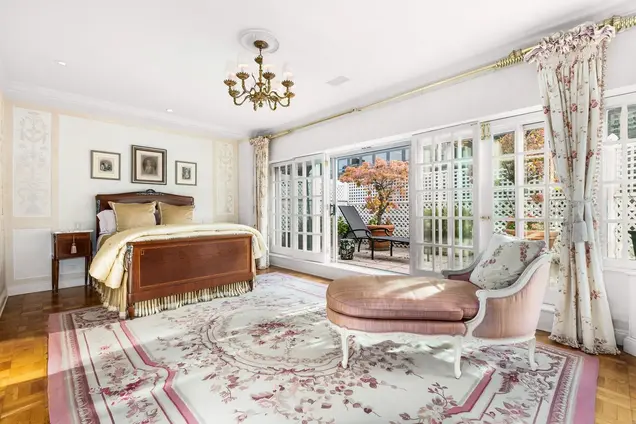
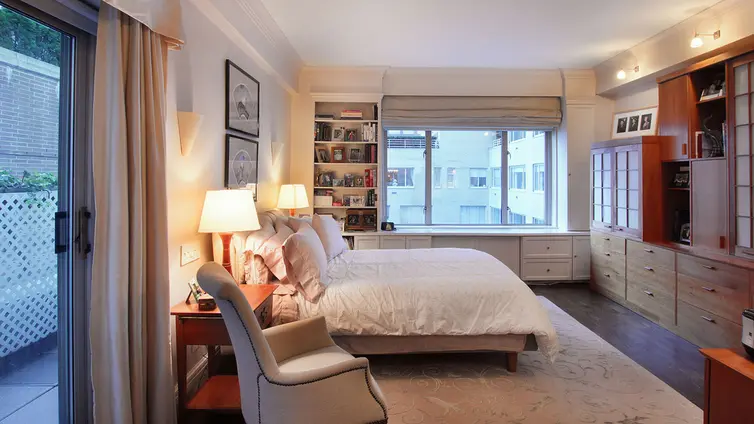
Apartments feature spacious, gracious layouts characteristic of the era, with long entrance galleries (ranging from 13 to 27 feet), oversized living rooms (typically 22 to 30 feet), and separate dining rooms or alcoves. Most units have windowed kitchens, many enclosed, and generous closet space including walk-in closets in larger units. Recent renovations showcase high end finishes including crown molding, custom cabinetry, marble bathrooms with Waterworks fixtures, and top tier appliances from Sub-Zero, Thermador, Bosch, and Wolf. Penthouse and upper floor setback units offer private terraces, while many apartments overlook the building's landscaped courtyard. Some units feature soaring 10 foot ceilings, and in-unit washer/dryers are permitted with board approval.
The co-op permits pets (one per apartment), pied-à-terre ownership, guarantors, gifting, trusts, and LLCs with board approval. Financing up to 65% is allowed, and there is a 2% flip tax paid by the purchaser (or seller, depending on the transaction). The building is smoke free and offers white glove service with professional, attentive staff. The location provides easy access to world class shopping on Fifth Avenue, acclaimed restaurants, the theater district, the East River Esplanade, and the FDR Drive for commuters.

View school info, local attractions, transportation options & more.
Experience amazing 3D aerial maps and fly throughs.
For some co-ops, instead of price per square foot, we use an estimate of the number of rooms for each sold apartment to chart price changes over time. This is because many co-op listings do not include square footage information, and this makes it challenging to calculate accurate square-foot averages.
By displaying the price per estimated room count, we are able to provide a more reliable and consistent metric for comparing sales in the building. While we hope that this gives you a clearer sense of price trends in the building, all data should be independently verified. All data provided are only estimates and should not be used to make any purchase or sale decision.
Broker & Buyer Comments