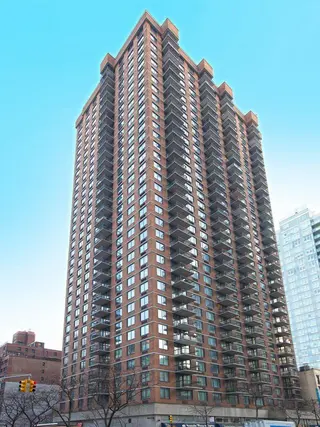
Connaught Tower, 300 East 54th Street - Midtown East
- Apartments
- Overview & Photos
- Maps
- Floorplans
- Sales Data & Comps
- Similar Buildings
- All Units


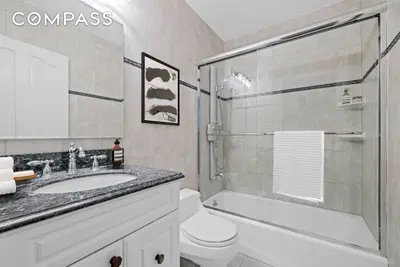
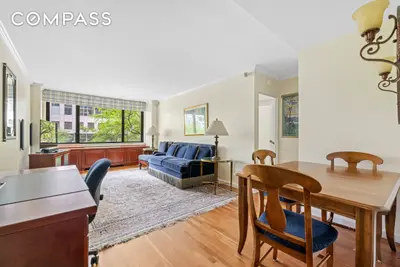
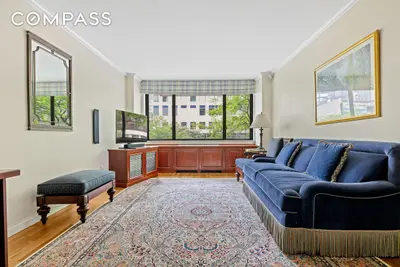
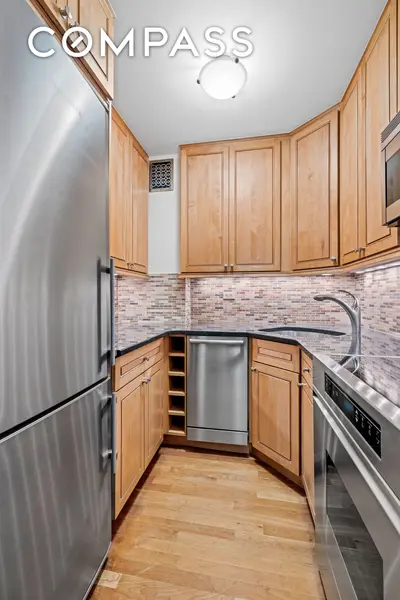


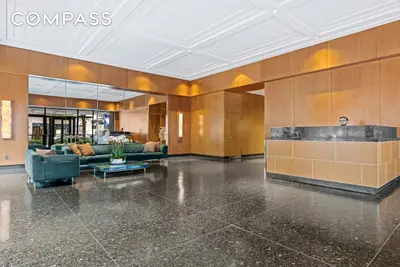
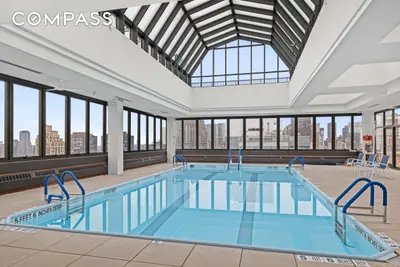
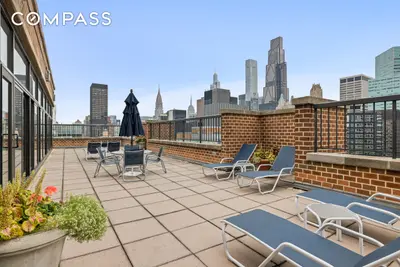

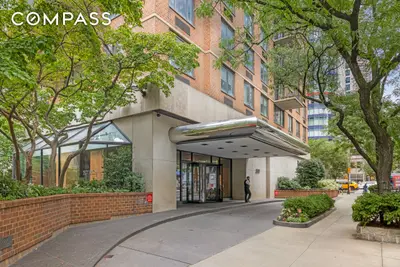


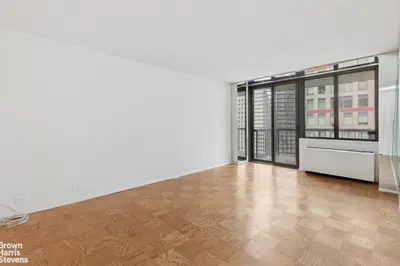

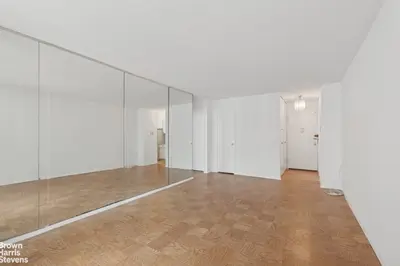
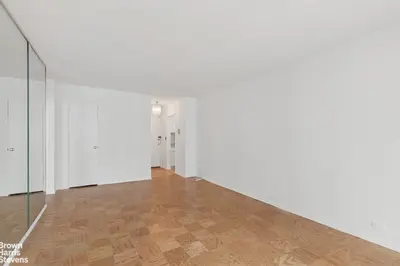

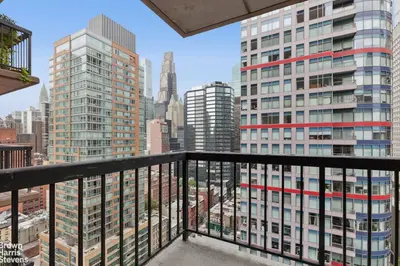
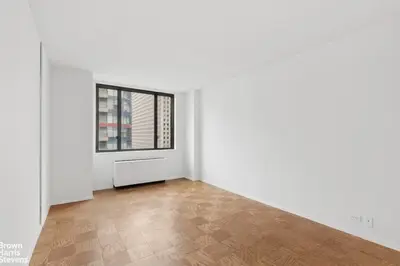
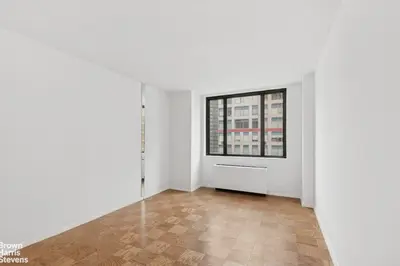
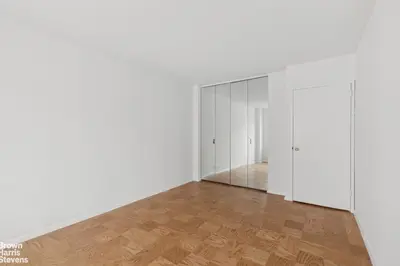

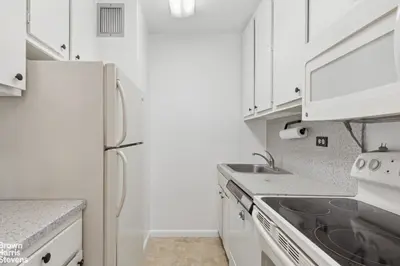

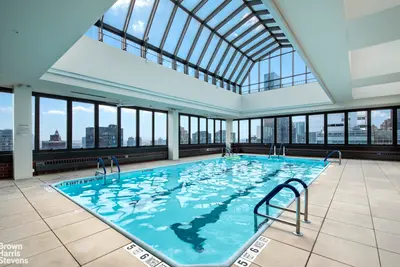
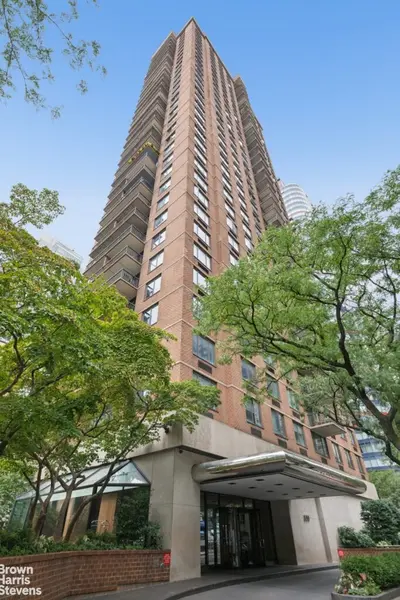


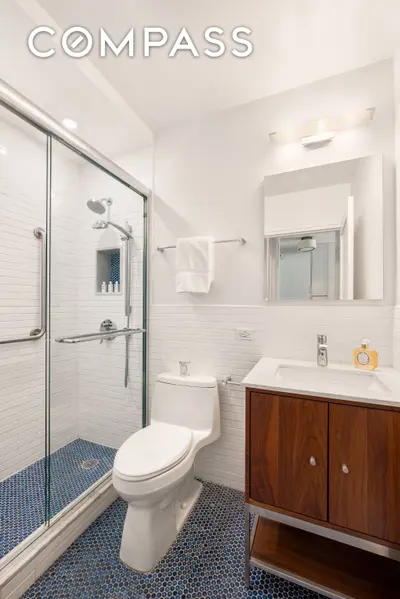

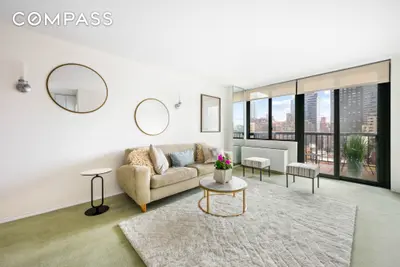

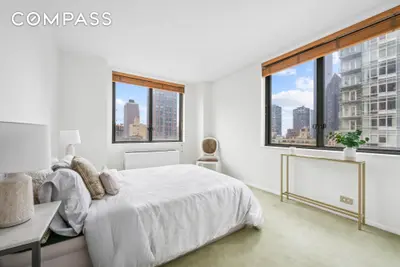
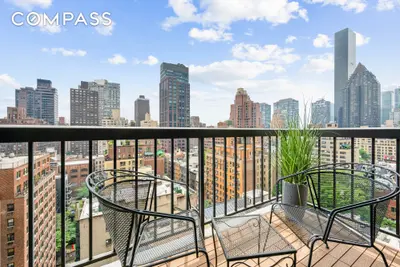
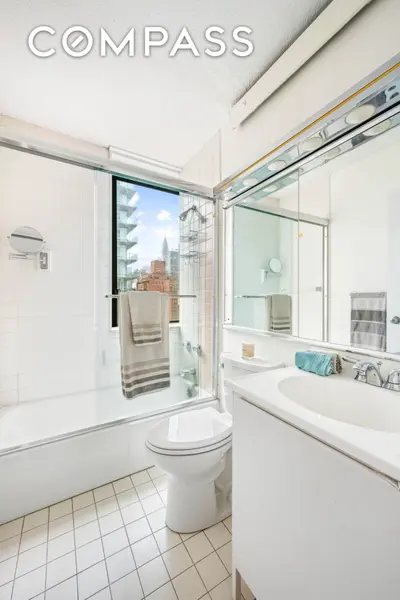
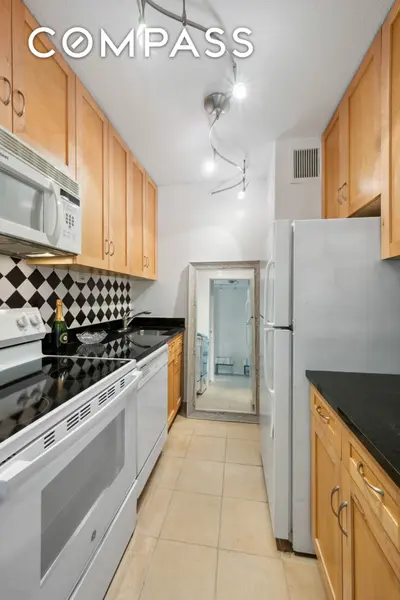


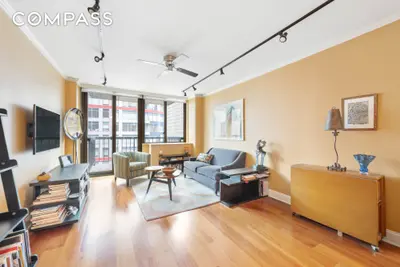
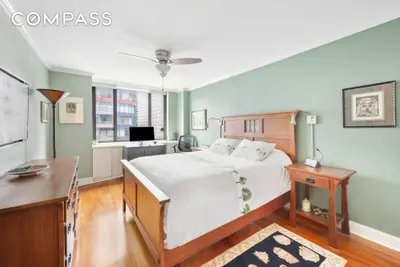
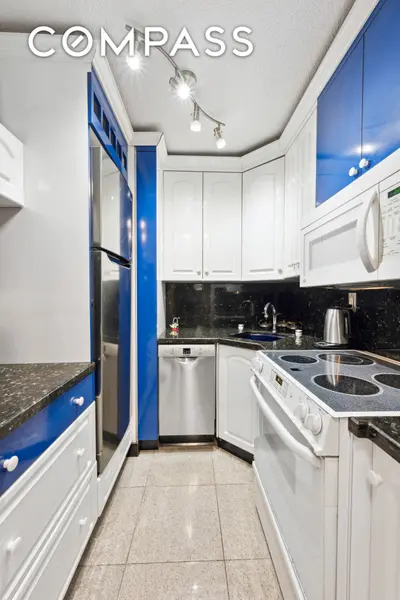
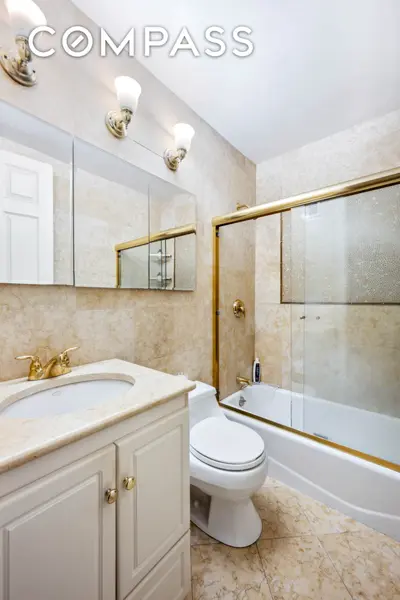

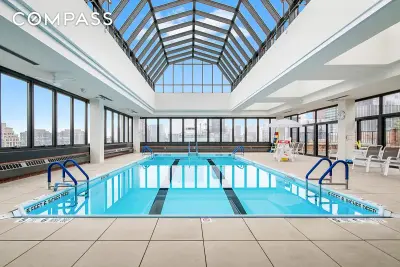


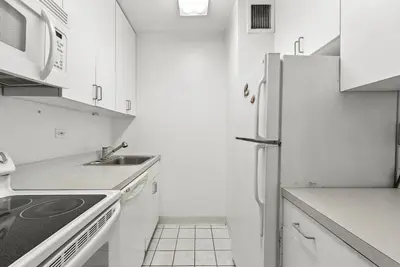

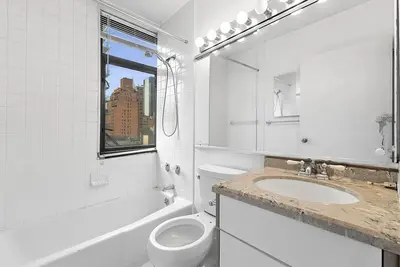

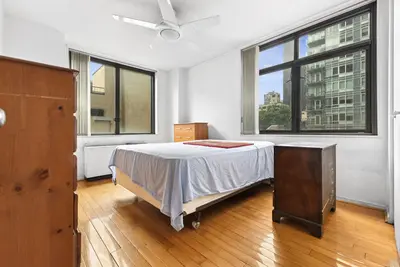
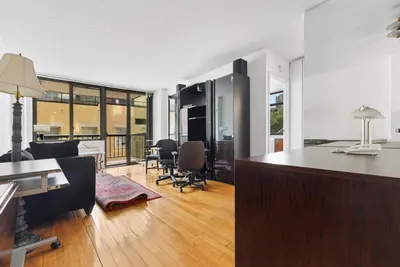
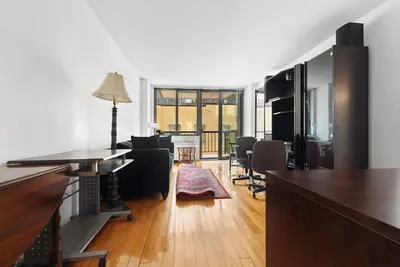
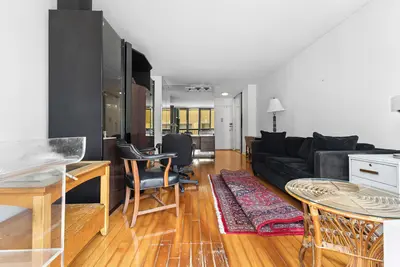
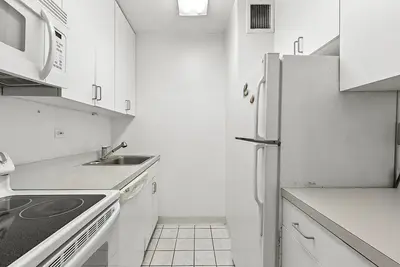
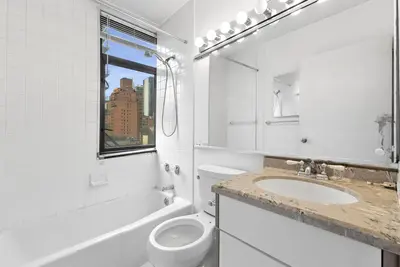
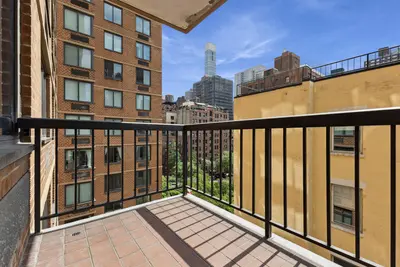
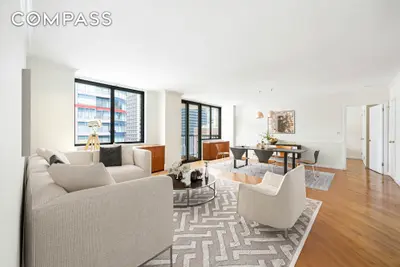
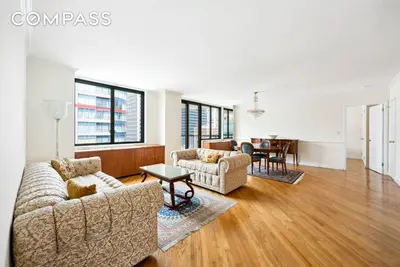
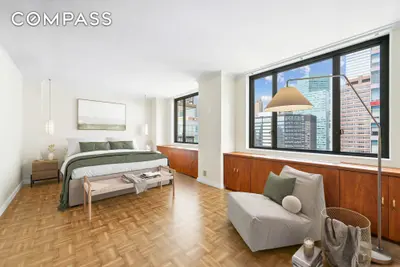
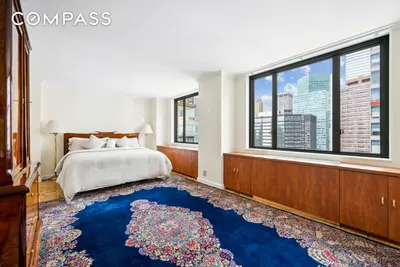
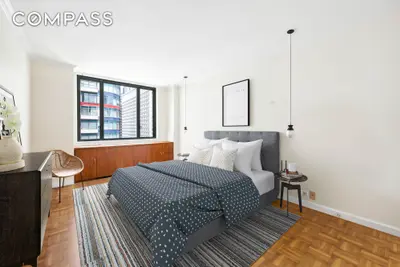
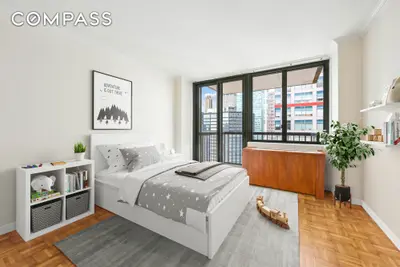
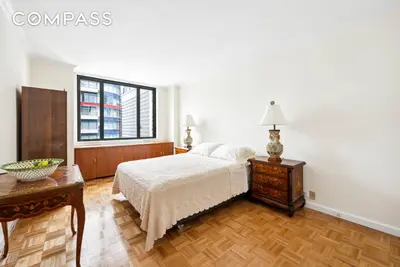
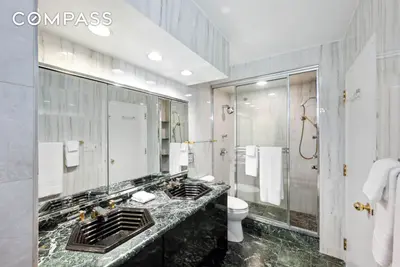
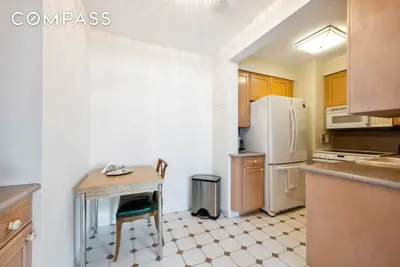

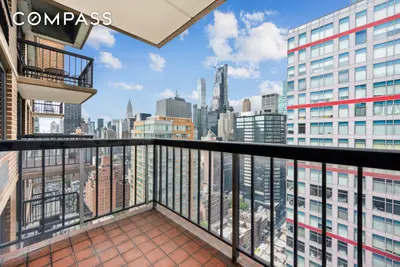


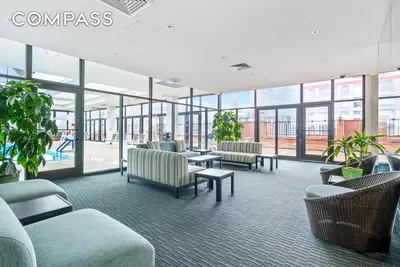
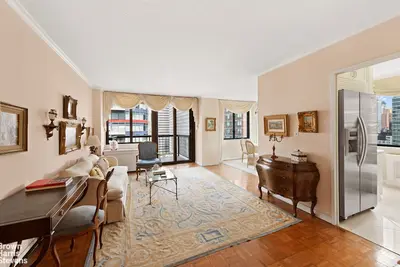
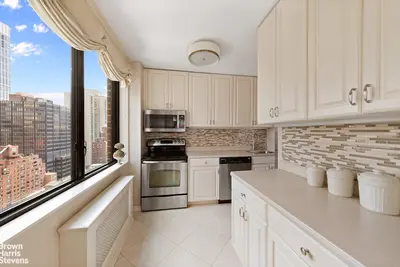
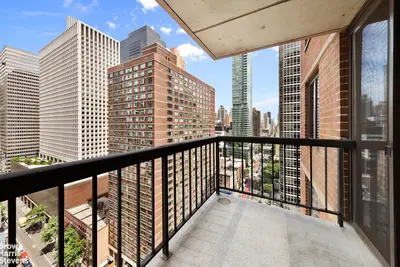
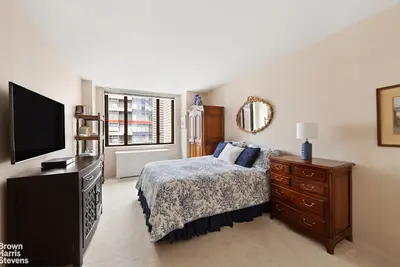

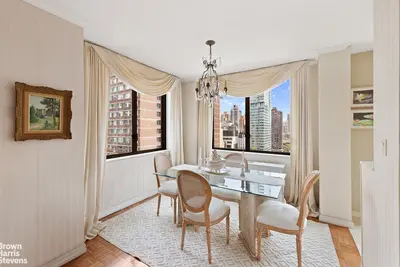
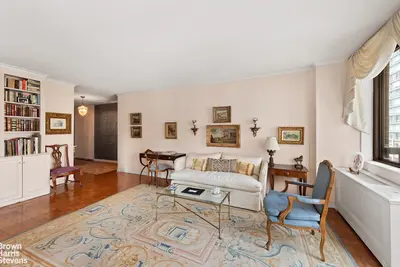

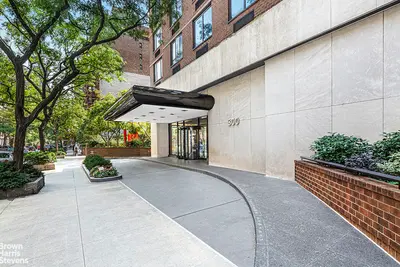


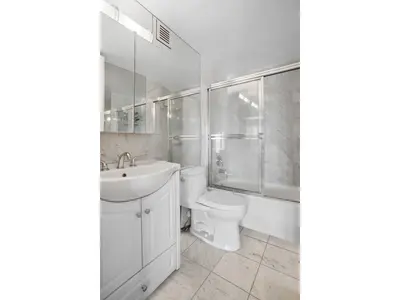

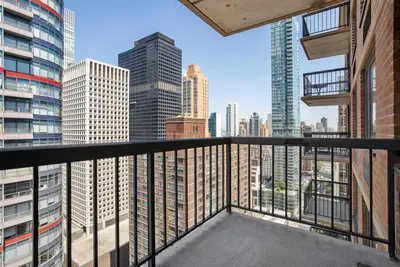
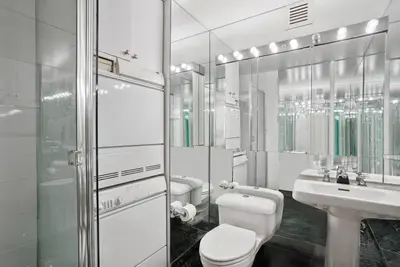

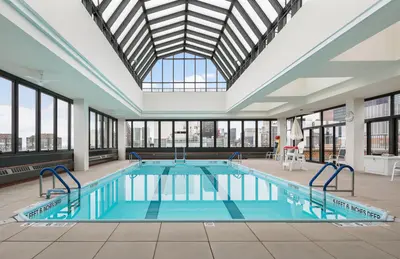


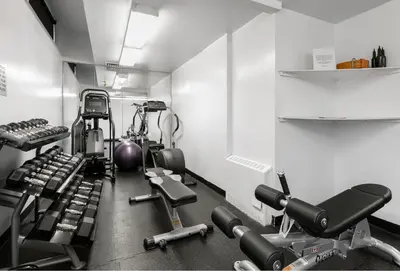

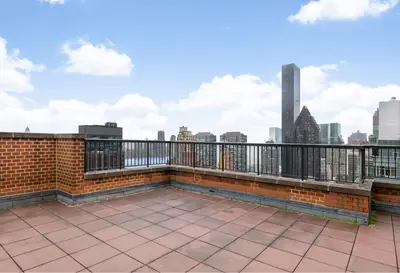


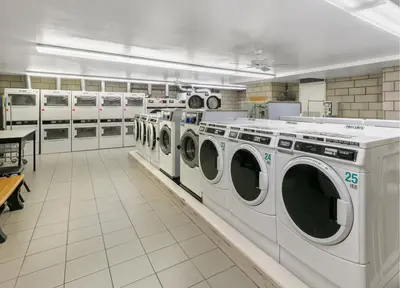
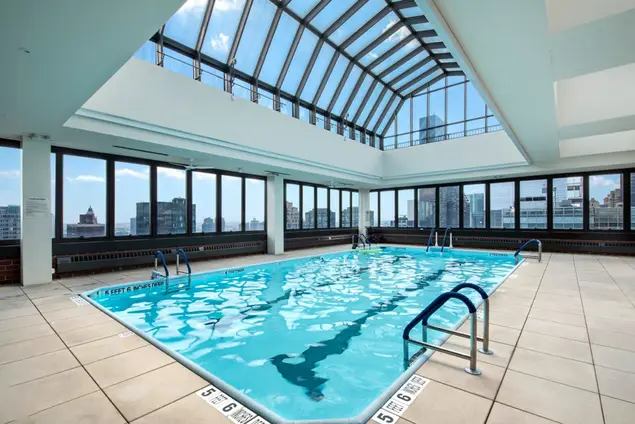
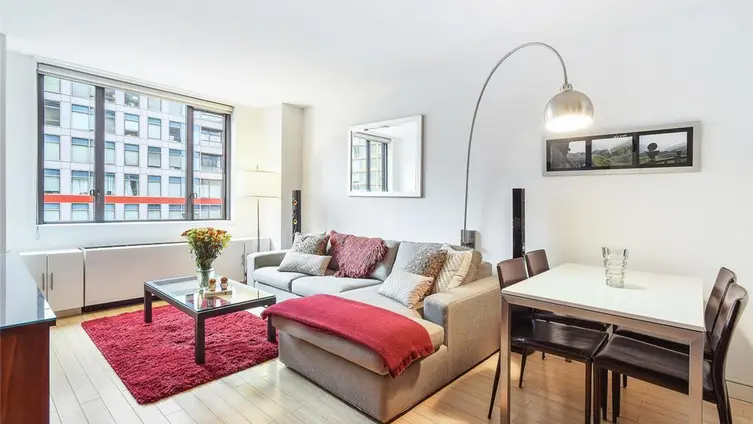
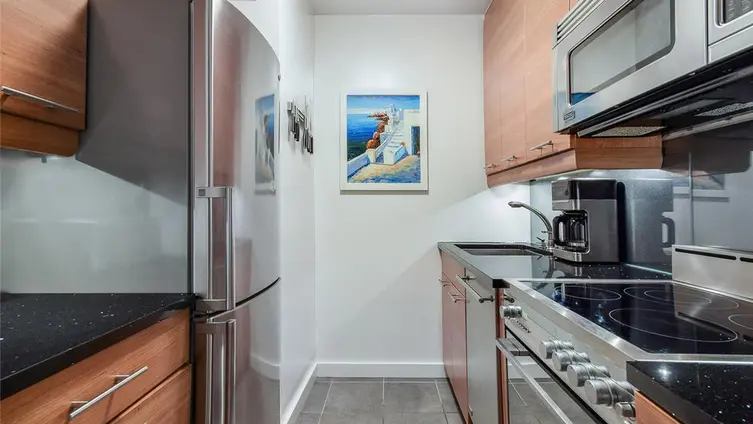
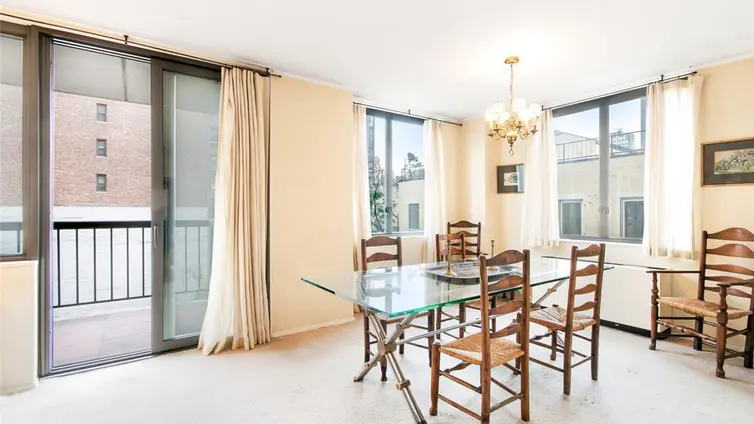
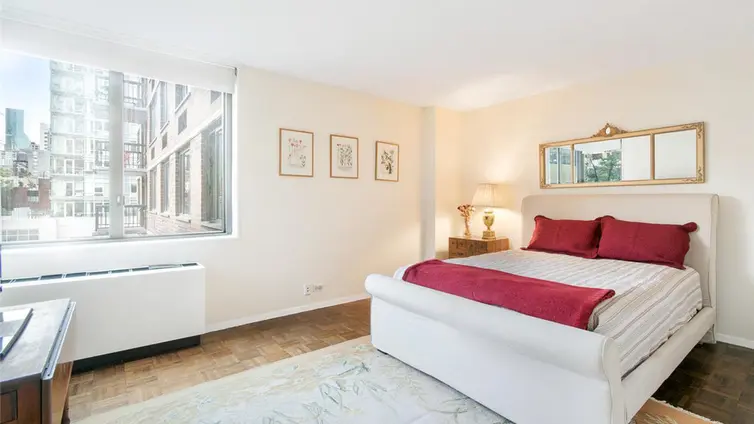
Connaught Tower is a full-service luxury cooperative with a full-time doorman, concierge, and live-in superintendent on staff. Amenities include a fitness center, glass-domed indoor swimming pool, sauna, lounge, port-cochere, parking garage, and bike room. The building's address at 300 East 54th Street allows for easy access to Midtown offices, top restaurants, Madison Avenue shopping, Whole Foods, Trader Joe's, and the E/M/6 train stop. Pets and pied-a-terres are permitted.


View school info, local attractions, transportation options & more.
Experience amazing 3D aerial maps and fly throughs.
For some co-ops, instead of price per square foot, we use an estimate of the number of rooms for each sold apartment to chart price changes over time. This is because many co-op listings do not include square footage information, and this makes it challenging to calculate accurate square-foot averages.
By displaying the price per estimated room count, we are able to provide a more reliable and consistent metric for comparing sales in the building. While we hope that this gives you a clearer sense of price trends in the building, all data should be independently verified. All data provided are only estimates and should not be used to make any purchase or sale decision.