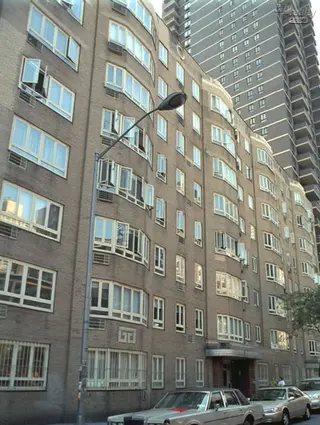
The Westmore, 333 West 57th Street: Sales Summary
between Eighth Avenue & Ninth Avenue Building Profile
All Sales
$1,023
Avg. Price / ft2
Past 12 months, based on 4 sales
$1,080,500
Avg. Price -
Past 12 months, based on 4 sales
$1,023
Median Price / ft2
Past 12 months, based on 4 sales
$998,500
Median Price
Past 12 months, based on 4 sales
Year
Avg Price / Ft2
Median Price / Ft2
Avg. Actual Price
Med. Actual Price
Transactions
2025
-
-
-
-
0
2024
$1,045
$919,714
$1,024
$896,000
7
2023
$1,085
$760,833
$1,090
$772,500
6
2022
$1,059
$978,000
$1,026
$867,500
10
2021
$1,053
$717,000
$1,106
$615,000
5
2020
$1,092
$754,700
$1,120
$733,000
4
2019
$1,024
$898,413
$1,024
$902,500
8
2018
$1,209
$1,005,667
$1,232
$962,500
6
2017
$1,199
$908,600
$1,175
$906,000
10
2016
$1,144
$859,333
$1,135
$746,000
9
2015
$1,190
$1,047,500
$1,136
$948,000
6
2014
$931
$602,246
$931
$625,000
3
2013
$992
$777,083
$997
$863,750
6
Year
Avg Price / Ft2
Median Price / Ft2
Avg. Actual Price
Med. Actual Price
Transactions
2012
$819
$828,750
$805
$792,500
4
2011
$502
$523,200
$376
$510,000
5
2010
$911
$732,657
$911
$789,045
4
2009
$744
$651,250
$741
$677,500
4
2008
$971
$713,477
$1,017
$752,500
9
2007
$864
$674,929
$868
$737,500
7
2006
$912
$562,084
$912
$530,000
9
2005
$911
$713,307
$936
$725,000
11
2004
$595
$456,681
$595
$395,723
8
2003
$551
$429,032
$551
$450,000
7
The Breakdown of All Sales by Apartment Size
Studios
$0
Avg. Price / ft2 -
Past 12 months, based on 1 sale
$575,000
Avg. Price -
Past 12 months, based on 1 sale
$0
Median Price / ft2 -
Past 12 months, based on 1 sale
$575,000
Median Price -
Past 12 months, based on 1 sale
Transactions
Average Price / Ft2
Median Price / Ft2
Avg. Actual Price
Med. Actual Price
2025
N/A
N/A
N/A
N/A
0
2024
$1,087
$598,333
$1,087
$595,000
3
2023
$1,140
$621,833
$1,140
$613,000
3
2022
$955
$554,000
$955
$554,000
2
2021
$1,118
$598,333
$1,118
$590,000
3
2020
$1,120
$592,650
$1,120
$592,650
2
2019
$650,500
$650,500
1
2018
$1,165
$692,000
$1,165
$692,000
2
2017
$1,158
$706,667
$1,158
$695,000
3
2016
$1,115
$705,250
$1,115
$725,000
4
2015
$1,136
$610,000
$1,136
$610,000
2
2014
$931
$625,000
$931
$625,000
1
2013
$1,000
$527,500
$1,000
$527,500
2
2012
N/A
N/A
N/A
N/A
0
2011
N/A
N/A
N/A
N/A
0
2010
N/A
N/A
N/A
N/A
0
2009
$727
$400,000
$727
$400,000
1
2008
$1,059
$529,415
$1,059
$529,415
1
2007
$855
$513,000
$855
$513,000
1
2006
$475,000
$475,000
1
2005
N/A
N/A
N/A
N/A
0
2004
$595
$312,500
$595
$312,500
2
2003
$550
$330,000
$550
$330,000
1
Show More
two Bedrooms
No sales in the past 12 months
No sales in the past 12 months
No sales in the past 12 months
No sales in the past 12 months
Transactions
Average Price / Ft2
Median Price / Ft2
Avg. Actual Price
Med. Actual Price
2025
N/A
N/A
N/A
N/A
0
2024
N/A
N/A
N/A
N/A
0
2023
N/A
N/A
N/A
N/A
0
2022
$1,428
$2,570,000
$1,428
$2,570,000
1
2021
N/A
N/A
N/A
N/A
0
2020
N/A
N/A
N/A
N/A
0
2019
N/A
N/A
N/A
N/A
0
2018
$1,162
$1,362,500
$1,162
$1,362,500
2
2017
N/A
N/A
N/A
N/A
0
2016
N/A
N/A
N/A
N/A
0
2015
$1,323
$1,584,500
$1,323
$1,584,500
2
2014
N/A
N/A
N/A
N/A
0
2013
N/A
N/A
N/A
N/A
0
2012
N/A
N/A
N/A
N/A
0
2011
$283
$510,000
$283
$510,000
1
2010
N/A
N/A
N/A
N/A
0
2009
N/A
N/A
N/A
N/A
0
2008
N/A
N/A
N/A
N/A
0
2007
N/A
N/A
N/A
N/A
0
2006
N/A
N/A
N/A
N/A
0
2005
N/A
N/A
N/A
N/A
0
2004
N/A
N/A
N/A
N/A
0
2003
N/A
N/A
N/A
N/A
0
Show More
four Bedrooms
No sales in the past 12 months
No sales in the past 12 months
No sales in the past 12 months
No sales in the past 12 months
Transactions
Average Price / Ft2
Median Price / Ft2
Avg. Actual Price
Med. Actual Price
2025
N/A
N/A
N/A
N/A
0
2024
N/A
N/A
N/A
N/A
0
2023
N/A
N/A
N/A
N/A
0
2022
N/A
N/A
N/A
N/A
0
2021
N/A
N/A
N/A
N/A
0
2020
N/A
N/A
N/A
N/A
0
2019
N/A
N/A
N/A
N/A
0
2018
N/A
N/A
N/A
N/A
0
2017
N/A
N/A
N/A
N/A
0
2016
N/A
N/A
N/A
N/A
0
2015
N/A
N/A
N/A
N/A
0
2014
N/A
N/A
N/A
N/A
0
2013
N/A
N/A
N/A
N/A
0
2012
N/A
N/A
N/A
N/A
0
2011
N/A
N/A
N/A
N/A
0
2010
N/A
N/A
N/A
N/A
0
2009
N/A
N/A
N/A
N/A
0
2008
N/A
N/A
N/A
N/A
0
2007
N/A
N/A
N/A
N/A
0
2006
N/A
N/A
N/A
N/A
0
2005
N/A
N/A
N/A
N/A
0
2004
N/A
N/A
N/A
N/A
0
2003
N/A
N/A
N/A
N/A
0
Show More
one Bedroom
$1,023
Avg. Price / ft2 -
Past 12 months, based on 2 sales
$998,500
Avg. Price -
Past 12 months, based on 2 sales
$1,023
Median Price / ft2 -
Past 12 months, based on 2 sales
$998,500
Median Price -
Past 12 months, based on 2 sales
Transactions
Average Price / Ft2
Median Price / Ft2
Avg. Actual Price
Med. Actual Price
2025
N/A
N/A
N/A
N/A
0
2024
$1,024
$964,333
$1,024
$972,000
3
2023
$1,030
$899,833
$1,030
$879,500
3
2022
$993
$877,833
$1,026
$900,000
6
2021
$1,020
$895,000
$1,020
$895,000
2
2020
$1,079
$916,750
$1,079
$916,750
2
2019
$1,024
$933,829
$1,024
$925,000
7
2018
$1,345
$962,500
$1,345
$962,500
2
2017
$1,219
$995,143
$1,219
$980,000
7
2016
$1,156
$982,600
$1,153
$1,045,000
5
2015
$1,083
$948,000
$1,083
$948,000
2
2014
$590,869
$590,869
2
2013
$989
$923,333
$994
$895,000
3
2012
$819
$780,000
$805
$765,000
3
2011
$611
$462,000
$611
$465,000
3
2010
$911
$820,000
$911
$820,000
1
2009
$752
$677,500
$752
$677,500
2
2008
$942
$790,625
$1,000
$781,250
4
2007
$869
$738,750
$869
$738,750
2
2006
$912
$775,000
$912
$775,000
1
2005
$911
$833,833
$936
$842,500
3
2004
$446,446
$446,446
1
2003
$552
$468,863
$552
$468,863
2
Show More
three Bedrooms
No sales in the past 12 months
No sales in the past 12 months
No sales in the past 12 months
No sales in the past 12 months
Transactions
Average Price / Ft2
Median Price / Ft2
Avg. Actual Price
Med. Actual Price
2025
N/A
N/A
N/A
N/A
0
2024
N/A
N/A
N/A
N/A
0
2023
N/A
N/A
N/A
N/A
0
2022
N/A
N/A
N/A
N/A
0
2021
N/A
N/A
N/A
N/A
0
2020
N/A
N/A
N/A
N/A
0
2019
N/A
N/A
N/A
N/A
0
2018
N/A
N/A
N/A
N/A
0
2017
N/A
N/A
N/A
N/A
0
2016
N/A
N/A
N/A
N/A
0
2015
N/A
N/A
N/A
N/A
0
2014
N/A
N/A
N/A
N/A
0
2013
N/A
N/A
N/A
N/A
0
2012
N/A
N/A
N/A
N/A
0
2011
N/A
N/A
N/A
N/A
0
2010
N/A
N/A
N/A
N/A
0
2009
N/A
N/A
N/A
N/A
0
2008
N/A
N/A
N/A
N/A
0
2007
N/A
N/A
N/A
N/A
0
2006
N/A
N/A
N/A
N/A
0
2005
N/A
N/A
N/A
N/A
0
2004
N/A
N/A
N/A
N/A
0
2003
N/A
N/A
N/A
N/A
0
Show More
five Bedrooms
No sales in the past 12 months
No sales in the past 12 months
No sales in the past 12 months
No sales in the past 12 months
Transactions
Average Price / Ft2
Median Price / Ft2
Avg. Actual Price
Med. Actual Price
2025
N/A
N/A
N/A
N/A
0
2024
N/A
N/A
N/A
N/A
0
2023
N/A
N/A
N/A
N/A
0
2022
N/A
N/A
N/A
N/A
0
2021
N/A
N/A
N/A
N/A
0
2020
N/A
N/A
N/A
N/A
0
2019
N/A
N/A
N/A
N/A
0
2018
N/A
N/A
N/A
N/A
0
2017
N/A
N/A
N/A
N/A
0
2016
N/A
N/A
N/A
N/A
0
2015
N/A
N/A
N/A
N/A
0
2014
N/A
N/A
N/A
N/A
0
2013
N/A
N/A
N/A
N/A
0
2012
N/A
N/A
N/A
N/A
0
2011
N/A
N/A
N/A
N/A
0
2010
N/A
N/A
N/A
N/A
0
2009
N/A
N/A
N/A
N/A
0
2008
N/A
N/A
N/A
N/A
0
2007
N/A
N/A
N/A
N/A
0
2006
N/A
N/A
N/A
N/A
0
2005
N/A
N/A
N/A
N/A
0
2004
N/A
N/A
N/A
N/A
0
2003
N/A
N/A
N/A
N/A
0
Show More
The Westmore, 333 West 57th Street Pricing Graph
- All
- Studios
- One Beds
- Two Beds
- Three Beds
- Four Beds
- Five Beds
Get alerts with new listings in this building!