Shh... Many units sell without being publicly listed.
Explore off-market possibilities at 140 East 40th Street – inquire to find out about residences with owners open to private offers!
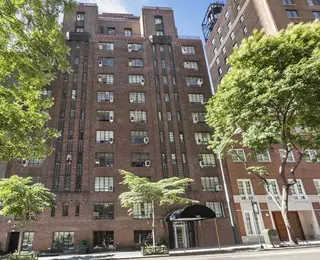
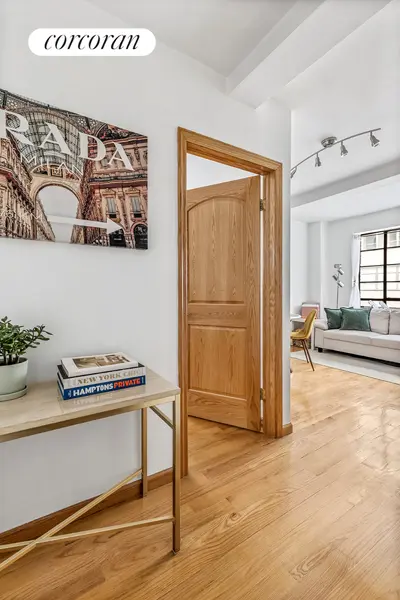
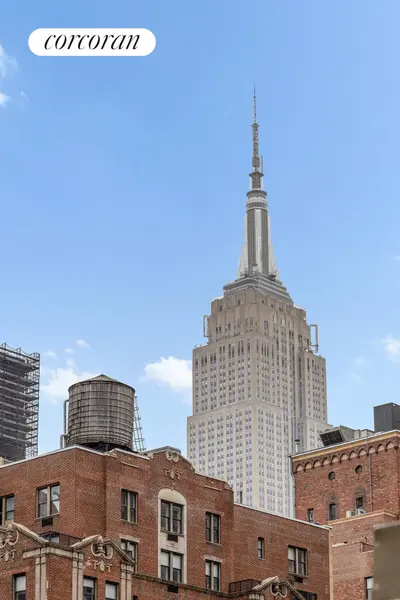
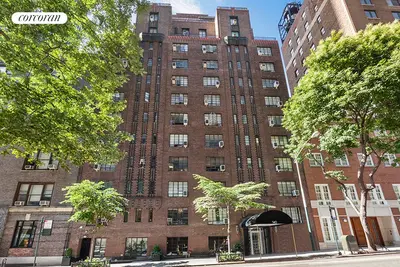
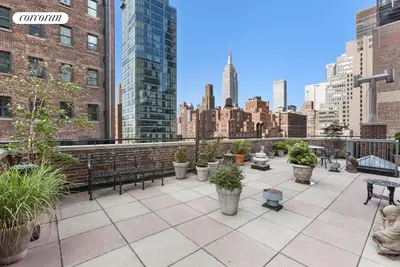
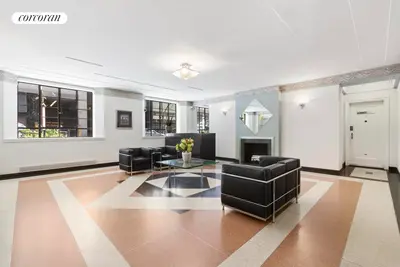

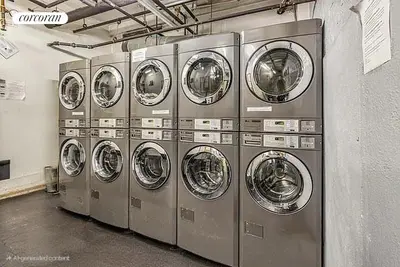


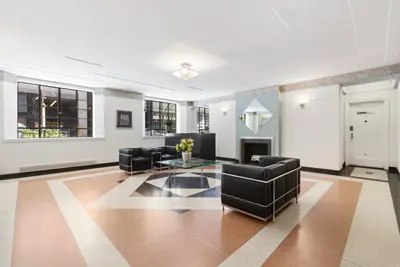
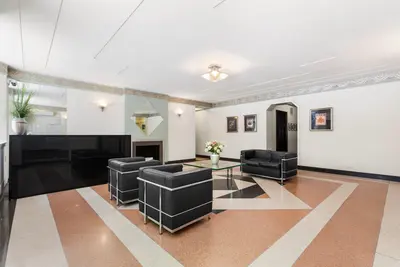
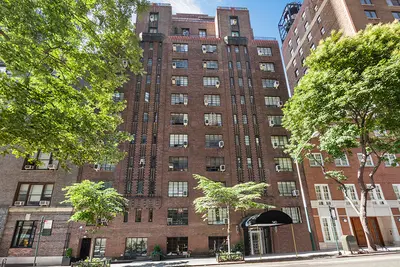
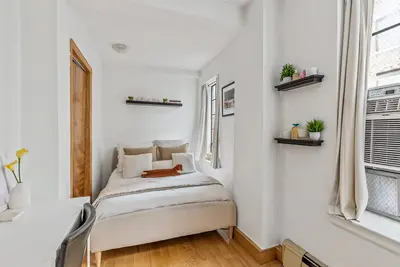
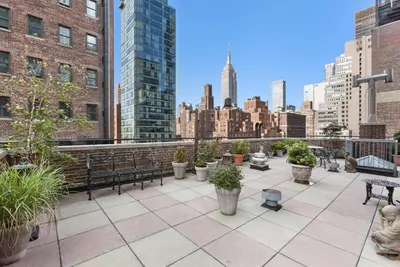


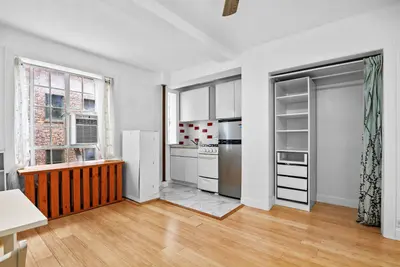
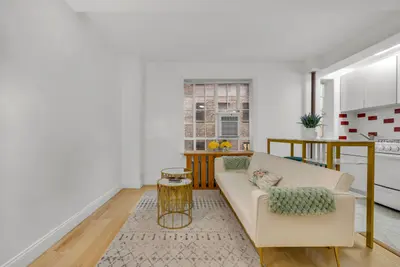
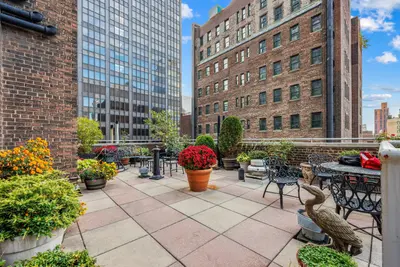
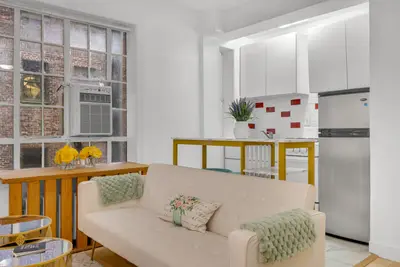

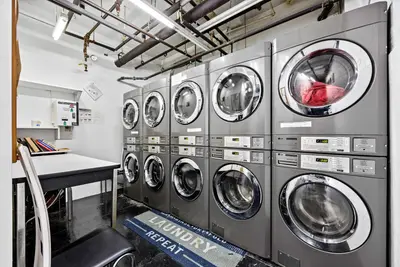
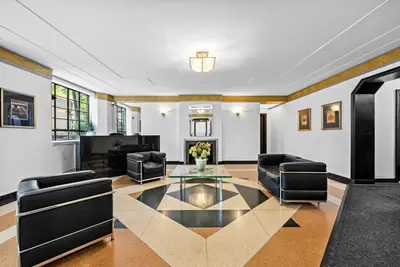
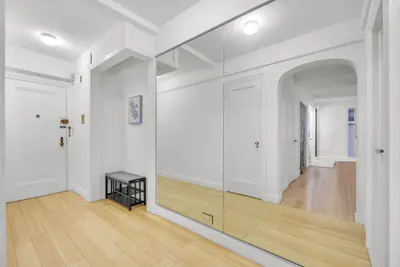
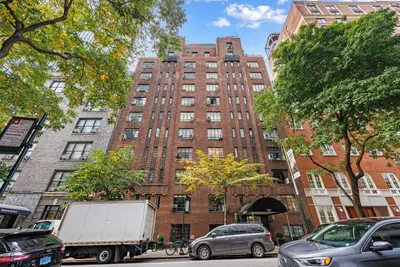

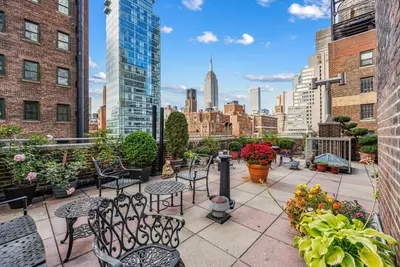
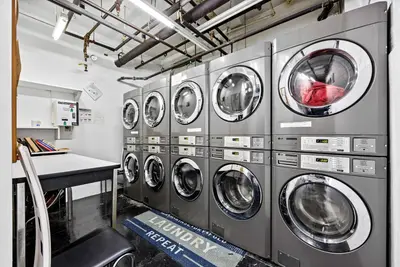


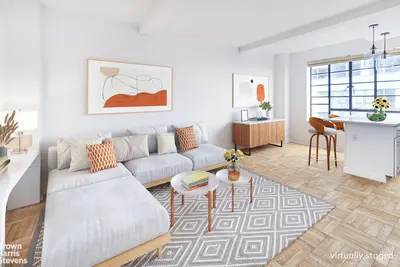
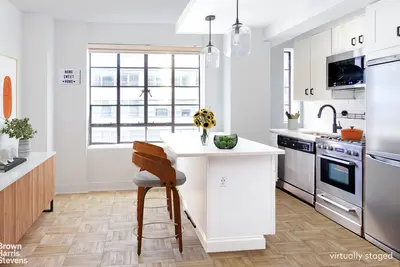
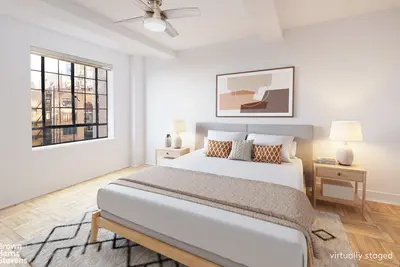
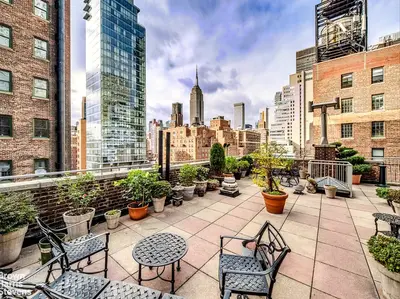
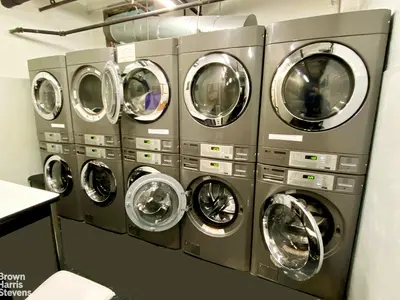
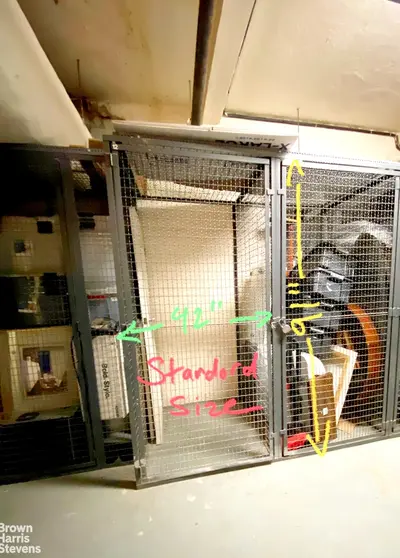
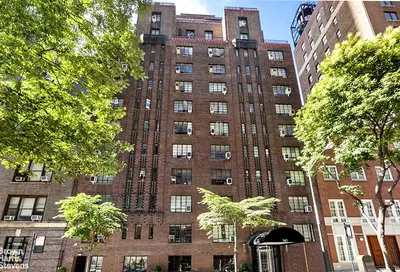
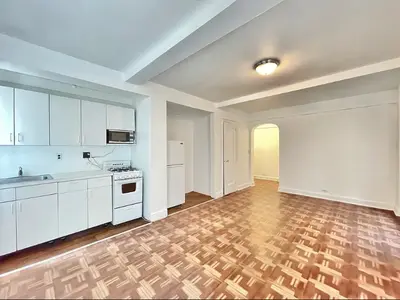
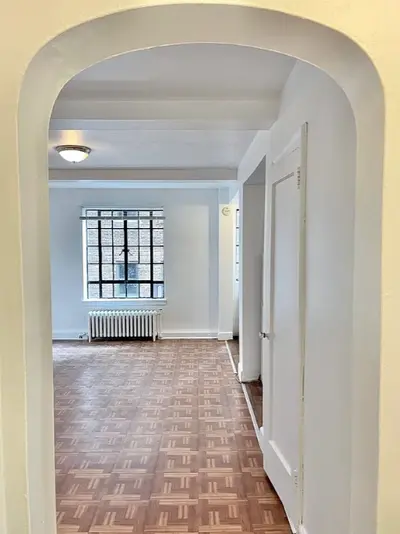
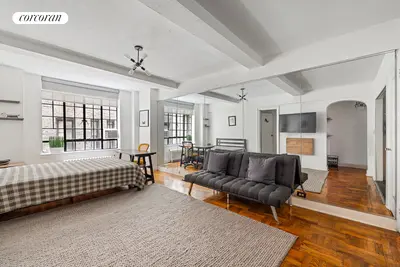
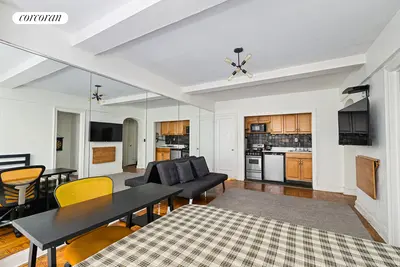
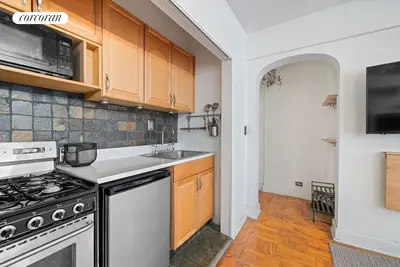
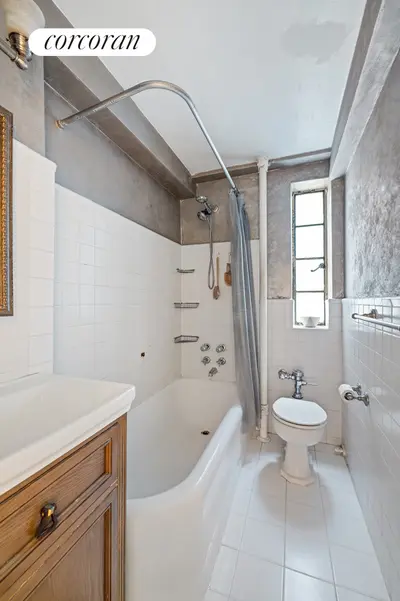
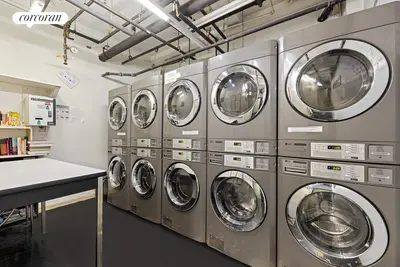
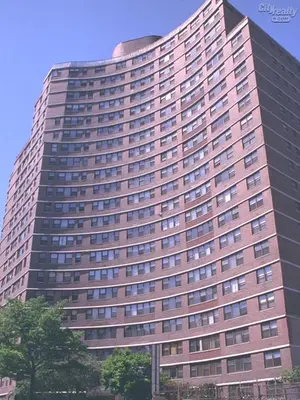
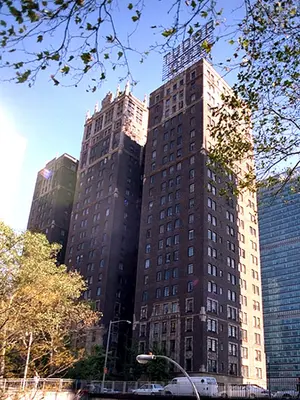
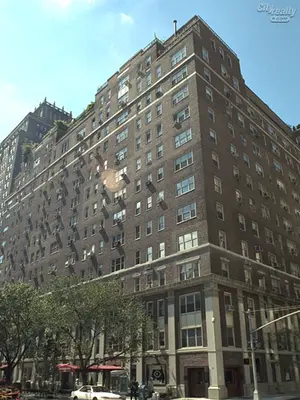
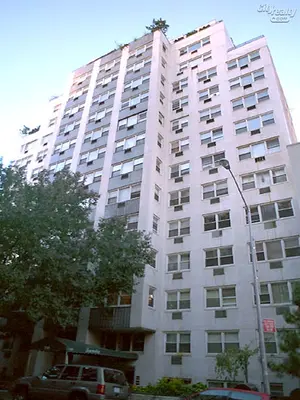
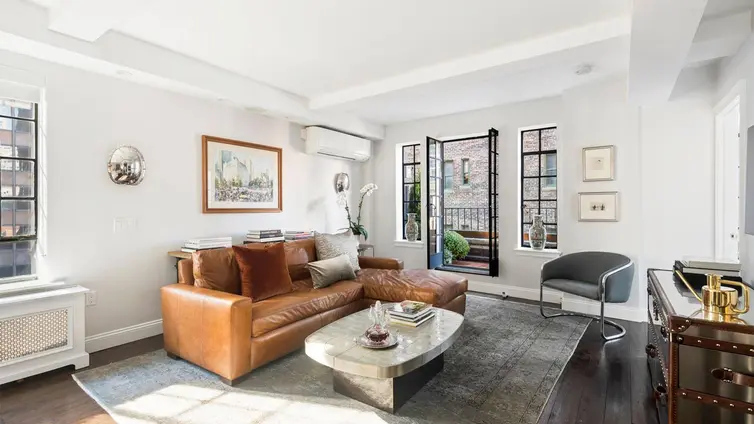
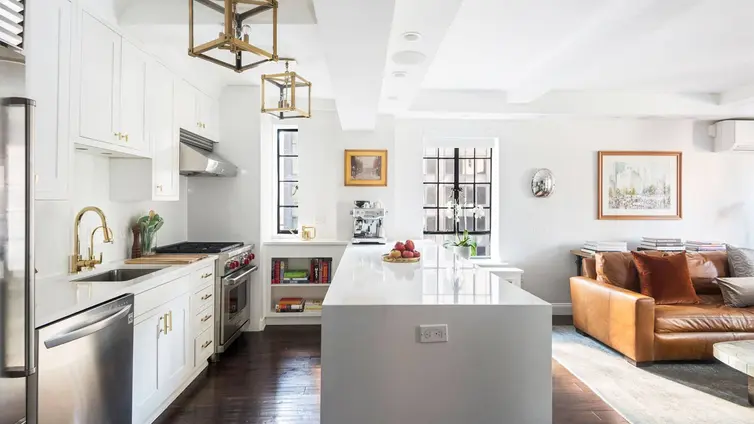
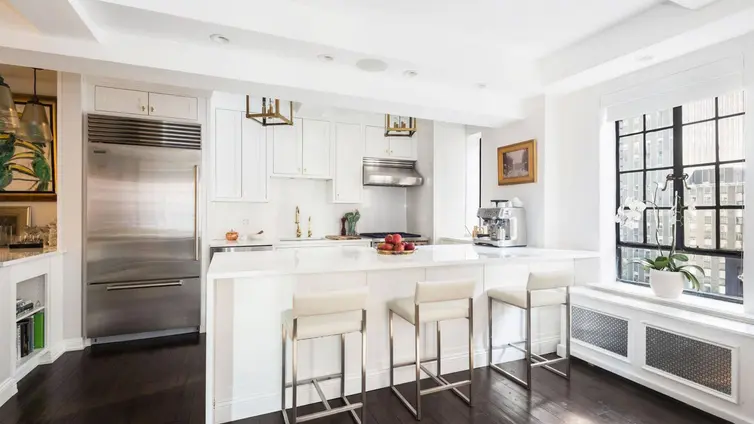
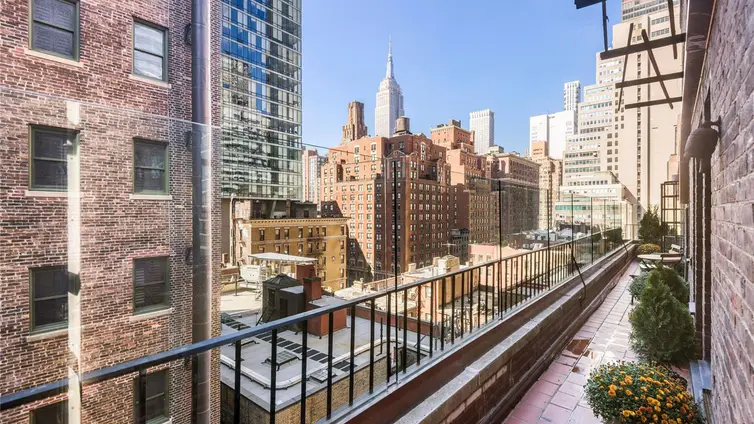
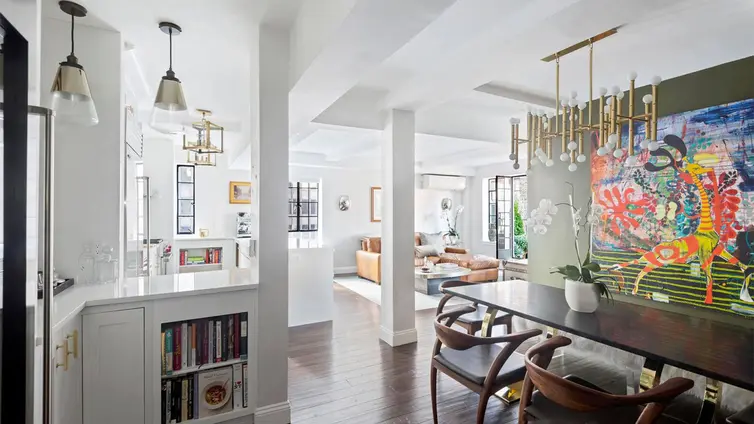
140 East 40th Street was designed in 1930 by Bien & Prince (designer of the Carlyle Hotel) and converted to a 98-unit cooperative in 1980. The building features a grand Art Deco lobby with terrazzo floors, Le Corbusier designed seating, a sleek fireplace and is attended seven days a week by a part-time security guard. Other notable building attributes include two relatively new elevators, central laundry, personal storage, bike storage, package room, live-in super and a fully furnished and landscaped roof deck with magnificent views of the Empire State Building.
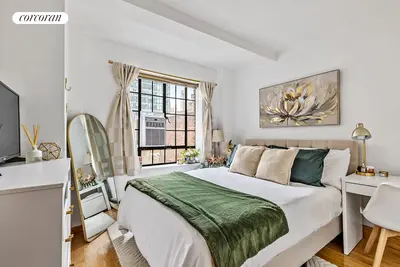
The building allows pied-a-terre buyers as well as co-purchasing, but not dogs. It is in a prime Murray Hill location near Grand Central Terminal, fine dining, shopping, and nightlife.
Explore off-market possibilities at 140 East 40th Street – inquire to find out about residences with owners open to private offers!

View school info, local attractions, transportation options & more.
Experience amazing 3D aerial maps and fly throughs.
For some co-ops, instead of price per square foot, we use an estimate of the number of rooms for each sold apartment to chart price changes over time. This is because many co-op listings do not include square footage information, and this makes it challenging to calculate accurate square-foot averages.
By displaying the price per estimated room count, we are able to provide a more reliable and consistent metric for comparing sales in the building. While we hope that this gives you a clearer sense of price trends in the building, all data should be independently verified. All data provided are only estimates and should not be used to make any purchase or sale decision.
|
Year
Avg Price / Room (Est)
Avg. Actual Price
Med. Actual Price
Transactions
2025
$155,500
$592,500
2
2024
$159,917
$442,750
2
2023
$147,867
$369,667
3
2022
$163,600
$451,500
4
2021
$179,222
$599,250
4
2020
-
-
0
2019
$156,533
$413,625
4
2018
$168,920
$536,800
5
2017
$200,286
$810,000
5
2016
$180,000
$540,000
1
2015
$131,059
$343,466
8
2014
$150,621
$487,173
13
|
Year
Avg Price / Room (Est)
Avg. Actual Price
Med. Actual Price
Transactions
2013
$130,443
$393,071
7
2012
-
-
0
2011
$136,042
$384,000
8
2010
$158,185
$514,556
3
2009
$140,833
$422,500
1
2008
$133,333
$380,000
3
2007
$135,600
$369,000
5
2006
$123,987
$431,633
3
2005
$131,013
$454,438
4
2004
$79,343
$198,357
7
2003
$75,178
$204,571
7
|
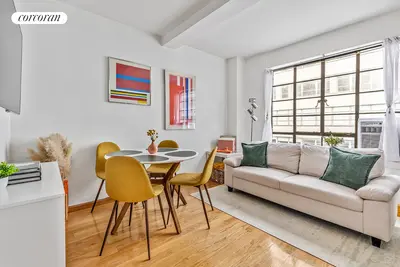
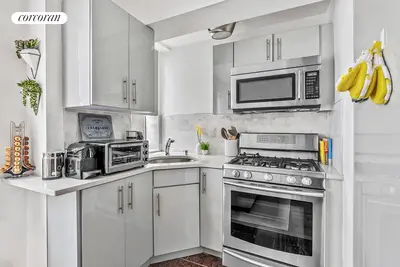
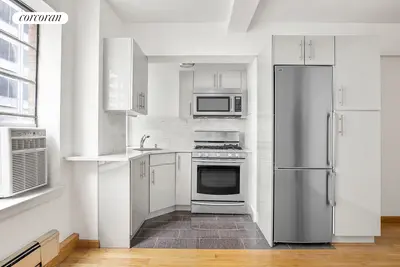
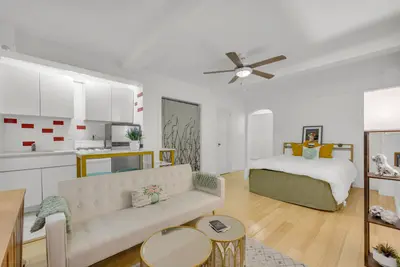
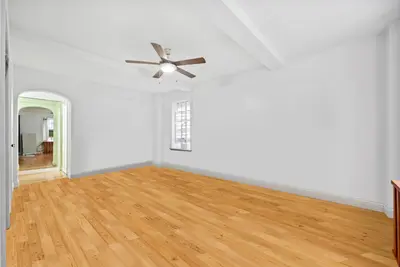
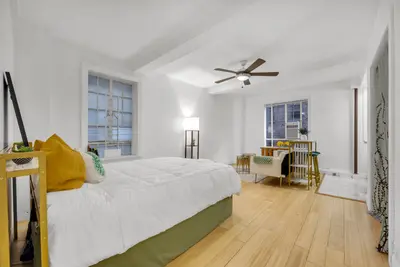
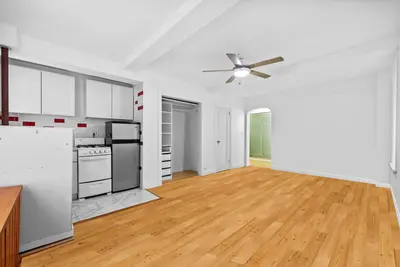
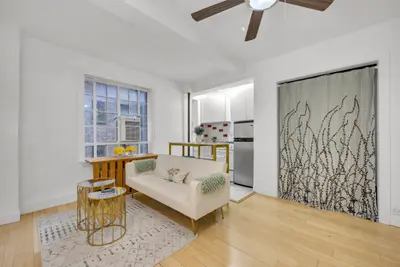
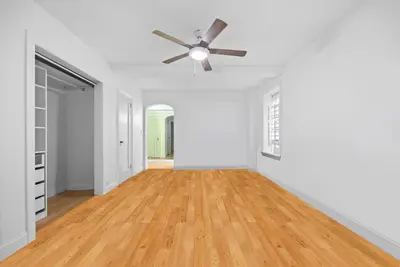
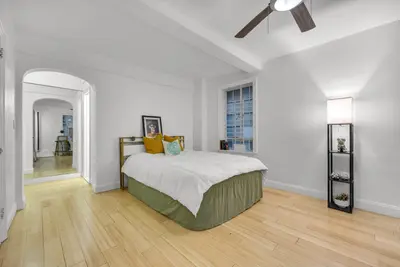
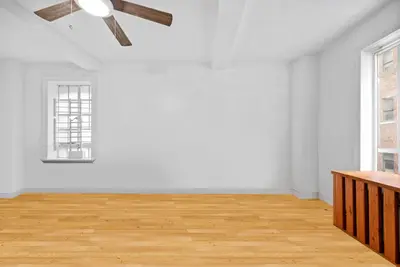
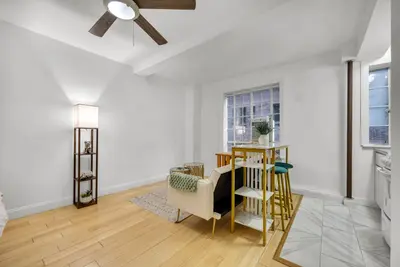
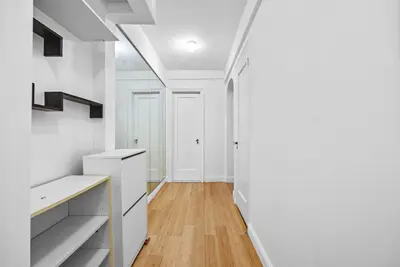
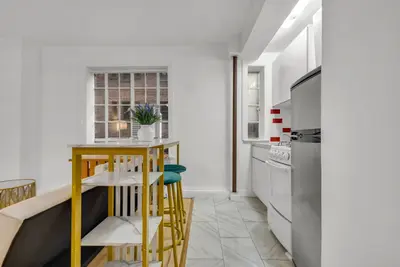
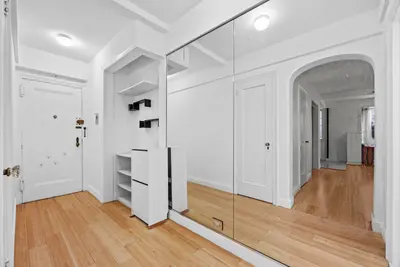
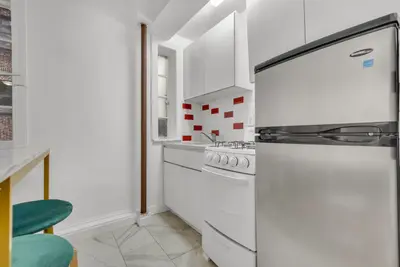
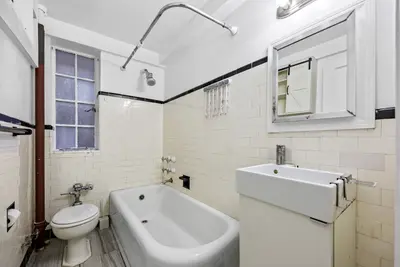
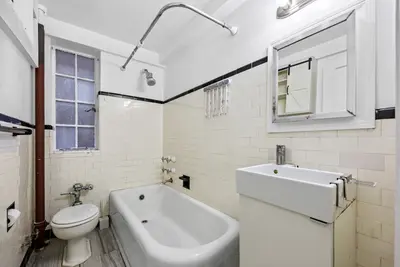
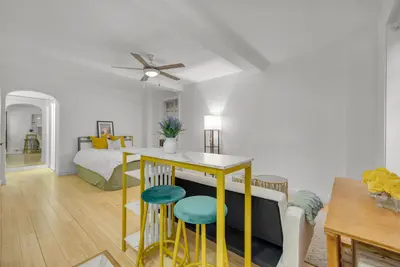
the following is a slider of images. For screen reader users, all slides are visible at all time so you may ignore control buttons.
Sign-up and we'll email you new listings in this building!
Whether you’re a buyer, investor, or simply curious, this report is your key to unlocking in-depth insights and analysis on .
Please confirm your details: