100 Riverside Drive - Upper West Side
- Apartments
- Overview & Photos
- Maps
- Floorplans
- Sales Data & Comps
- Similar Buildings
- All Units
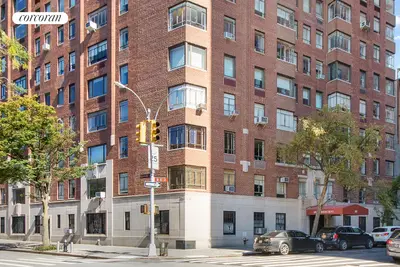

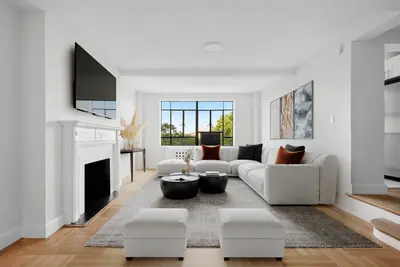


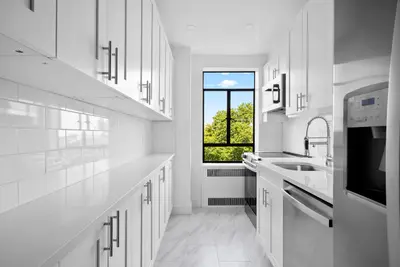
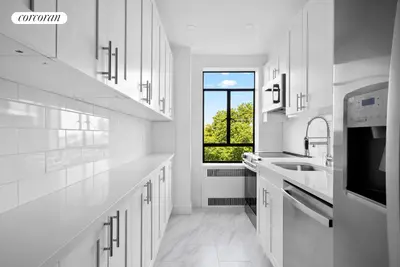

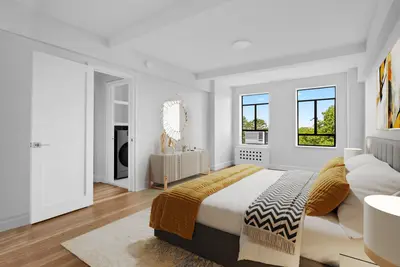
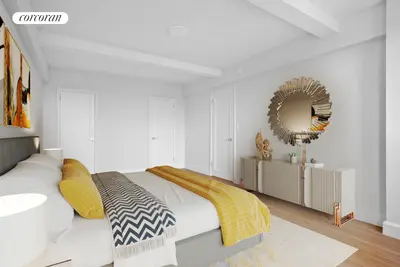

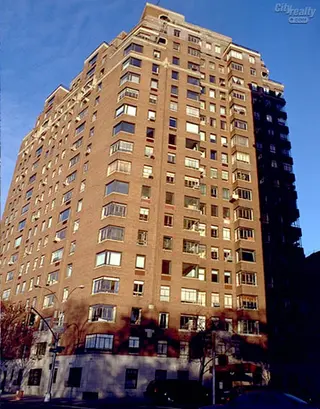
100 Riverside Drive is a distinguished Art Deco cooperative building constructed in 1938 by Simon Brothers and designed by Boak & Paris. The 19-story red-brick Georgian-style structure, which contains 93 apartments, was converted to cooperative status in 1990. The building is notable for its architectural features including a limestone base with an octagonal-surrounded canopied entrance, numerous corner windows, and a handsome rooftop water tank enclosure.
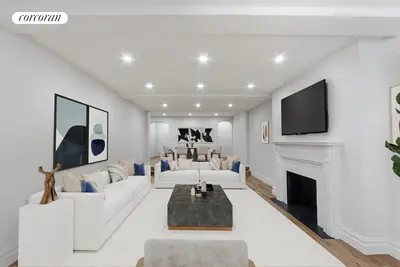
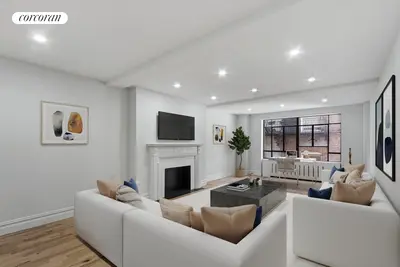
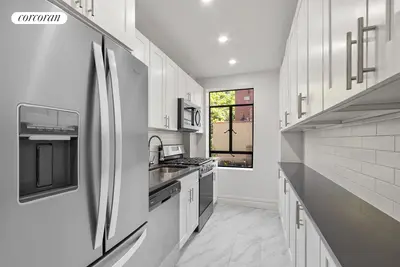
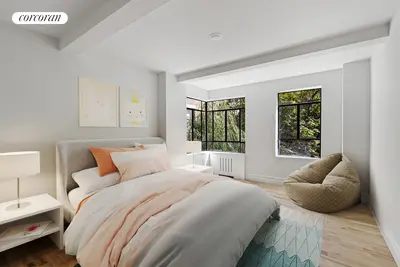
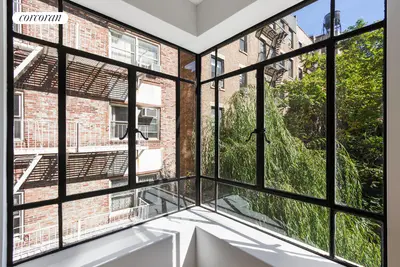
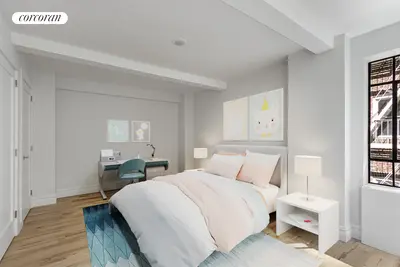
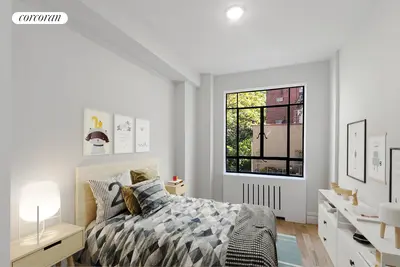
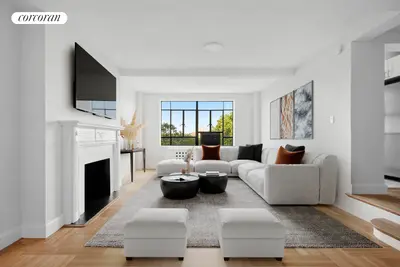
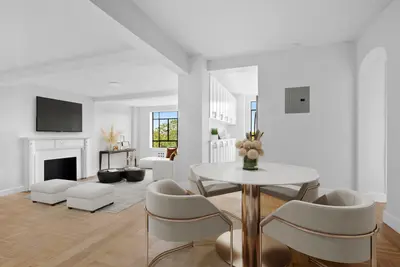
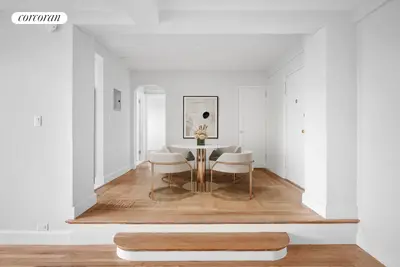
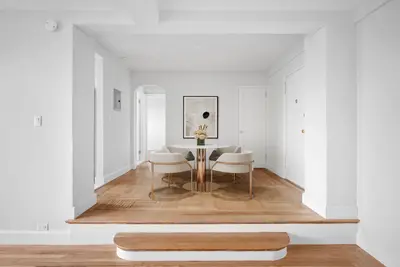
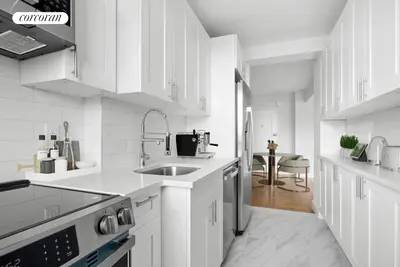
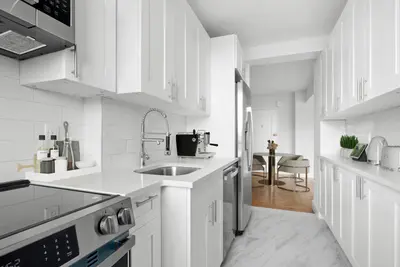
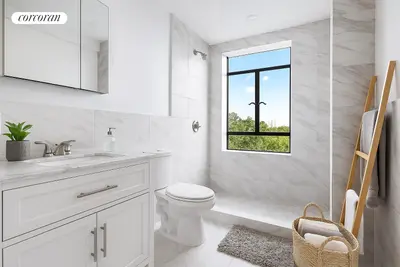
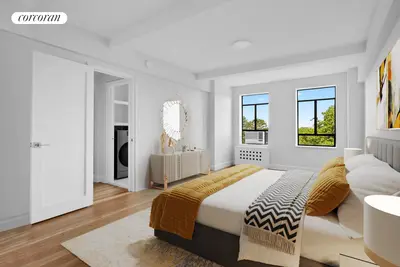
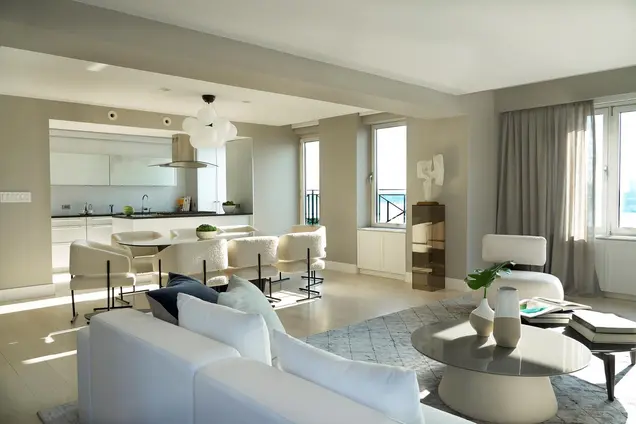
The building's apartments are characterized by gracious prewar layouts, many featuring sunken living rooms and stunning Hudson River views. Most units retain original architectural details while accommodating modern renovations. The building's position at the corner of 82nd Street and Riverside Drive offers residents immediate access to Riverside Park and proximity to Upper West Side amenities.
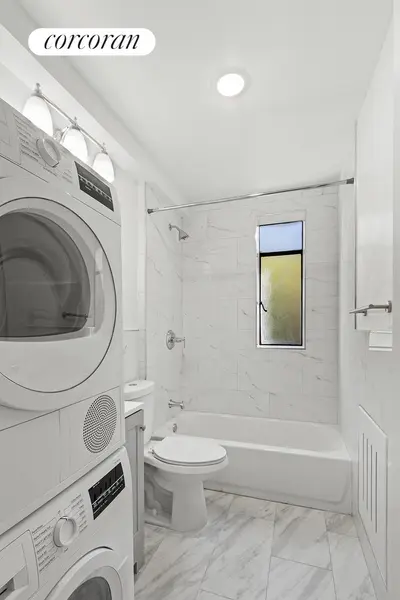
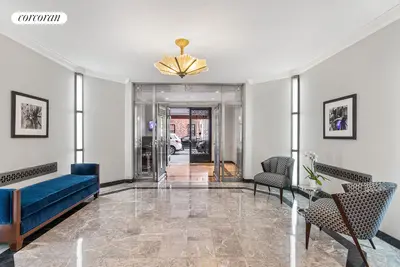
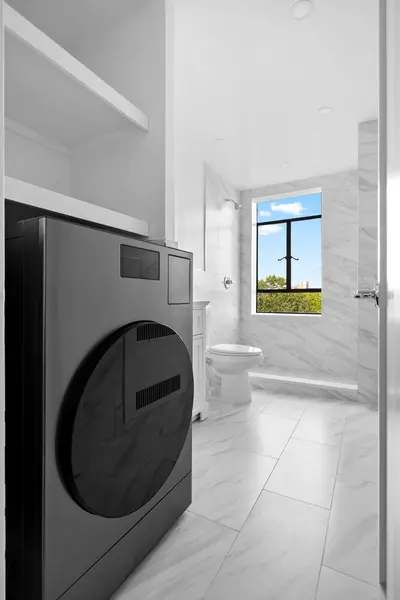
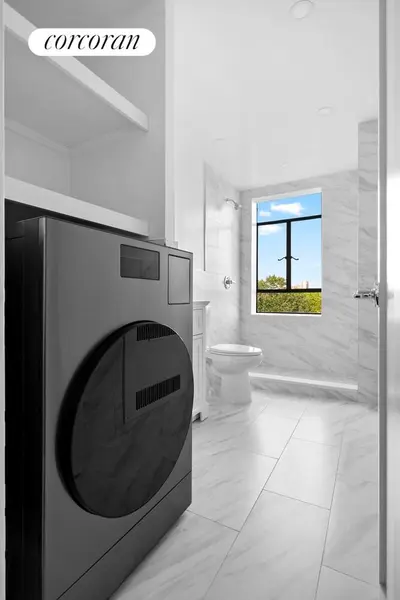
This full-service cooperative offers residents 24-hour doorman service, a resident manager, fitness center, bike room, storage facilities, and central laundry. The pet-friendly building allows 75% financing and permits pied-à-terres, with parent purchases and guarantors considered case-by-case. The building maintains its original Art Deco character while providing modern amenities expected in premium Upper West Side cooperatives.


View school info, local attractions, transportation options & more.
Experience amazing 3D aerial maps and fly throughs.
For some co-ops, instead of price per square foot, we use an estimate of the number of rooms for each sold apartment to chart price changes over time. This is because many co-op listings do not include square footage information, and this makes it challenging to calculate accurate square-foot averages.
By displaying the price per estimated room count, we are able to provide a more reliable and consistent metric for comparing sales in the building. While we hope that this gives you a clearer sense of price trends in the building, all data should be independently verified. All data provided are only estimates and should not be used to make any purchase or sale decision.
Broker & Buyer Comments