Skip to Content
110 Thompson Street - SoHo
110 Thompson Street
Co-Op in SoHo
  • Apartments
  • Overview & Photos
  • Maps
  • Floorplans
  • Sales Data & Comps
  • Similar Buildings
Get alerts with new listings in this building!
110 Thompson Street

110 Thompson Street

Co-op located in SoHo, between Spring Street & Prince Street  Map

  • Apartments For Sale (1)
  • For Rent (1)
  • Recent Sales (6)
  • All Units in Building (20)
Unit #
Beds
Baths
Size
Price / Ft2
Price
Listed on
Days on Market
Unit #
Beds
Baths
Size
Price / Ft2
Price
Listed on
Days on Market
Unit #
Beds
Baths
Size
Closing Price
Price / Ft2
Asking Price
Sold on
View Full Sales History

Overview of 110 Thompson Street

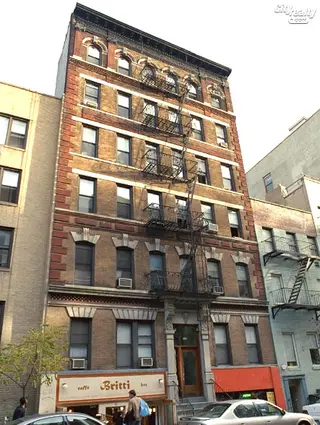
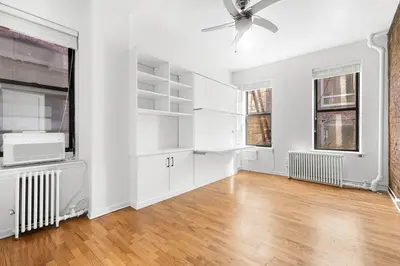
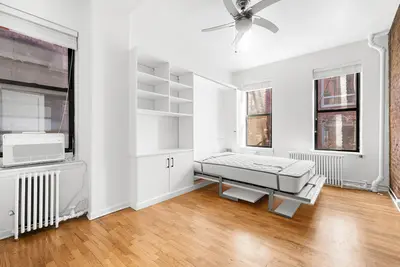
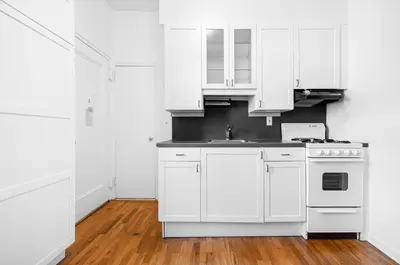
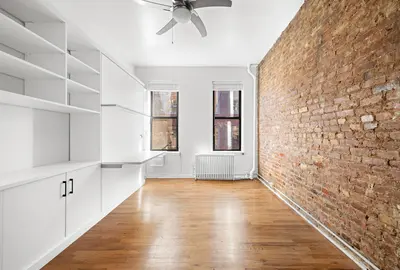
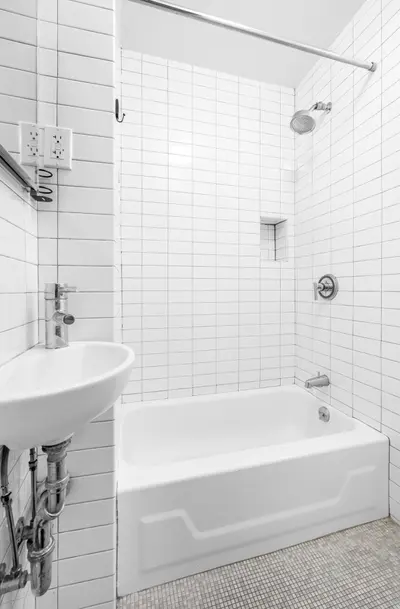
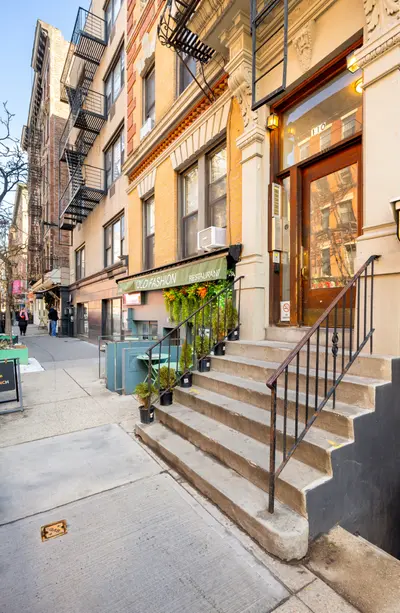
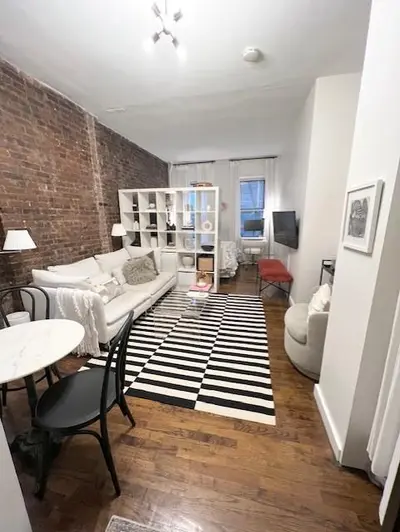
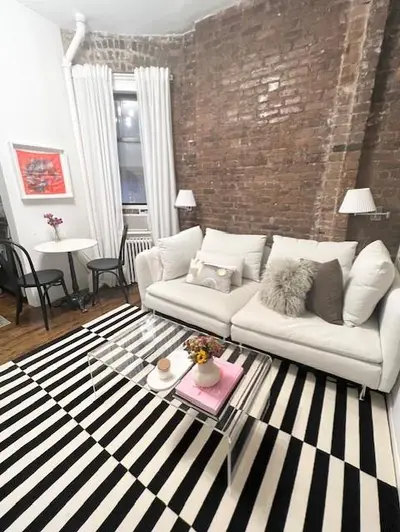
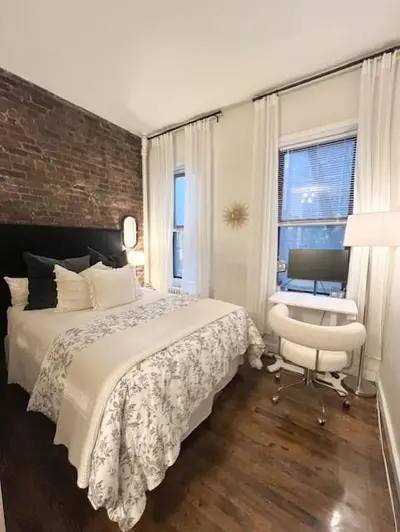
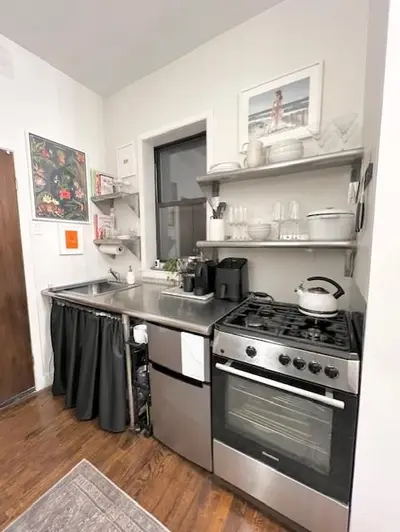
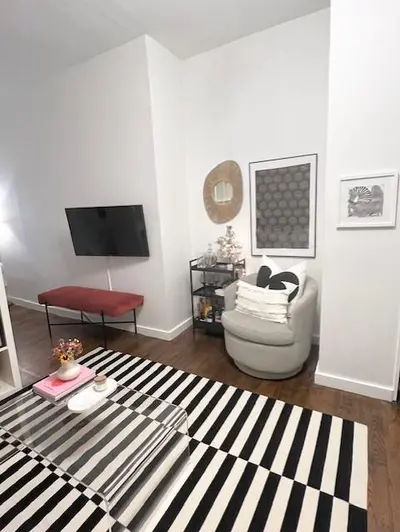
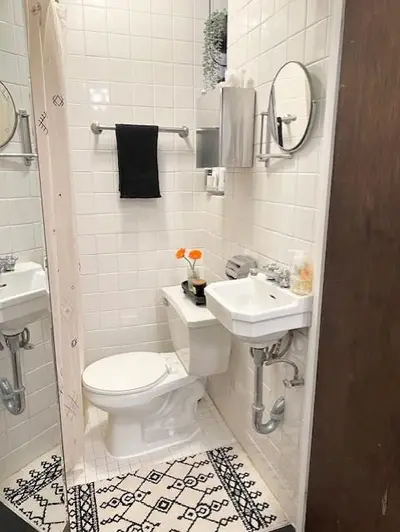
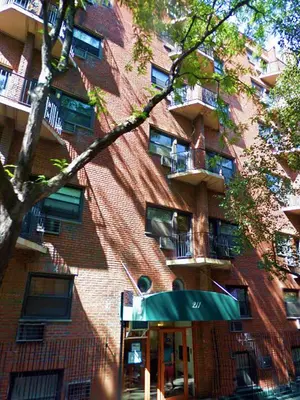
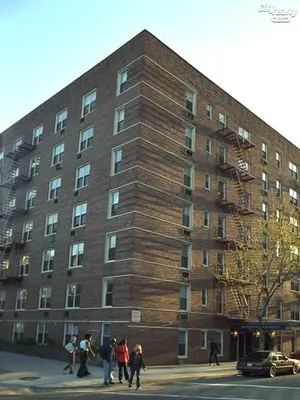
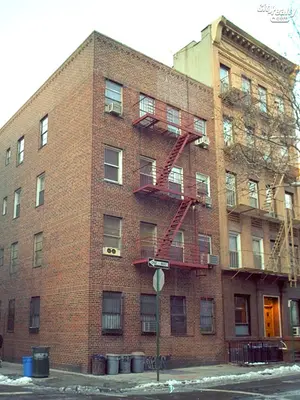
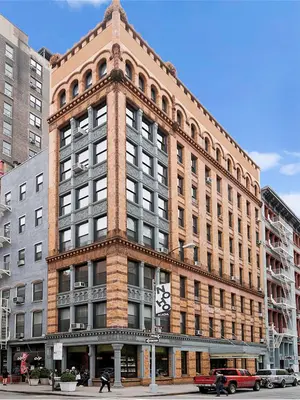
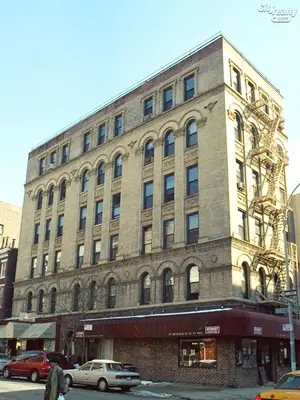
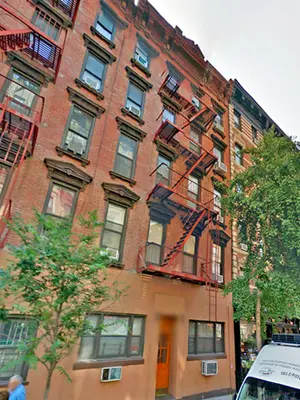
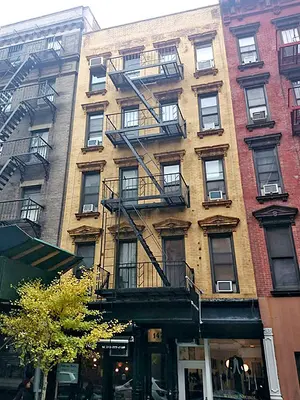
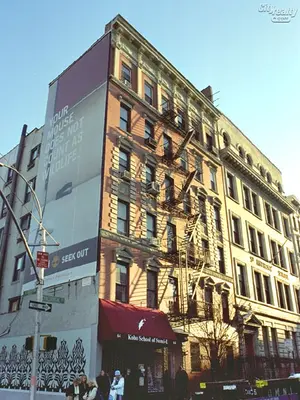
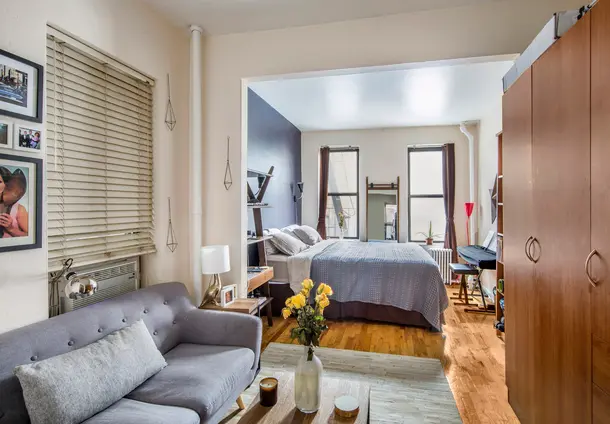
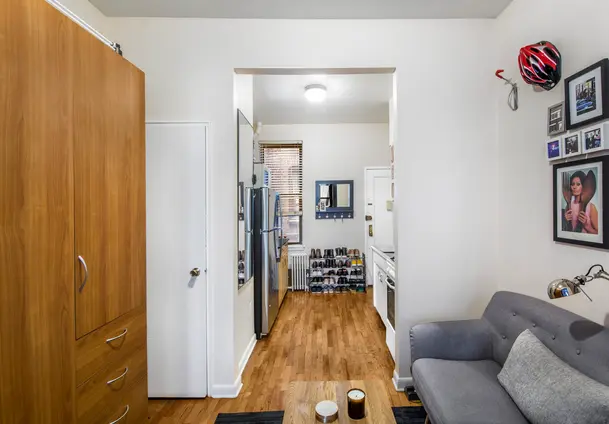
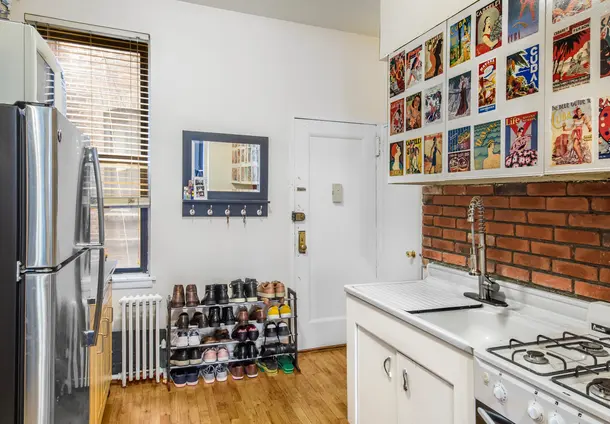
110 Thompson Street is a pre-war co-op building in downtown Manhattan's SoHo neighborhood finished in 1900. Situated on a dreamy tree-lined street between Spring Street and Prince Street, the building contains 20 units and rises 6 stories. It offers incredible access to shopping, dining, transportation, and Greenwich Village. Pets are permitted on a case-by-case basis, and the building has a liberal sublet policy.

Year Built
1900
Apartments
20
Floors
6
Neighborhood
Min Down
20%
20Apartments
View All Past
Sales & Rentals
in Building

Schedule a Visit

Select when you would like to view apartments.
Fri
18
Sat
19
Sun
20
Mon
21
Tue
22
Wed
23
Thu
24
Fri
25
Sat
26
Sun
27

What Time?

9am-noon
Noon-3pm
3pm-6pm
Any time
You can also call us anytime at
☎️ (212) 755-5544

Amenities

  • Pre War
  • Walk Up
  • Intercom

Shh... Many units sell without being publicly listed.

Limited off-market opportunities might be available at 110 Thompson Street – ideal for those looking to explore listings not currently on the market. Contact us to learn more.

{ "key" : "AIzaSyDquABdSLhathmwfnoTcYwA1BY6coZZyZk", "lat": 40.7257, "lng": -74.00169, "marker": { "icon": "https://img3.cityrealty.com/neo/i/w/amenities/base.png" } }

Nearby Subways

  1. C
  2. E
at 6th Ave and Vandam 0.11 miles
  1. N
  2. R
at Broadway 0.23 miles
  1. 1
at Varick 0.26 miles
  1. M
  2. B
  3. D
  4. F
  5. 6
at Houston 0.29 miles
  1. A
at Thompson 0.38 miles
  1. J
  2. Z
  3. Q
at Broadway 0.43 miles

Nearby Schools

  1. Chelsea Career And Technical Education High School
    Grades: 9,10,11,12
  2. NYC iSchool
    Grades: 9,10,11,12
  3. High School 560 City As School
    Grades: 9,10,11,12
  4. Ps 721 Manhattan Occupational Training Center
    Grades: 6,7,8,9,10,11,12,UG
  5. Middle 297
    Grades: 6,7,8,UG
Data courtesy of GreatSchools.org
  1. St. Anthonys School
    Grades: UG
  2. Elisabeth Irwin High School
    Grades: PK,TK,KG,1,2,3,4,5,6,7,8,9,10,11,12
  3. LREI Lower and Middle School
    Grades: PK,TK,KG,1,2,3,4,5,6,7,8,9,10,11,12
  4. Our Lady of Pompeii School
    Grades: PK,TK,KG,1,2,3,4,5,6,7,8
  5. Academy Of Saint Joseph
    Grades: PK,TK,KG,1,2,3,4,5,6,7,8
Data courtesy of GreatSchools.org
Loading...

110 Thompson Street Floorplans

Apt 5E
Studio, 1 bath, Approx. ft2
Apt 3D
Studio, 1 bath, Approx. 300 ft2
Last sold for $400,000
on May 15, 2024
View Unit History
Apt 2A
Studio, 1 bath, Approx. 325 ft2
Last sold for $525,000
on Sep 11, 2017
View Unit History
Apt 3E
1 bed, 1 bath, Approx. ft2
Last listed for $599,000
Taken off market Jan 5, 2024
View Unit History
Apt 3B
Last listed for $2,650
Taken off market Jun 23, 2021
View Unit History
Apt 1E
Last listed for $1,950
Taken off market Oct 8, 2020
View Unit History
View All Floorplans

Sales History

Price/Room (Est)

Why are we displaying the estimated price per room?

For some co-ops, instead of price per square foot, we use an estimate of the number of rooms for each sold apartment to chart price changes over time. This is because many co-op listings do not include square footage information, and this makes it challenging to calculate accurate square-foot averages.

By displaying the price per estimated room count, we are able to provide a more reliable and consistent metric for comparing sales in the building. While we hope that this gives you a clearer sense of price trends in the building, all data should be independently verified. All data provided are only estimates and should not be used to make any purchase or sale decision.

Price/Ft2 (Est)
View Full Closing History
Created with Highstock 5.0.0SalesPrice per Room (Estimated)20032004200520062007200820092010201120122013201420152016201720182019202020212022202320242025012345$50,000$100,000$150,000$200,000$250,000$300,000
Year
Avg Price / Ft2 (Est) Median Price / Ft2 (Est) Avg. Actual Price Med. Actual Price
Transactions
2025
-
-
-
-
0
2024
$1,333
$413,333
$1,333
$415,000
3
2023
$731
$450,000
$731
$450,000
2
2022
-
-
-
-
0
2021
-
$502,500
-
$502,500
2
2020
-
$622,500
-
$622,500
2
2019
-
$401,250
-
$401,250
2
2018
-
$397,000
-
$397,000
2
2017
$1,615
$440,000
$1,615
$440,000
2
2016
-
-
-
-
0
2015
-
-
-
-
0
2014
$1,188
$457,500
$1,188
$457,500
2
Year
Avg Price / Ft2 (Est) Median Price / Ft2 (Est) Avg. Actual Price Med. Actual Price
Transactions
2013
-
$365,750
$365,750
1
2012
-
-
-
-
0
2011
-
-
-
-
0
2010
-
-
-
-
0
2009
-
-
-
-
0
2008
-
-
-
-
0
2007
$1,200
$366,667
$1,200
$375,000
3
2006
$1,031
$320,000
$1,031
$320,000
2
2005
-
-
-
-
0
2004
$733
$260,000
$733
$260,000
2
2003
$631
$205,000
$631
$205,000
1
Please note that price/ft2 calculations is from only 31% of total transactions during the period
Year
Avg Price / Room (Est) Avg. Actual Price Med. Actual Price
Transactions
2025
-
-
0
2024
$165,333
$413,333
3
2023
$164,167
$450,000
2
2022
-
-
0
2021
$201,000
$502,500
2
2020
$228,167
$622,500
2
2019
$160,500
$401,250
2
2018
$158,800
$397,000
2
2017
$176,000
$440,000
2
2016
-
-
0
2015
-
-
0
2014
$152,500
$457,500
2
Year
Avg Price / Room (Est) Avg. Actual Price Med. Actual Price
Transactions
2013
$146,300
$365,750
1
2012
-
-
0
2011
-
-
0
2010
-
-
0
2009
-
-
0
2008
-
-
0
2007
$158,500
$366,667
3
2006
$128,000
$320,000
2
2005
-
-
0
2004
$88,000
$260,000
2
2003
$82,000
$205,000
1

Sales History by Apartment Size

View Full Closing History
Show:
Created with Highstock 5.0.0Price/Room200420052006200720082009201020112012201320142015201620172018201920202021202220232024$50,000$100,000$150,000$200,000

Pricing Comparison of Similar Buildings

View Detailed Comparison
Average Price per Sq. Ft.
$724,500
-
$652,050
-
$579,600
-
$507,150
-
$434,700
-
$362,250
-
$289,800
-
$217,350
-
$144,900
-
$72,450
-
$0
-
Bleecker Court
250 Mercer Street
22 Leroy Street
211 Thompson Street
185 West Houston Street
88 Bleecker Street
32 Jones Street
64 MacDougal Street
24 Cornelia Street
110 Thompson Street
349 West Broadway
 
|||


Similar Buildings

Hendrix House
at the southwest corner of East 25th Street
Gramercy Park
Manhattan homes that work. Gracefully curved condo with gorgeous amenities + home offices in every unit | 2025 occupancy
Learn More

the following is a slider of images. For screen reader users, all slides are visible at all time so you may ignore control buttons.


Before you move on from this page

Sign-up and we'll email you new listings in this building!

or
Save Building with Email
By continuing you accept the Terms & Privacy Policy