Sterling Mason, 71 Laight Street, NYC - Condo Apartments
- Apartments
- Overview & Photos
- Maps
- Floorplans
- Sales Data & Comps
- Similar Buildings
- All Units
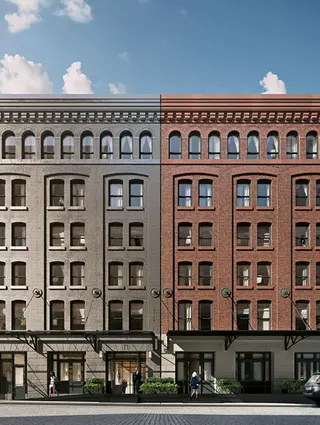
The Sterling Mason building at 71 Laight Street is one of Tribeca's most sought-after condominium loft conversions. Loved for its location, stunning design, and gorgeous interiors, the project was designed by noted architect Morris Adjmi and takes a six-story Tribeca loft building replicates the original 1906 red-brick masonry building with a new light-gray twin with concrete panels and a metallic finish.
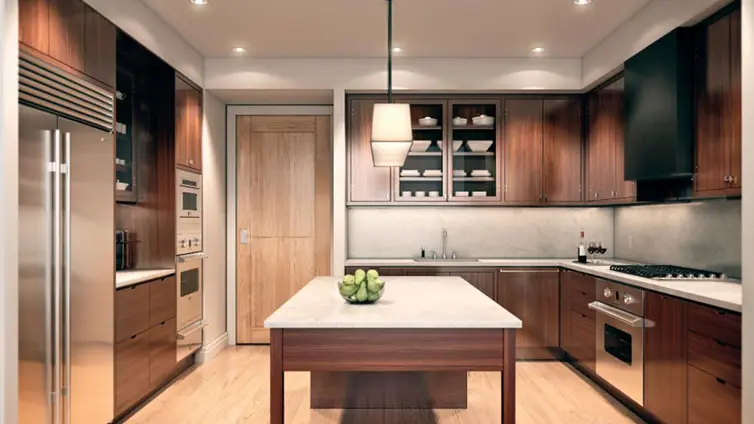
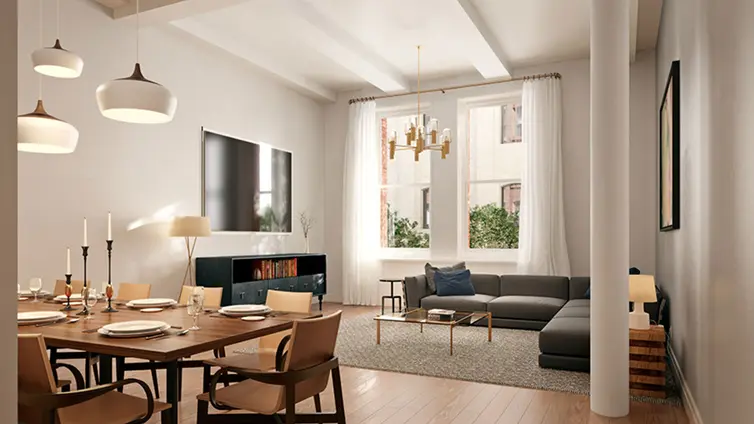
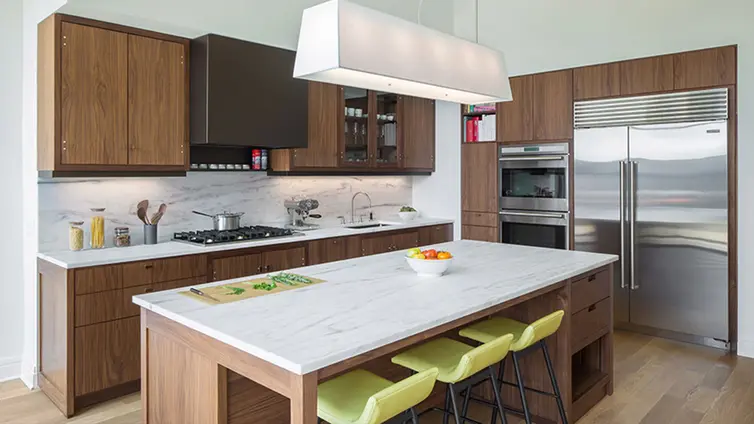
Within, Gachot Studios has blended refined finishes with soaring ceilings and other classic loft details, with bespoke finishes like Henrybuilt kitchens. A four-bedroom duplex penthouse sits at the building’s pinnacle offering 5,000 square feet of interior space and a 1,065-square-foot private terrace.
Unlike many of the neighborhood’s authentic lofts, this one is blessed with the kind of amenities you’d find in a high-rise, including a concierge, a doorman, a porter and a resident manager, a children’s play space designed in collaboration with the 92nd Street Y, a fitness center and a 12-car garage.
From La Garconne to Locanda Verde, Bubby’s and Ear Inn, the western Tribeca neighborhood, near Soho and the West Village, is a cornucopia of shopping, restaurants and waterfront enjoyment in the form of Hudson River Park, the Tribeca dog run and much more.


View school info, local attractions, transportation options & more.
Experience amazing 3D aerial maps and fly throughs.