Shh... Many units sell without being publicly listed.
Discover hidden opportunities at The Collect Pond House! Reach out today to learn about select off-market listings.
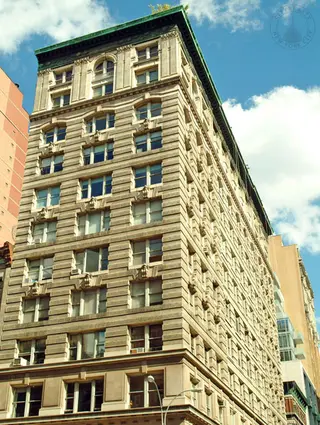

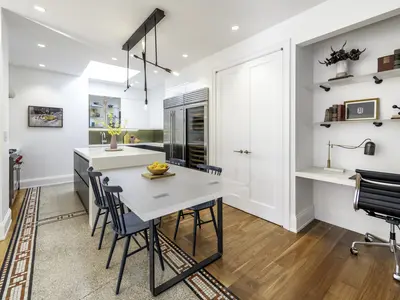
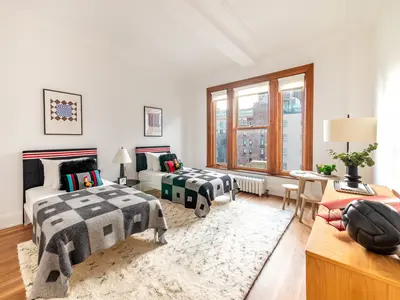

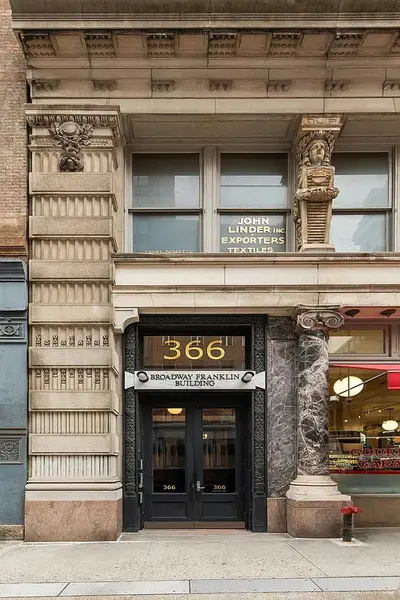
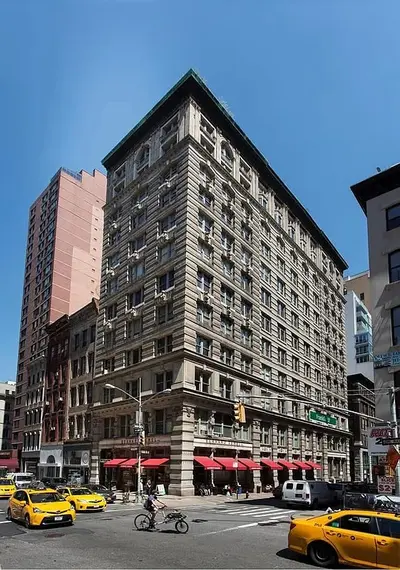
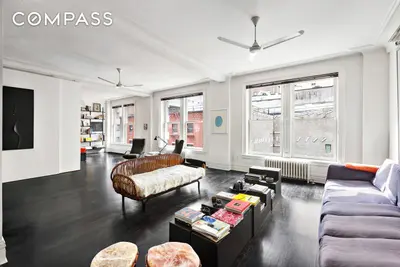

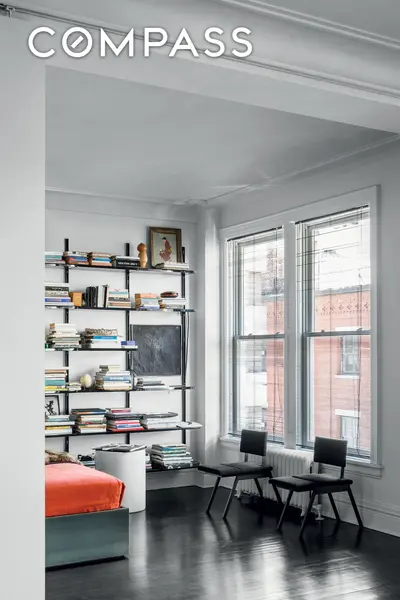
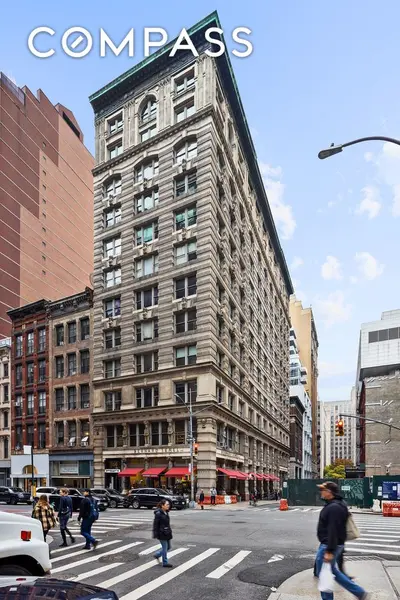
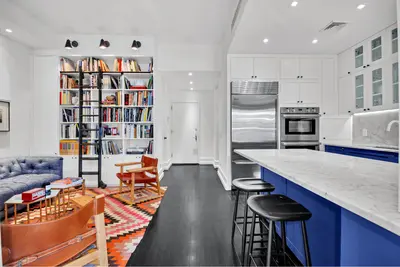
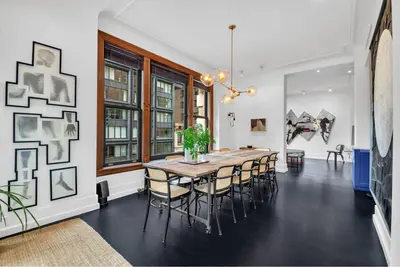
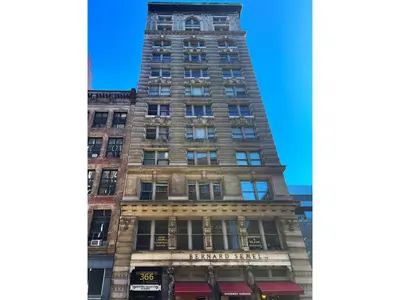
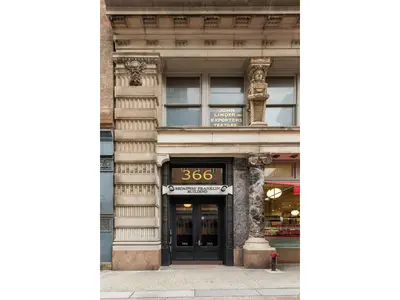
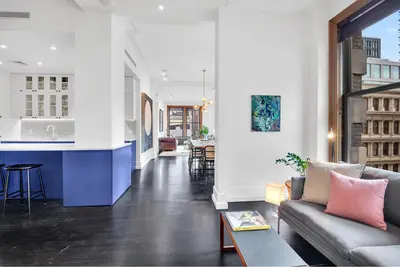
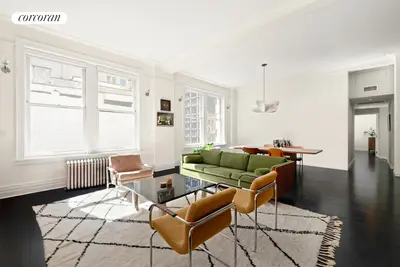
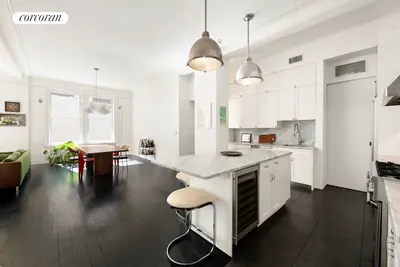
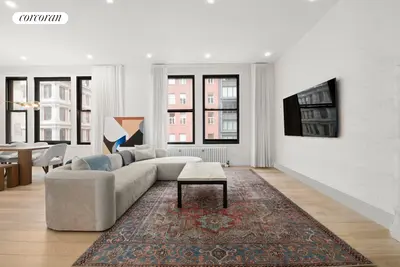
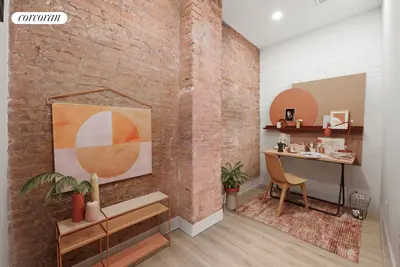
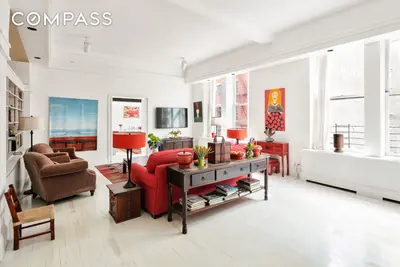
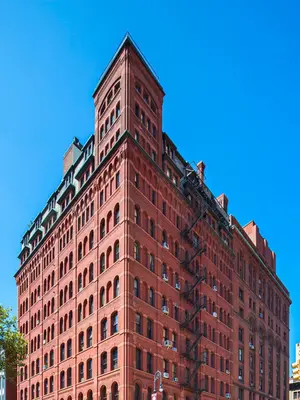
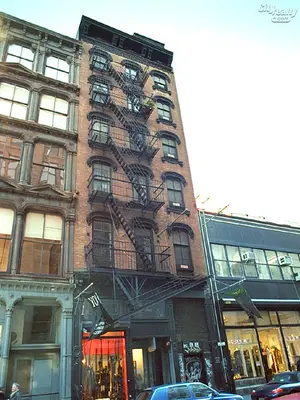
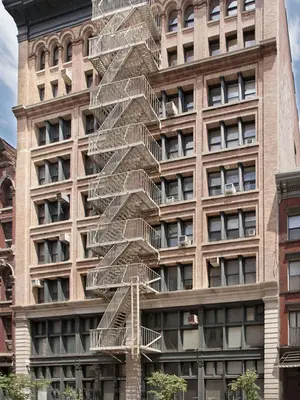
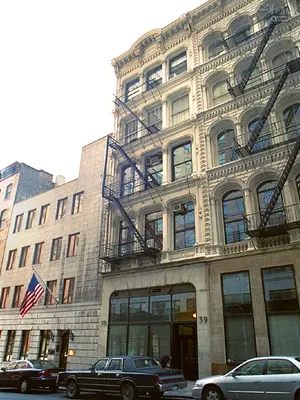
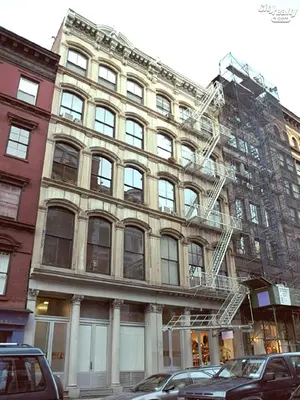
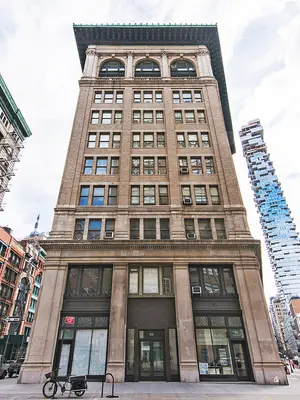
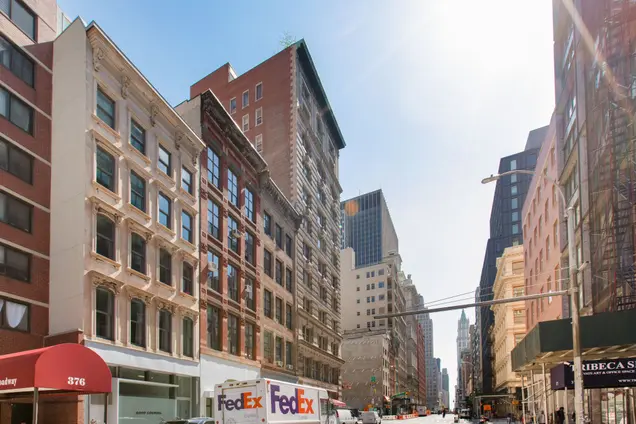
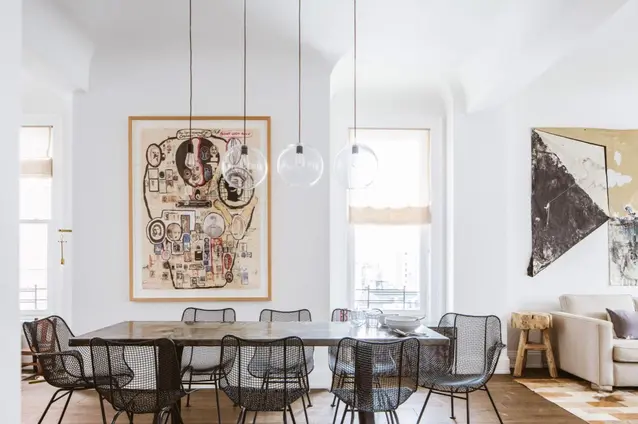
The Collect Pond House, formerly known as The Bernard Semel Building, is a historic Beaux-Arts structure located at 366 Broadway at Franklin Street in Tribeca. Originally constructed in 1907, this building has been thoughtfully converted from a commercial loft building into a residential cooperative while preserving its architectural heritage.
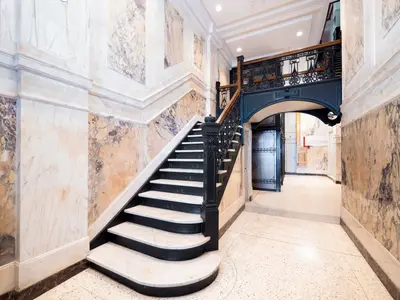
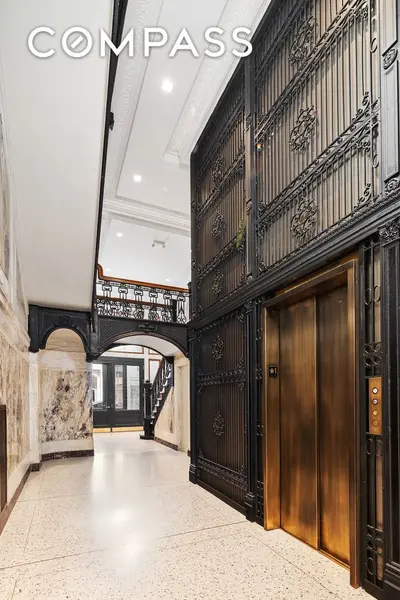
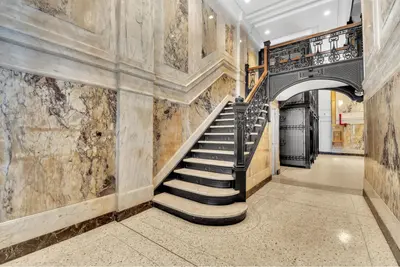
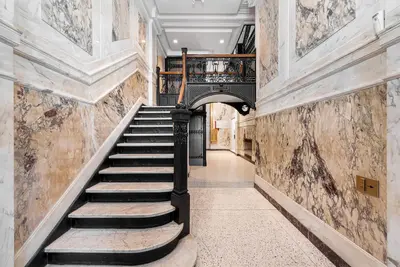
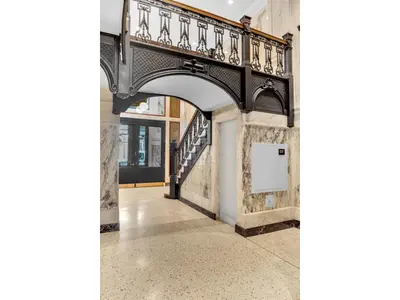
The building's distinctive Beaux-Arts character is showcased in its impressive entrance and lobby, featuring original marble steps, wrought iron railings, and floor-to-ceiling marble slab walls that have been meticulously maintained through its residential conversion.
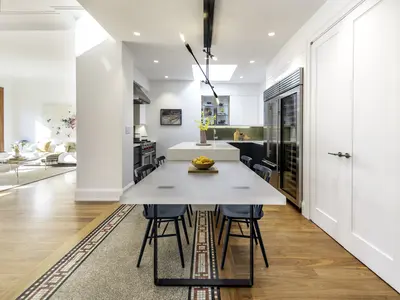
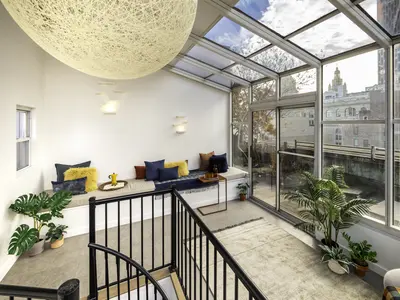
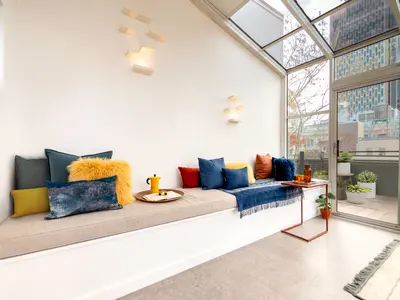
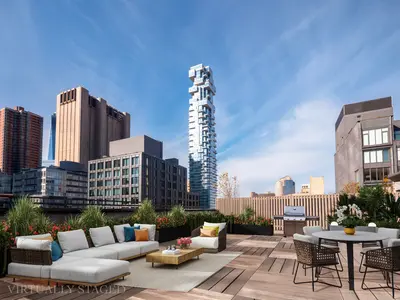
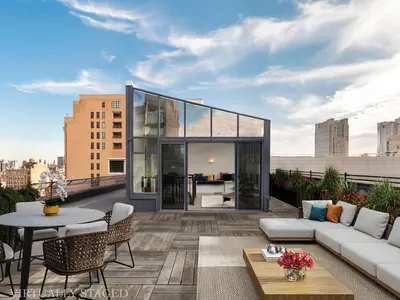
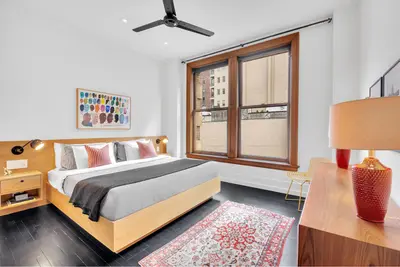
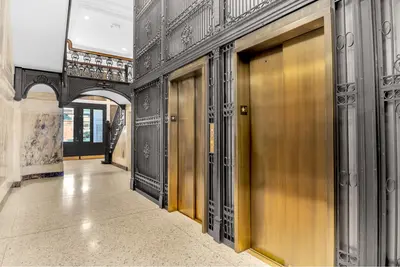
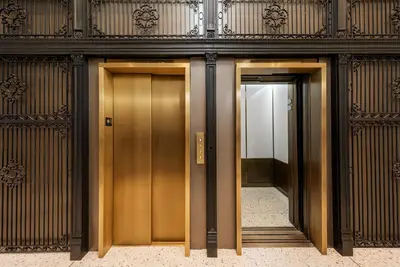
Residents benefit from modern amenities including a roof deck and resident's lounge, complemented by practical features such as new bike storage facilities and individual storage units. The building includes a dedicated package room and mail room, while recent updates have brought renovated hallways and new elevator cabs.
The cooperative maintains a full-time superintendent and part-time porter to ensure smooth operations. Security is addressed through video entry systems, and the building welcomes pets. Storage solutions are available to meet resident needs.
Situated at a strategic intersection of several notable Manhattan neighborhoods, the building provides easy access to SoHo, the Financial District, Little Italy, and the Bowery. The area remains vibrant with art galleries, fashion boutiques, and dining establishments.
The location offers exceptional public transportation connectivity, with access to multiple subway lines including the N/Q/R/W, J/Z, 4/5/6, A/C/E, and 1 trains.
Discover hidden opportunities at The Collect Pond House! Reach out today to learn about select off-market listings.

View school info, local attractions, transportation options & more.
Experience amazing 3D aerial maps and fly throughs.
For some co-ops, instead of price per square foot, we use an estimate of the number of rooms for each sold apartment to chart price changes over time. This is because many co-op listings do not include square footage information, and this makes it challenging to calculate accurate square-foot averages.
By displaying the price per estimated room count, we are able to provide a more reliable and consistent metric for comparing sales in the building. While we hope that this gives you a clearer sense of price trends in the building, all data should be independently verified. All data provided are only estimates and should not be used to make any purchase or sale decision.
|
Year
Avg Price / Ft2 (Est)
Median Price / Ft2 (Est)
Avg. Actual Price
Med. Actual Price
Transactions
2025
-
-
-
-
0
2024
$1,229
$3,500,000
$1,229
$3,500,000
1
2023
-
$4,997,500
-
$4,997,500
1
2022
$1,402
$3,437,500
$1,402
$3,437,500
2
2021
$1,135
$2,100,000
$1,135
$2,100,000
1
2020
-
-
-
-
0
2019
-
-
-
-
0
2018
$1,304
$2,731,450
$1,277
$2,712,900
4
2017
-
-
-
-
0
2016
-
-
-
-
0
2015
$1,531
$3,044,000
$1,525
$3,075,500
4
2014
$1,026
$2,474,667
$1,026
$2,600,000
3
|
Year
Avg Price / Ft2 (Est)
Median Price / Ft2 (Est)
Avg. Actual Price
Med. Actual Price
Transactions
2013
$1,087
$2,212,500
$1,087
$2,212,500
2
2012
$919
$1,720,000
$919
$1,720,000
1
2011
$970
$1,795,000
$970
$1,795,000
1
2010
-
-
-
-
0
2009
$787
$1,410,000
$787
$1,410,000
2
2008
$1,000
$2,050,000
$1,000
$2,050,000
2
2007
$907
$1,930,000
$927
$1,800,000
5
2006
$808
$2,285,000
$808
$2,285,000
1
2005
$813
$1,815,000
$813
$1,850,000
3
2004
$878
$1,625,000
$878
$1,625,000
1
2003
$548
$1,506,667
$548
$1,310,000
3
Please note that price/ft2 calculations is from only 73% of total transactions during the period
|
the following is a slider of images. For screen reader users, all slides are visible at all time so you may ignore control buttons.

Sign-up and we'll email you new listings in this building!
Whether you’re a buyer, investor, or simply curious, this report is your key to unlocking in-depth insights and analysis on .
Please confirm your details: