Shh... Many units sell without being publicly listed.
Limited off-market opportunities might be available at Cabrini Terrace – ideal for those looking to explore listings not currently on the market. Contact us to learn more.
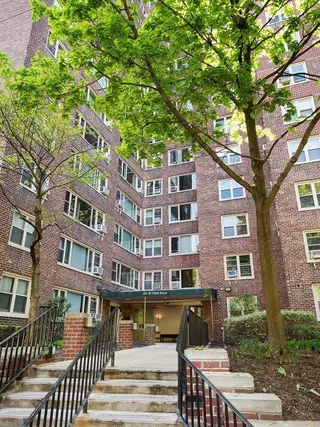
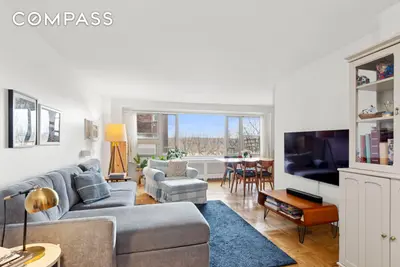
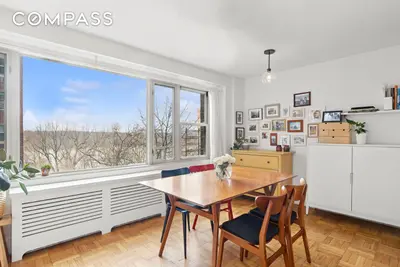
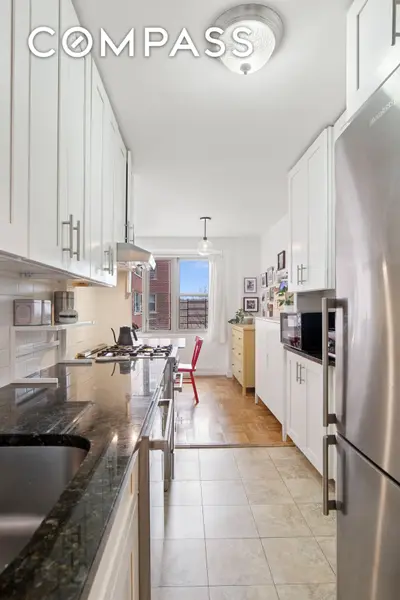
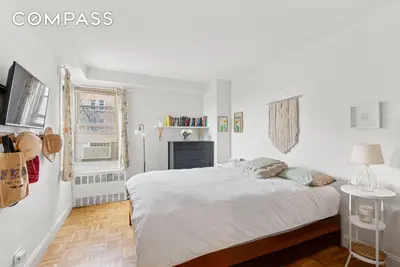
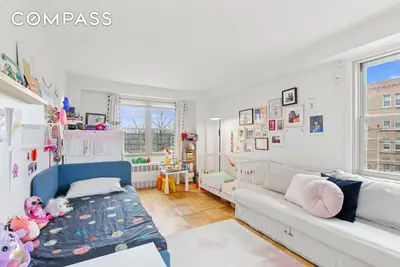
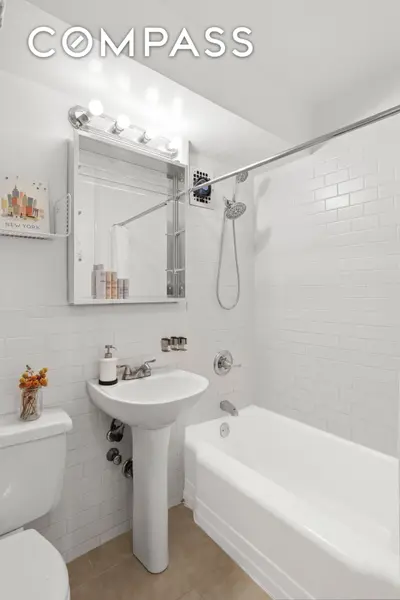

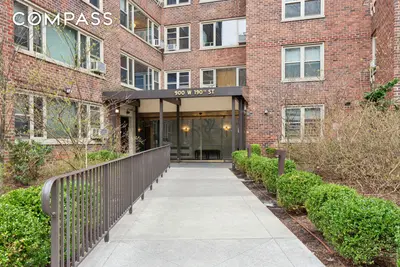
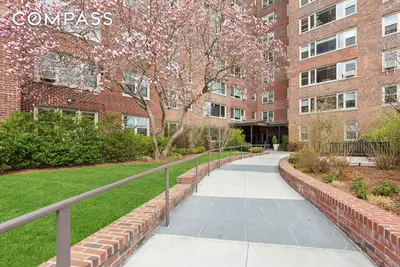

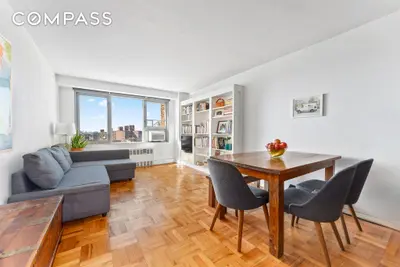
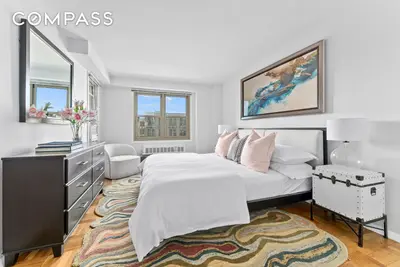
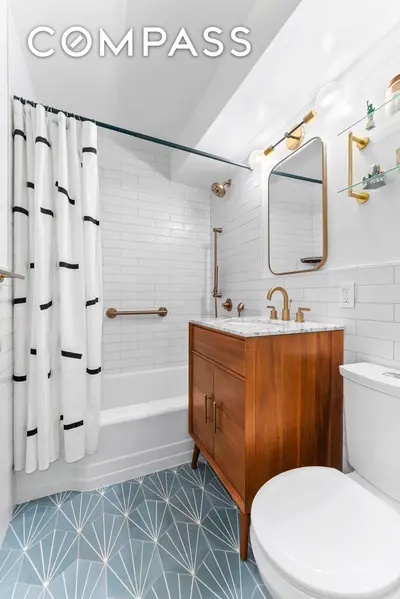
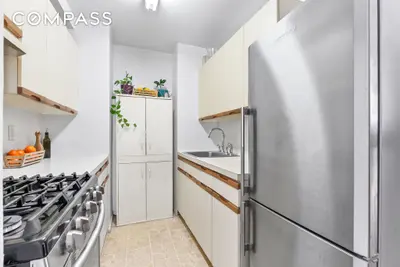

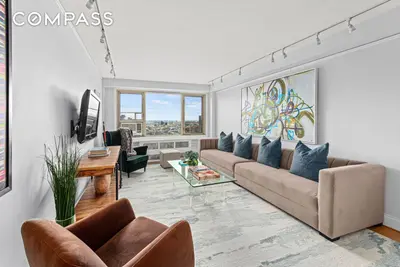
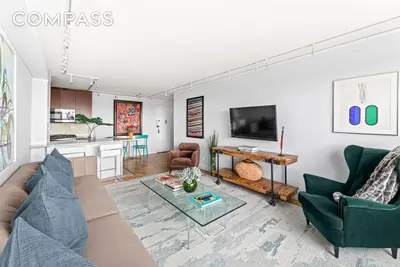
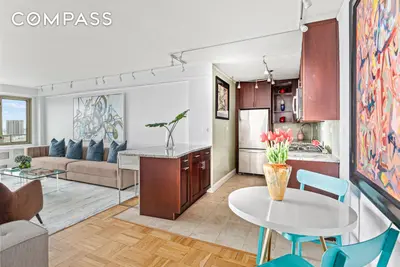
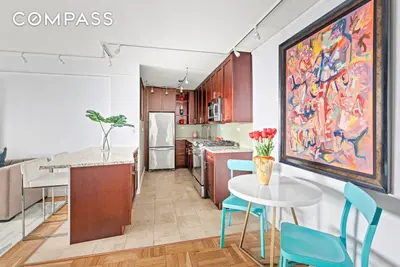
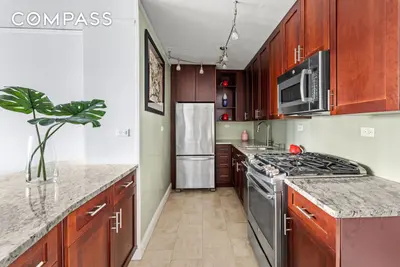
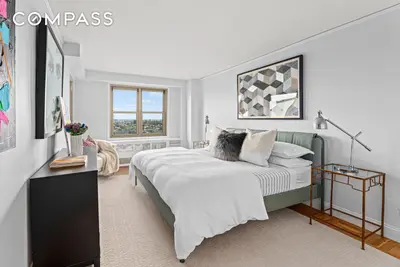
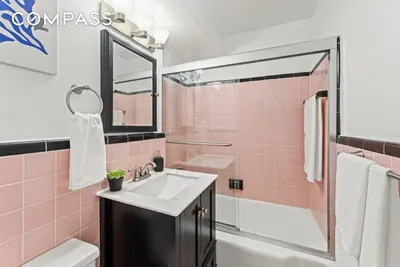
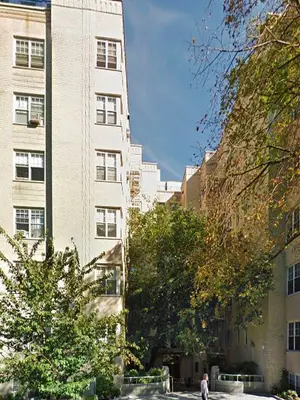
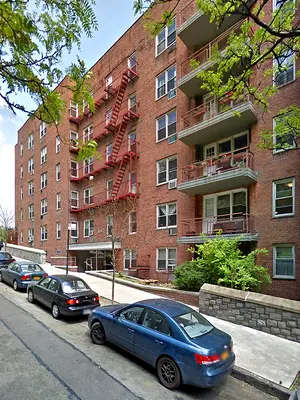
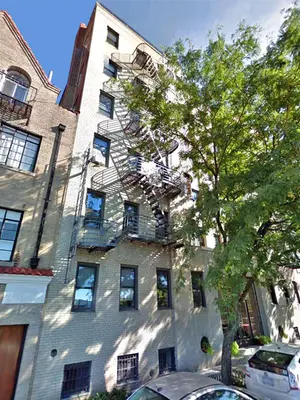
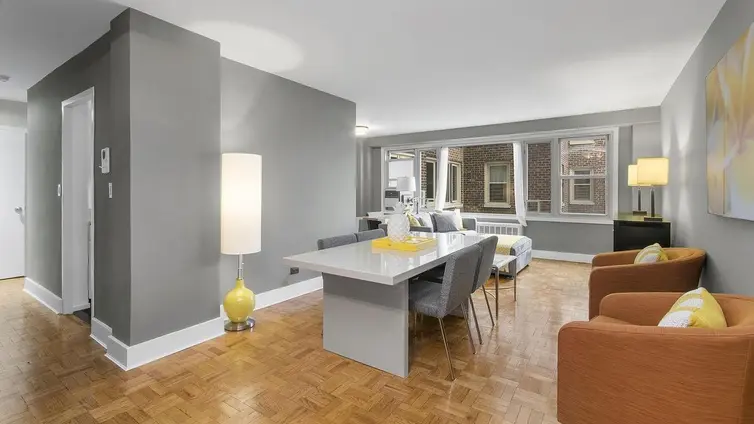
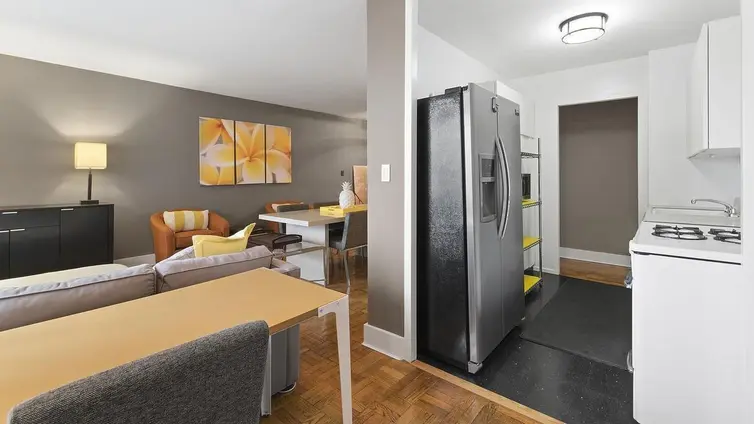
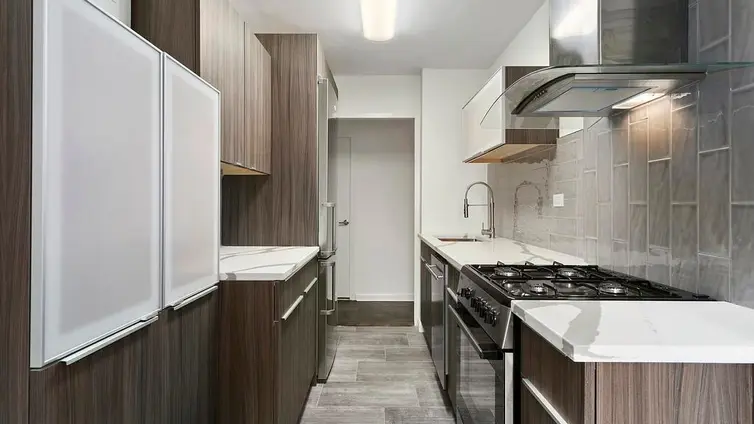
Cabrini Terrace stands out as the sole 24-hour full-service doorman cooperative in Hudson Heights, boasting some of the lowest maintenance fees in the area. Pioneering eco-friendly initiatives such as co-generation and solar panels, this building prioritizes sustainability while offering cost savings. Residents enjoy a suite of amenities including a live-in superintendent, bike storage, laundry facilities, community room, and a 24-hour attended garage. The tranquil grounds feature meticulously maintained gardens and private access, thanks to its concrete slab construction, ensuring a peaceful living environment. While cats are welcome, dogs unfortunately are not permitted.
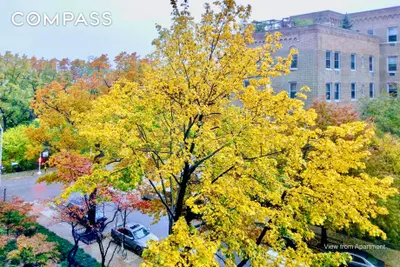
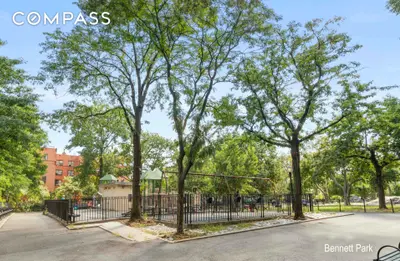
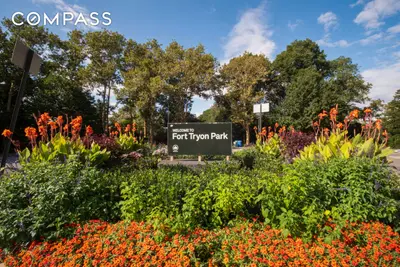
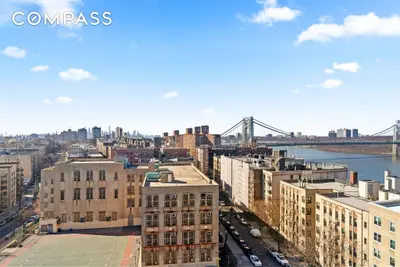
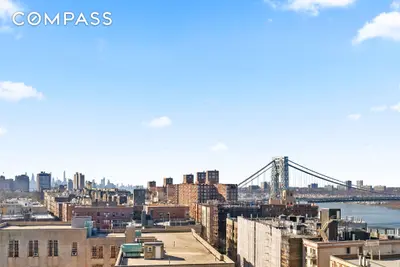
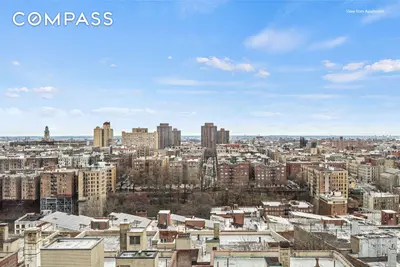
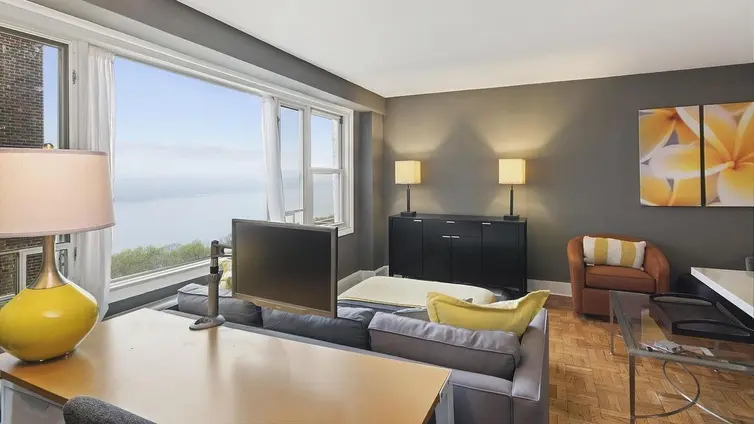
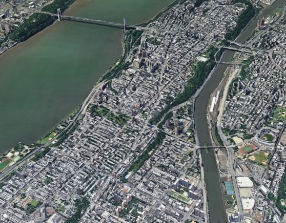
Situated in the vibrant Hudson Heights neighborhood, with easy access to the express A-train and Fort Tryon Park, residents have access to cultural landmarks like the Met Cloisters and the serene Heather Gardens. Nearby attractions such as the newly renovated Jacob Javits playground and Bennett Park provide recreational opportunities for all ages, complemented by a variety of shops and restaurants on 187th Street, including Tampopo Kitchen and Dutch Baby Bakery, as well as neighborhood favorites like Refried Beans & Kismat, grocery stores, and Hilltop Pharmacy.


Limited off-market opportunities might be available at Cabrini Terrace – ideal for those looking to explore listings not currently on the market. Contact us to learn more.
View school info, local attractions, transportation options & more.
Experience amazing 3D aerial maps and fly throughs.
For some co-ops, instead of price per square foot, we use an estimate of the number of rooms for each sold apartment to chart price changes over time. This is because many co-op listings do not include square footage information, and this makes it challenging to calculate accurate square-foot averages.
By displaying the price per estimated room count, we are able to provide a more reliable and consistent metric for comparing sales in the building. While we hope that this gives you a clearer sense of price trends in the building, all data should be independently verified. All data provided are only estimates and should not be used to make any purchase or sale decision.
|
Year
Avg Price / Ft2 (Est)
Median Price / Ft2 (Est)
Avg. Actual Price
Med. Actual Price
Transactions
2025
-
$650,000
-
$650,000
2
2024
$819
$594,000
$833
$525,000
5
2023
$814
$893,000
$814
$999,000
5
2022
$868
$745,375
$876
$767,000
8
2021
$813
$679,960
$799
$667,000
10
2020
$777
$542,500
$777
$540,000
3
2019
$887
$1,092,202
$880
$800,500
12
2018
$788
$759,286
$772
$785,000
7
2017
$884
$786,750
$908
$840,000
8
2016
$711
$746,222
$712
$690,000
9
2015
$664
$595,079
$668
$605,000
14
2014
$567
$458,262
$586
$440,435
15
|
Year
Avg Price / Ft2 (Est)
Median Price / Ft2 (Est)
Avg. Actual Price
Med. Actual Price
Transactions
2013
$614
$535,050
$627
$575,000
10
2012
$511
$453,689
$484
$500,000
9
2011
$509
$434,432
$506
$350,000
11
2010
$470
$468,438
$457
$411,250
8
2009
$545
$440,500
$533
$400,000
8
2008
$531
$498,773
$526
$499,000
11
2007
$499
$534,389
$512
$482,000
9
2006
$511
$464,158
$490
$415,000
19
2005
$546
$475,000
$548
$470,000
13
2004
$401
$364,889
$399
$340,000
18
2003
$358
$363,950
$352
$376,750
10
Please note that price/ft2 calculations is from only 54% of total transactions during the period
|
the following is a slider of images. For screen reader users, all slides are visible at all time so you may ignore control buttons.


Sign-up and we'll email you new listings in this building!
Whether you’re a buyer, investor, or simply curious, this report is your key to unlocking in-depth insights and analysis on .
Please confirm your details: