Shh... Many units sell without being publicly listed.
Looking for something special? Select off-market options at 130 Barrow Street may be available – connect with us for access.
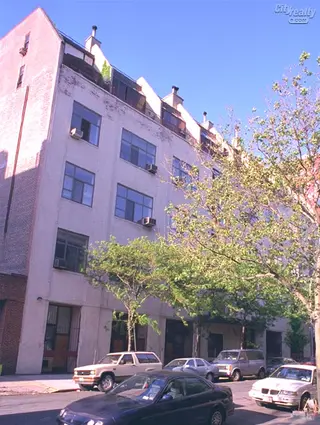
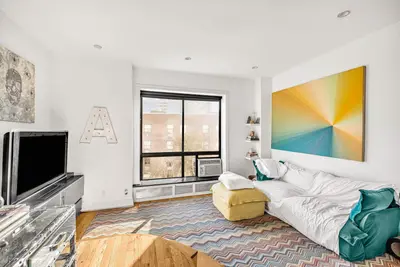
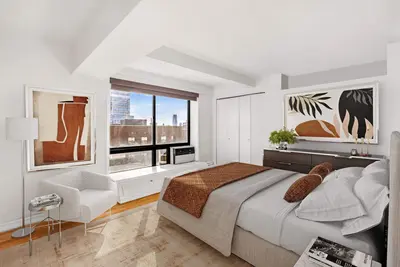
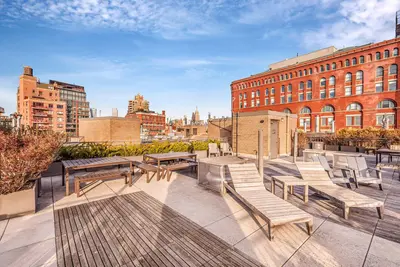
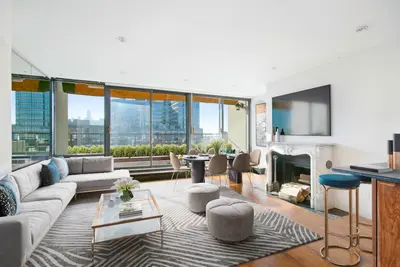
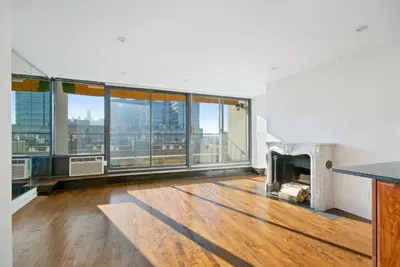
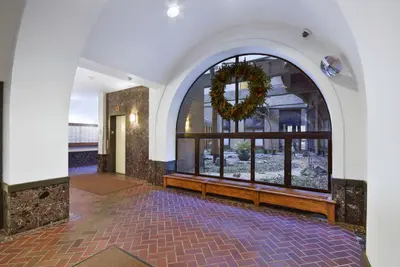
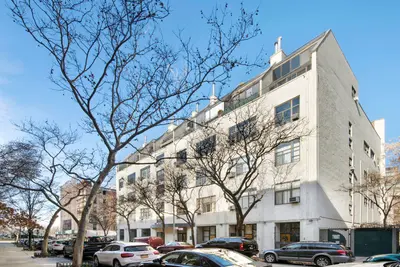
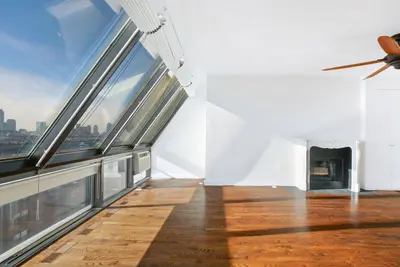
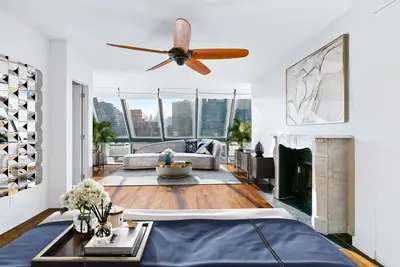
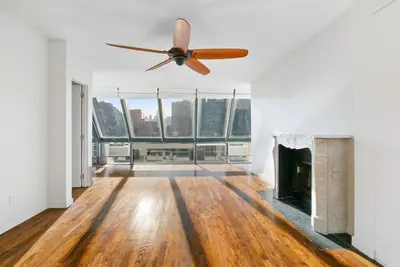
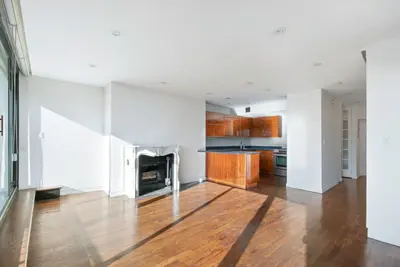
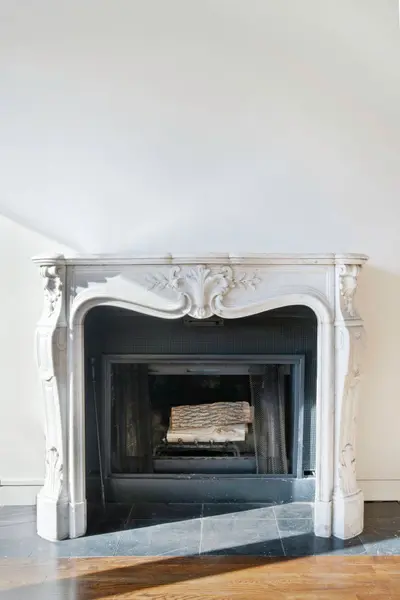
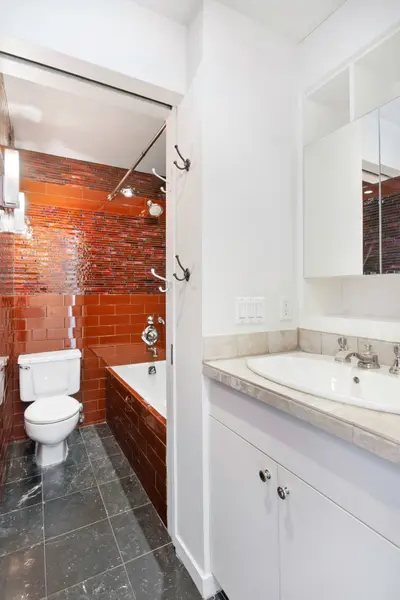
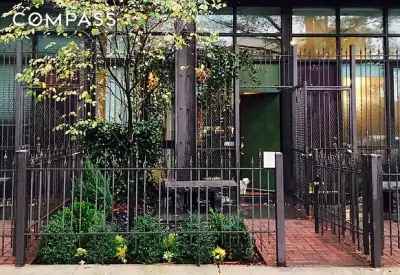
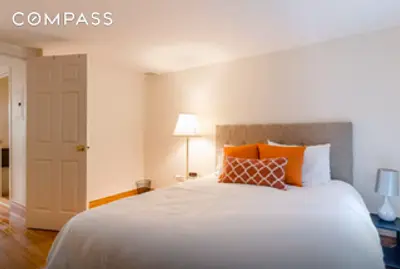
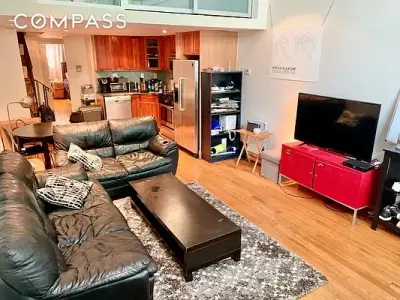
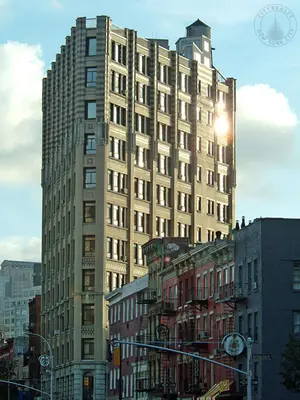
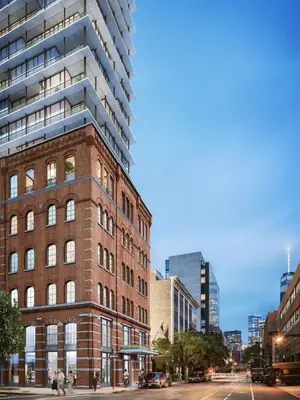
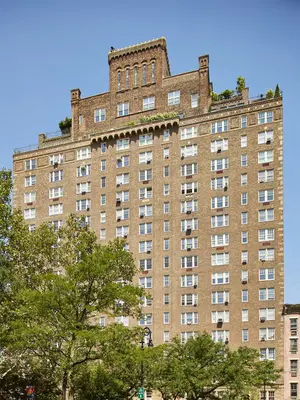
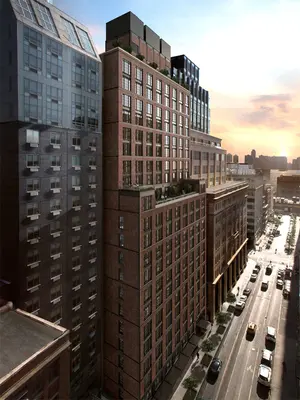
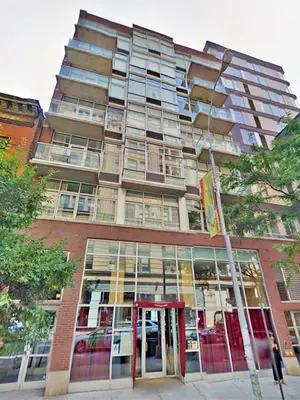
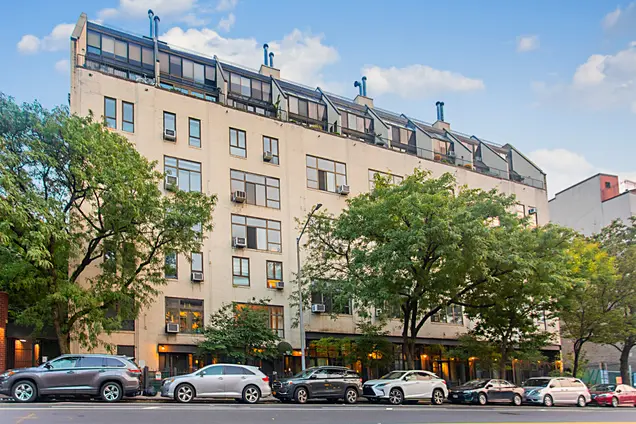
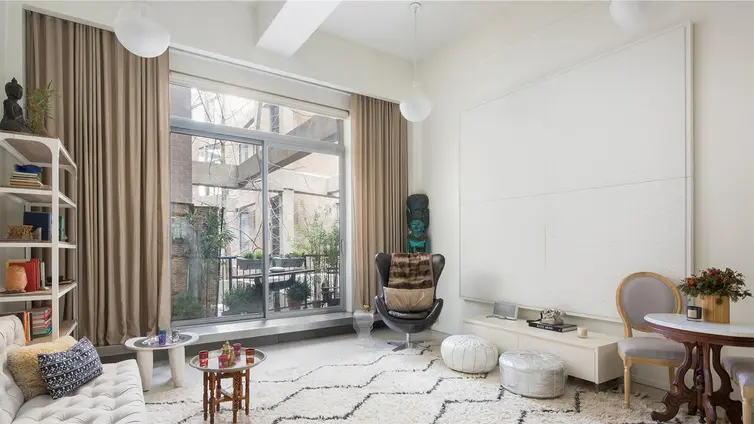
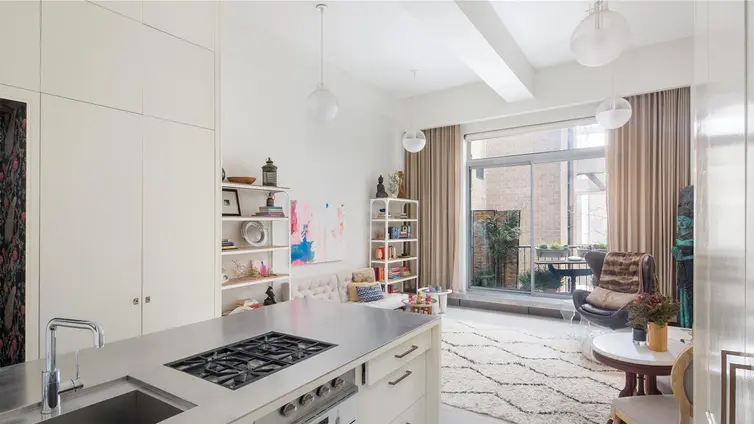
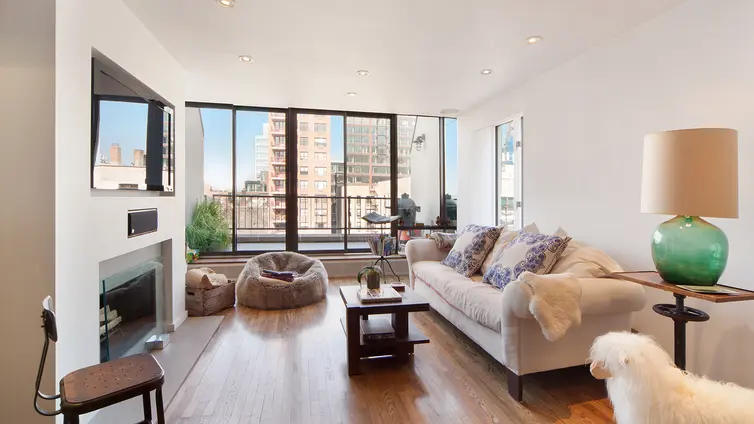
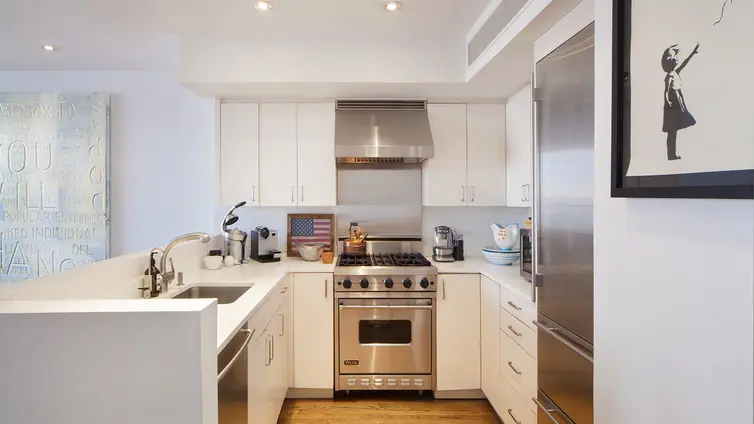
130 Barrow Street was constructed as a truck garage in 1931 and converted to a six-story, 84-unit condominium in 1983, an endeavor that garnered it the Grand Award from the National Association of Homebuilders; Builders Choice: and the Certificate of Modernization Excellence from Builders Magazine. It is located on a picturesque West Village street near the Hudson River.
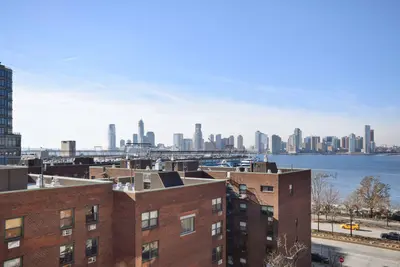
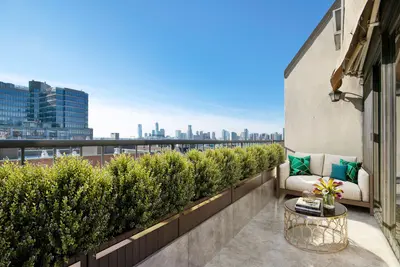
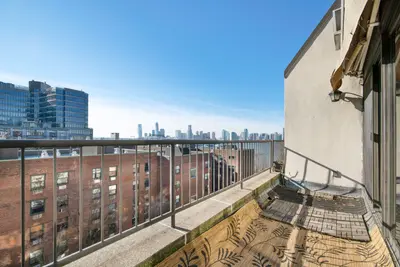
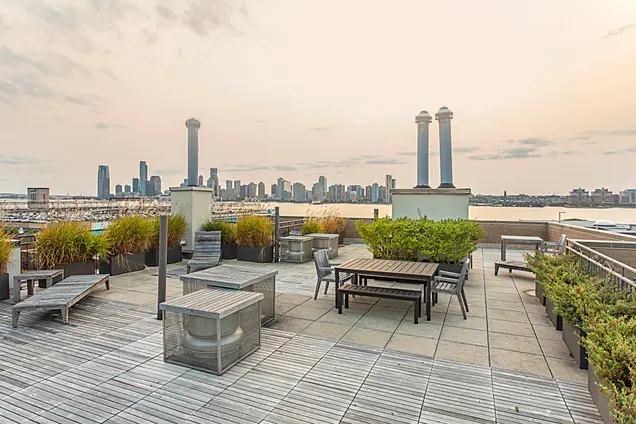
The building has a live-in superintendent, a daily porter on staff, glass-windowed elevators, garden courtyard, professionally landscaped and furnished roof deck with panoramic views, and amazing West Village location moments from the Hudson River Park, High Line, Meatpacking District, and hundreds of boutiques, eateries and more. Public transportation options include the Christopher Street 1 train, the West 4th Street A/C/E and B/D/F/M trains, and the PATH.
Looking for something special? Select off-market options at 130 Barrow Street may be available – connect with us for access.

View school info, local attractions, transportation options & more.
Experience amazing 3D aerial maps and fly throughs.
|
Year
Avg Price / Ft2 (Est)
Median Price / Ft2 (Est)
Avg. Actual Price
Med. Actual Price
Transactions
2025
$2,539
$2,800,000
$2,539
$2,800,000
1
2024
$1,819
$1,375,000
$1,819
$1,375,000
1
2023
-
$1,605,000
-
$1,605,000
1
2022
$1,658
$1,689,229
$1,634
$1,624,600
7
2021
$2,129
$2,159,000
$2,168
$2,242,000
3
2020
$1,912
$1,850,000
$2,065
$1,625,000
3
2019
$1,574
$1,626,250
$1,538
$1,665,000
6
2018
$1,522
$1,706,250
$1,605
$1,612,500
4
2017
$1,899
$1,492,004
$1,900
$1,300,020
5
2016
$1,665
$1,727,517
$1,758
$1,443,000
6
2015
$1,393
$1,313,604
$1,598
$1,515,000
6
2014
$1,407
$1,363,333
$1,618
$1,225,000
3
|
Year
Avg Price / Ft2 (Est)
Median Price / Ft2 (Est)
Avg. Actual Price
Med. Actual Price
Transactions
2013
$1,354
$1,193,563
$1,302
$1,087,500
8
2012
$1,396
$1,246,778
$1,407
$1,190,000
9
2011
$1,112
$1,078,125
$983
$868,750
4
2010
$986
$865,000
$986
$865,000
2
2009
-
-
-
-
0
2008
$1,154
$1,185,200
$1,101
$1,050,000
5
2007
$1,243
$1,142,143
$1,283
$1,110,000
7
2006
$1,123
$1,206,250
$1,131
$1,237,500
4
2005
$1,237
$1,342,500
$1,294
$1,295,000
6
2004
$869
$854,250
$726
$909,500
6
2003
$915
$814,500
$938
$785,500
4
|
the following is a slider of images. For screen reader users, all slides are visible at all time so you may ignore control buttons.
Sign-up and we'll email you new listings in this building!
Whether you’re a buyer, investor, or simply curious, this report is your key to unlocking in-depth insights and analysis on .
Please confirm your details: