Claiborne House, 444 East 84th Street - Yorkville
- Apartments
- Overview & Photos
- Maps
- Floorplans
- Sales Data & Comps
- Similar Buildings
- All Units
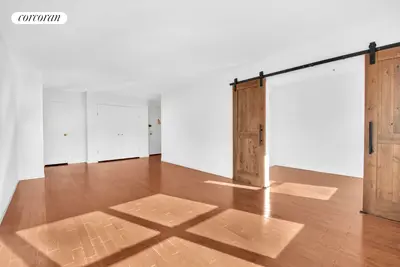
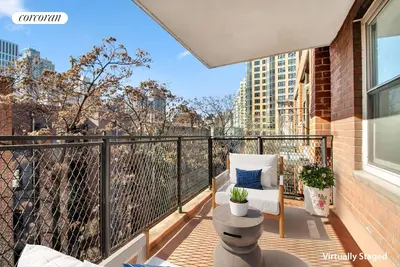
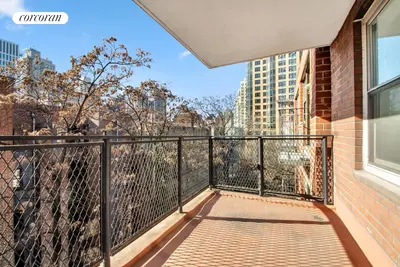
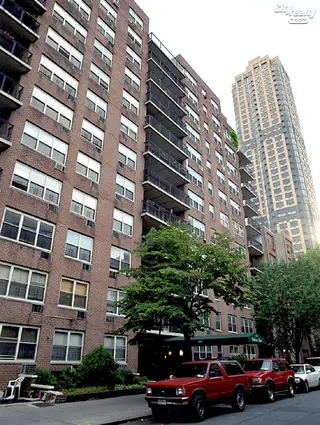
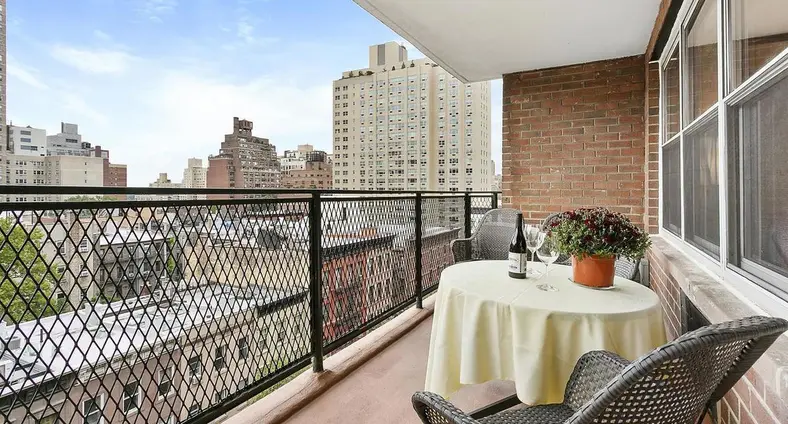
Claiborne House at 444 East 84th Street is a distinguished red brick, 11 story cooperative in Yorkville that has been a fixture of the Upper East Side since 1963. Originally constructed as a rental building, it was converted to a 94 unit co-op in 1985 and has maintained its reputation as a well run, financially sound building. The handsome structure features consistent fenestration, impressive balconies, and discrete air conditioners, along with a canopied entrance and sidewalk landscaping that enhances its tree lined block.
The building offers full service amenities including 24 hour doormen, a concierge, and a live-in superintendent. Residents enjoy access to a private parking garage exclusively for building residents (though there's typically a waitlist), bike storage, updated laundry facilities, and a unique lending library. The renovated lobby and hallways reflect the building's commitment to maintaining high standards, though notably it lacks a health club or roof deck.
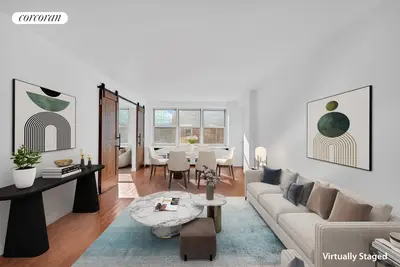
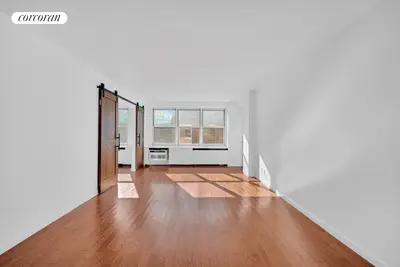
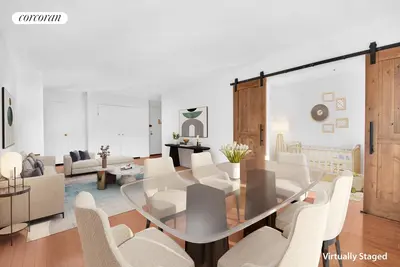
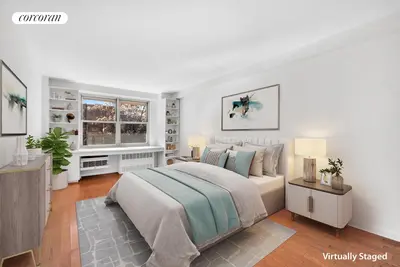
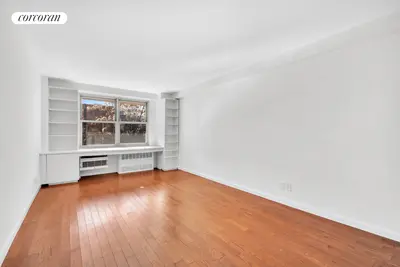
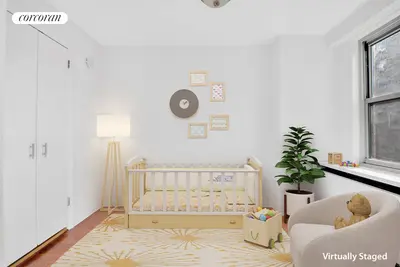
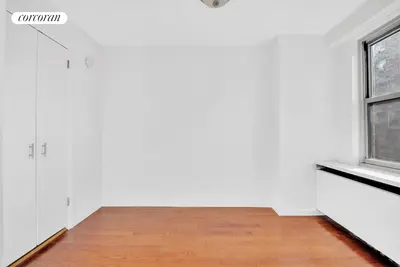
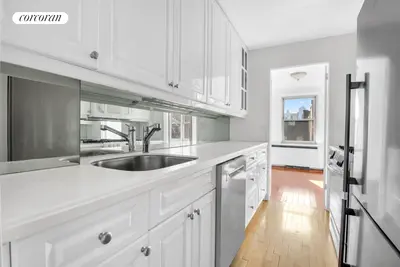
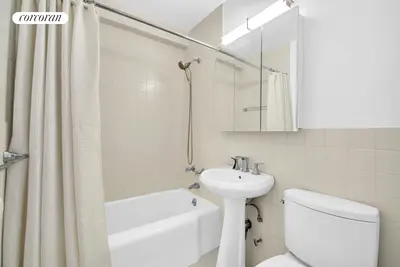
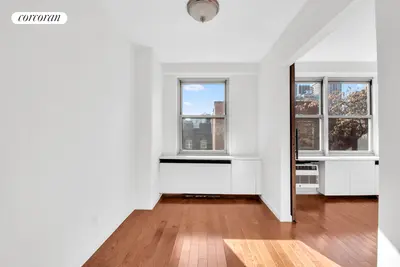
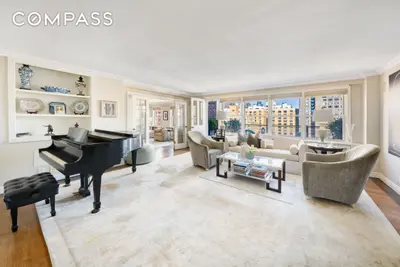
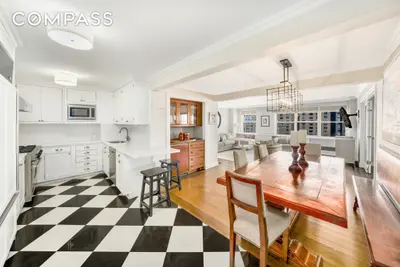
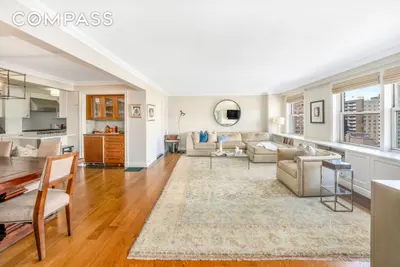
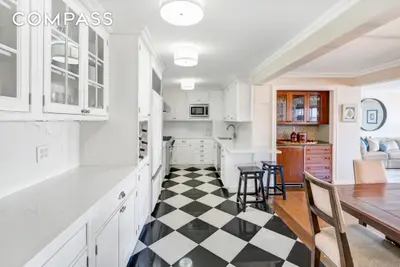
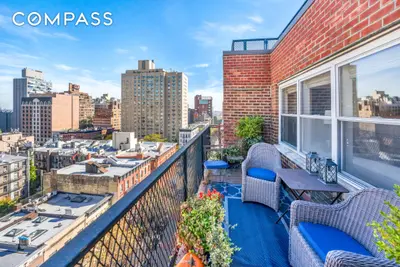
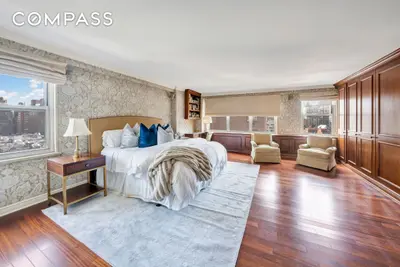
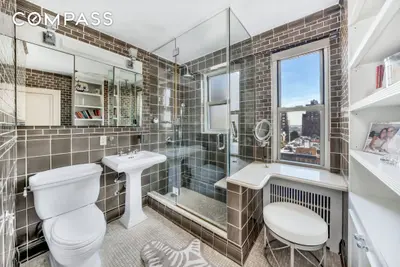
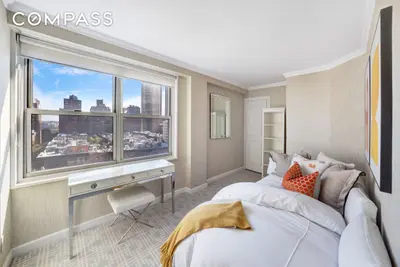
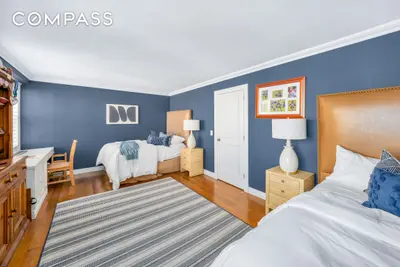
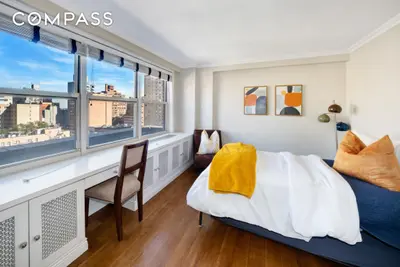
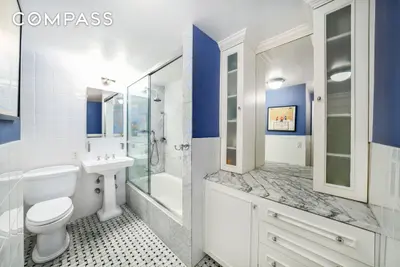
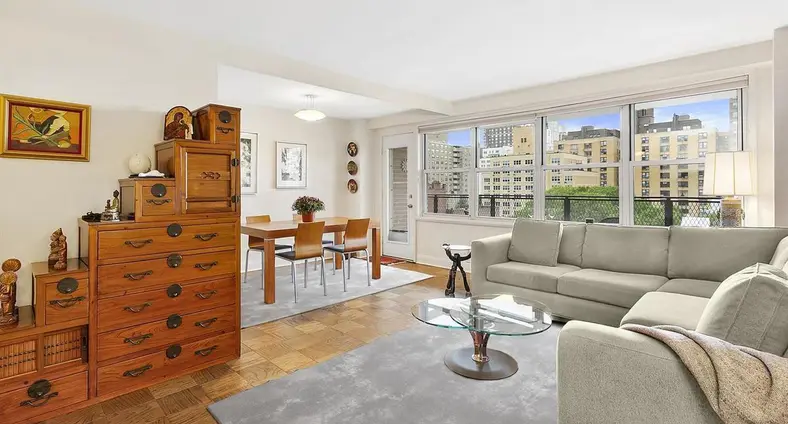
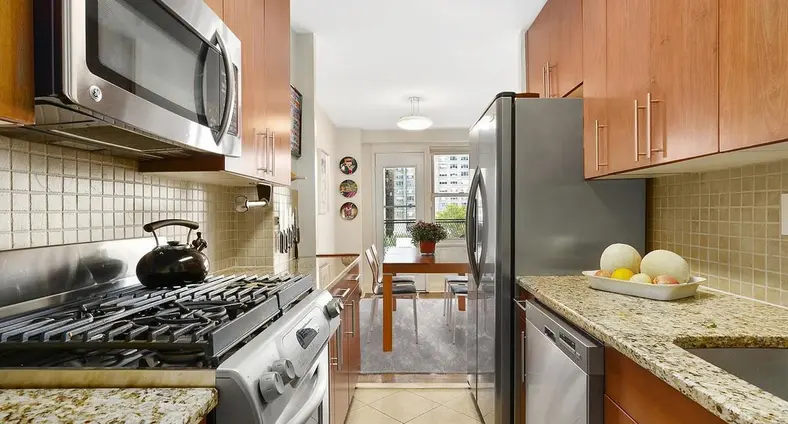
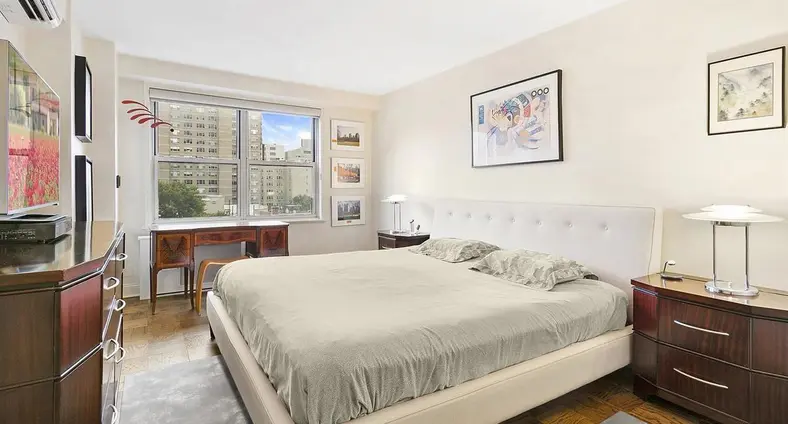
Apartments at Claiborne House typically feature hardwood floors, generous closet space including walk-in closets, and in-unit laundry. Many units boast private balconies or terraces, particularly those with southern exposures that flood the spaces with natural light. The building offers a range of layouts from one bedroom units to expansive four bedroom residences, with many featuring split bedroom configurations for privacy. Common apartment amenities include updated kitchens with stainless steel appliances, through the wall air conditioning, and protected views of the surrounding neighborhood.
The location proves ideal for those seeking proximity to Carl Schurz Park and the East River, just a block and a half away. Transportation is convenient with the Second Avenue subway two blocks away and excellent cross town bus service on 79th Street, plus easy access to the FDR Drive. The neighborhood offers abundant shopping at Whole Foods, Fairway, and Morton Williams, along with numerous dining options. The building maintains a pet friendly policy but does not permit pied-à-terre ownership, and allows co-purchasing and gifting with 75% financing available.

View school info, local attractions, transportation options & more.
Experience amazing 3D aerial maps and fly throughs.
For some co-ops, instead of price per square foot, we use an estimate of the number of rooms for each sold apartment to chart price changes over time. This is because many co-op listings do not include square footage information, and this makes it challenging to calculate accurate square-foot averages.
By displaying the price per estimated room count, we are able to provide a more reliable and consistent metric for comparing sales in the building. While we hope that this gives you a clearer sense of price trends in the building, all data should be independently verified. All data provided are only estimates and should not be used to make any purchase or sale decision.