Shh... Many units sell without being publicly listed.
Interested in off-market listings at The Bolivar? Some previously listed residences might be available – contact us for insider details on potential opportunities!
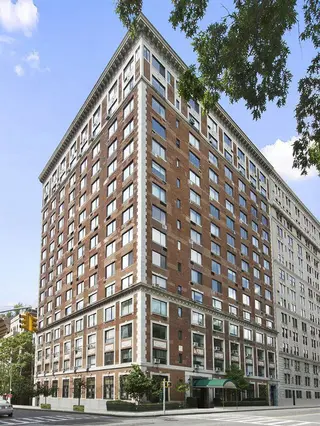
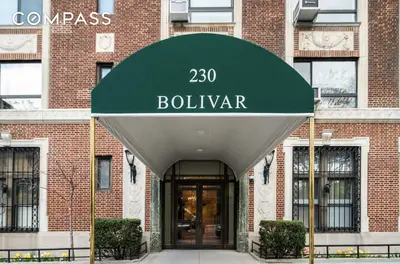
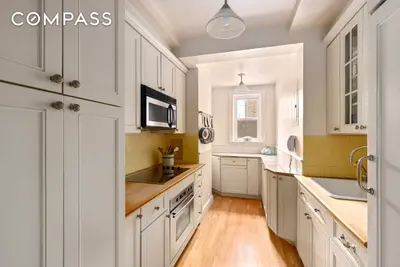
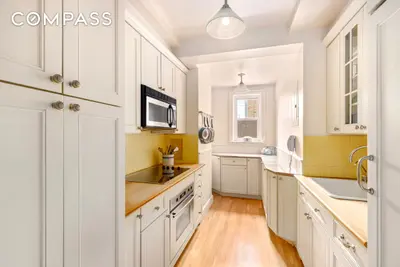
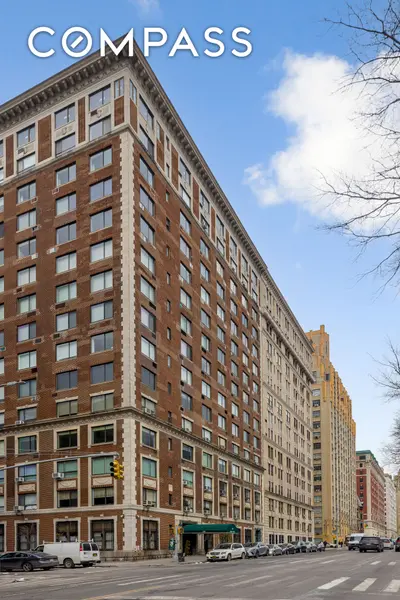
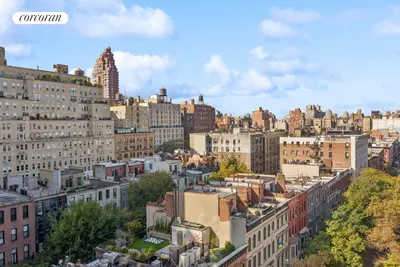


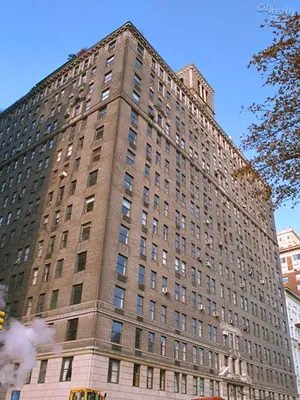
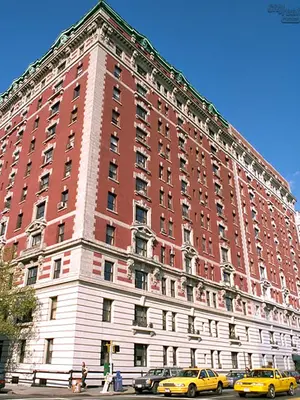
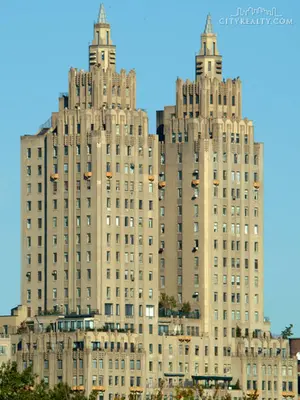
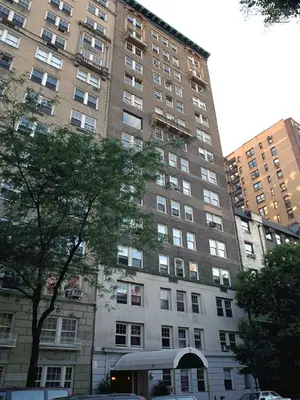
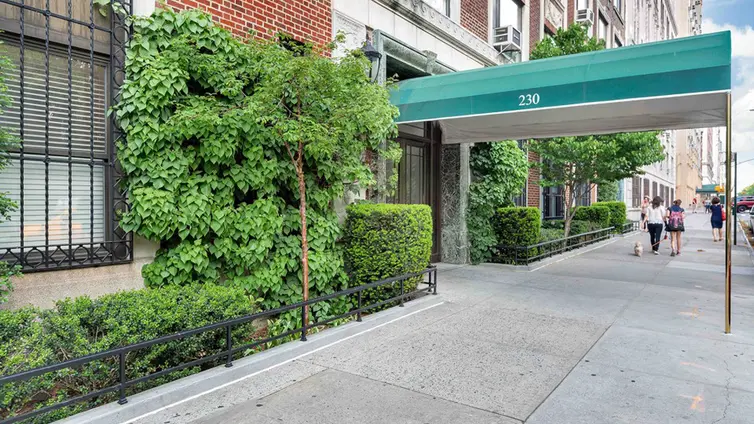
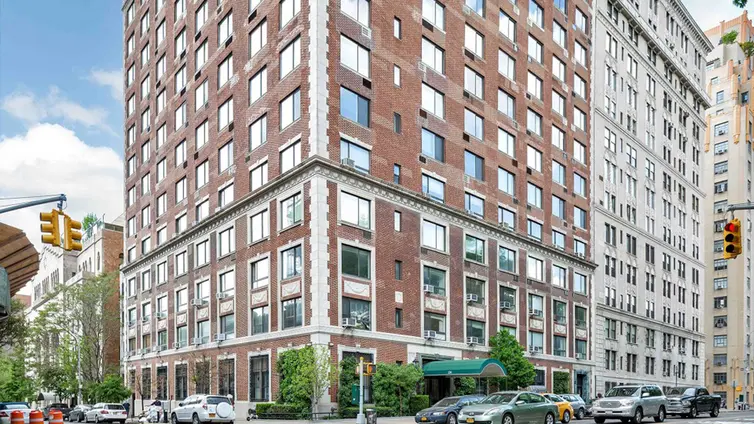
The Bolivar, a distinguished Neo-Georgian building at 230 Central Park West and 83rd Street, was designed by Nathan Korn and constructed in 1926. The 15-story cooperative building, which was converted in 1984, houses 156 apartments and features handsome red-brick construction with distinctive terra-cotta trim, quoins, and decorative window surrounds on its lower three and top two floors.
The building's name commemorates an equestrian statue of Simon Bolivar that was unveiled at Summit Rock in Central Park by President Harding in 1921. The statue has since been relocated to Central Park South and Sixth Avenue. The site was previously occupied by two seven-story apartment buildings.
Notable residents have included comedian Jerry Seinfeld, who lived in a two-bedroom apartment from 1990 to 2006, and Joseph Ravitch, president of Ravitch Brothers Construction Corporation, which was involved in building the nearby Beresford and San Remo apartments.
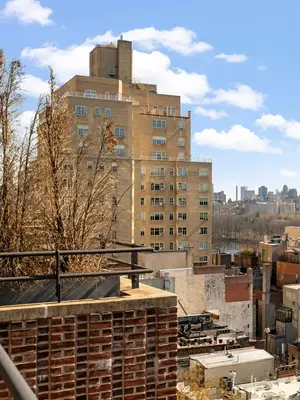
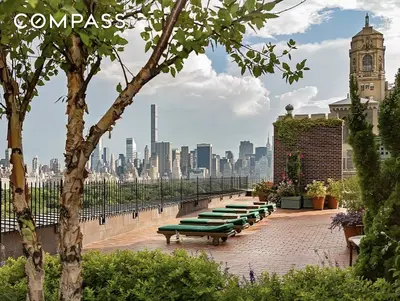
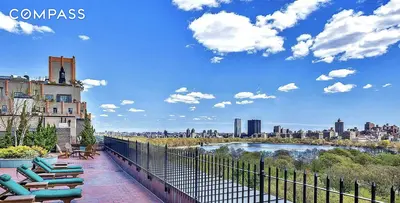
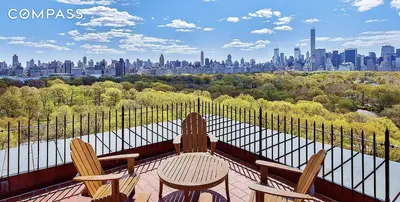
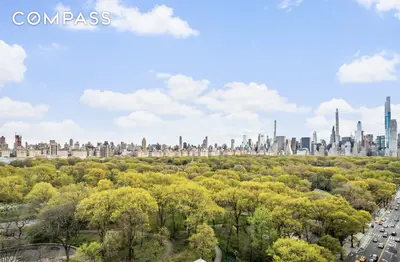
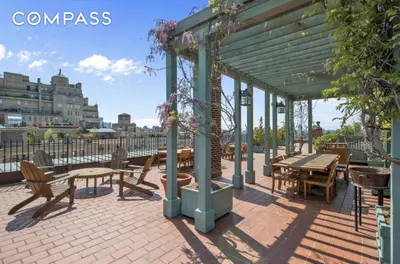
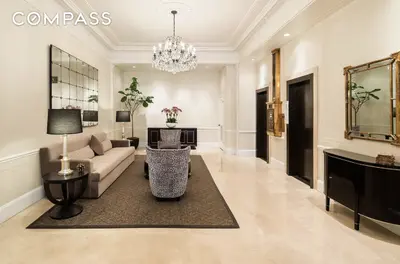
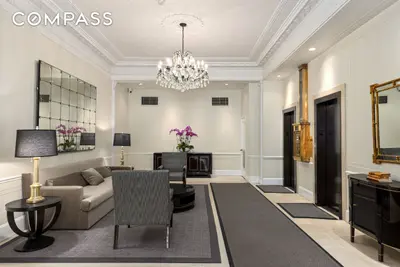
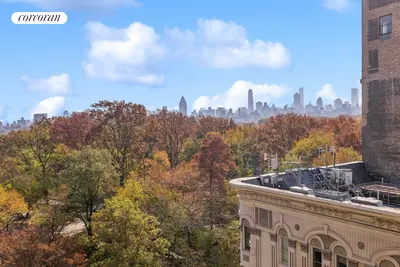
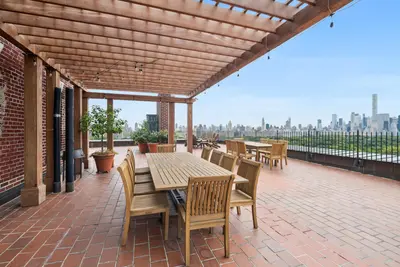
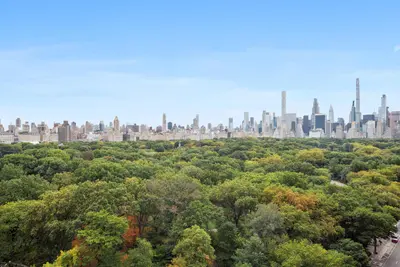
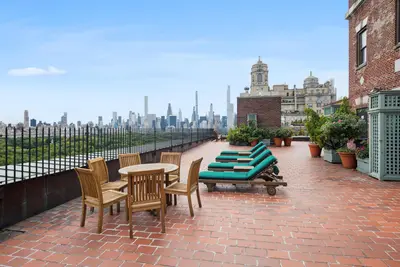
The Bolivar offers a full-service experience with 24-hour doorman, concierge service, and a live-in superintendent. Its crown jewel is a spectacular 10,000-square-foot landscaped roof deck offering panoramic views of Central Park and the city skyline. Additional amenities include a community room (formerly a ballroom), bicycle storage, private storage, and refrigerated storage for food deliveries.
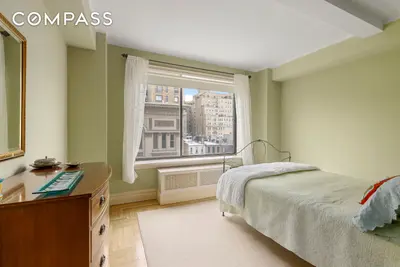
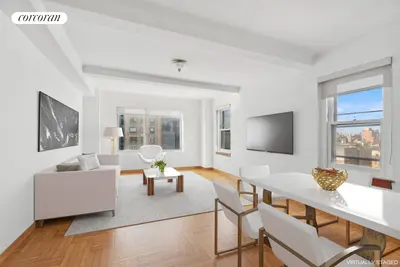
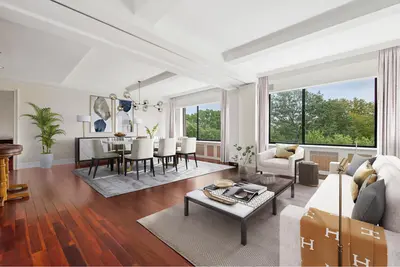
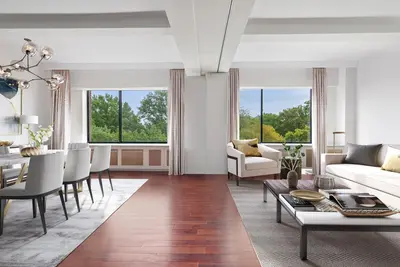
Apartments feature varying layouts, from studios to large combinations, many offering Central Park views. The building permits up to 75% financing and welcomes both pets and pied-à-terres with board approval. The cooperative maintains relatively low monthly maintenance charges.
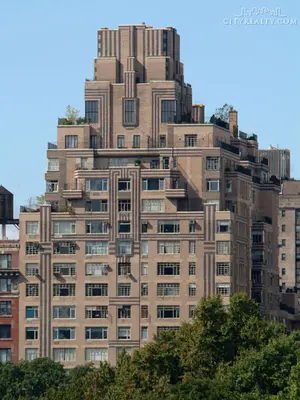
Situated in a prime Upper West Side location, The Bolivar sits just one block north of the renowned Beresford building and provides easy access to Central Park. The neighborhood offers rich cultural attractions including the American Museum of Natural History and New York Historical Society, along with numerous restaurants and shopping options.
The building's architectural significance is recognized by its inclusion in the Central Park West Historic District, and it was added to the National Registry in 1982. Its location provides convenient access to multiple subway lines and cross-town buses.
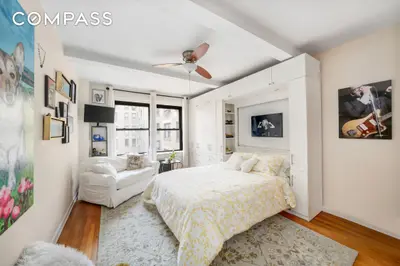
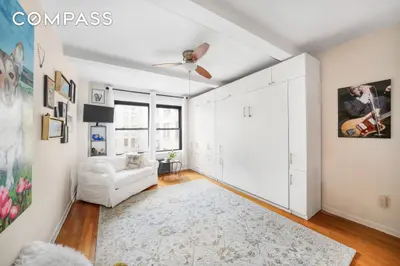
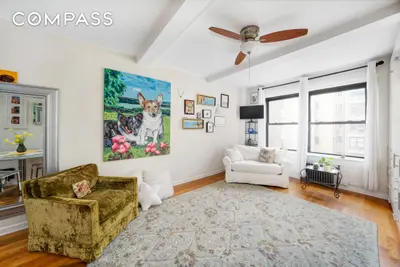
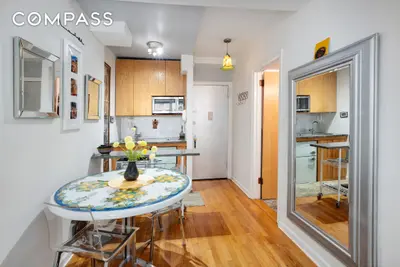
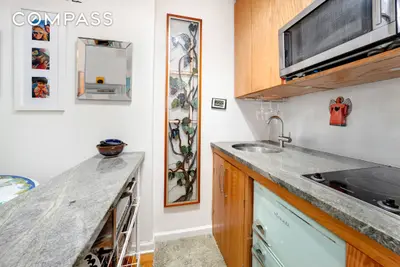
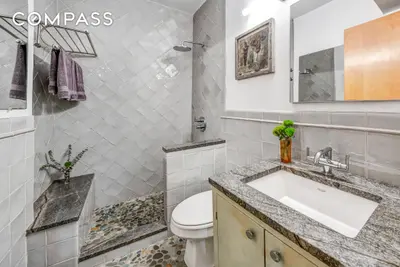
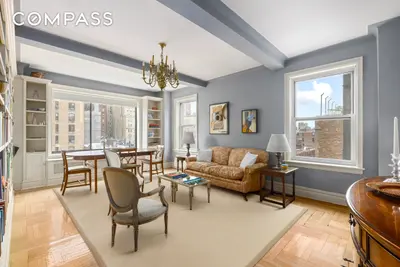
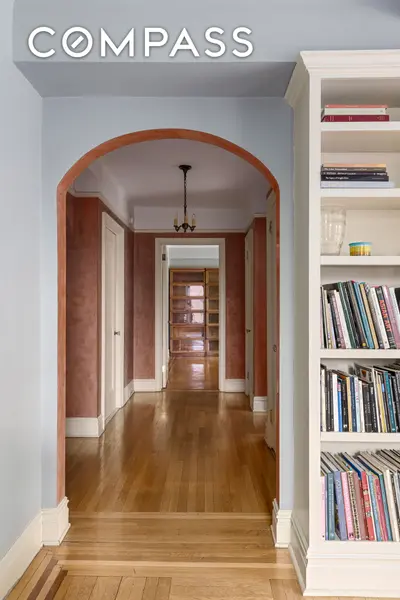
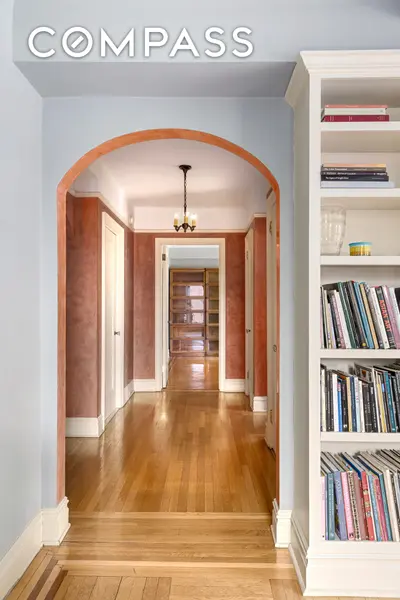
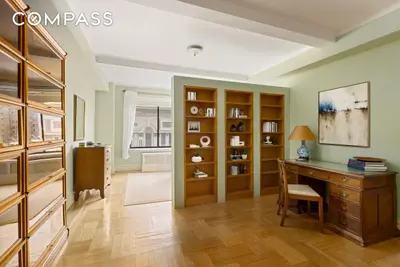
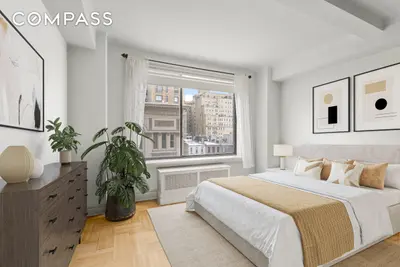
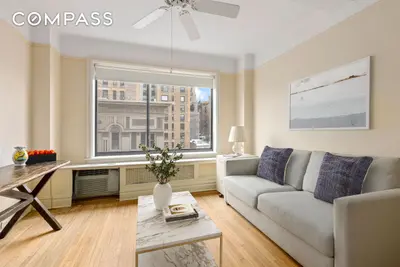
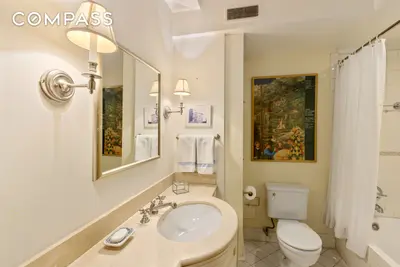
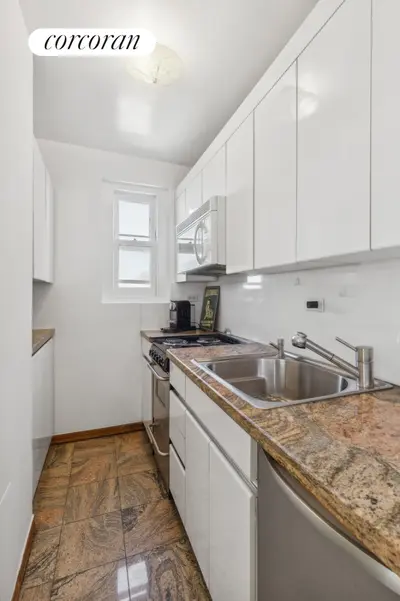
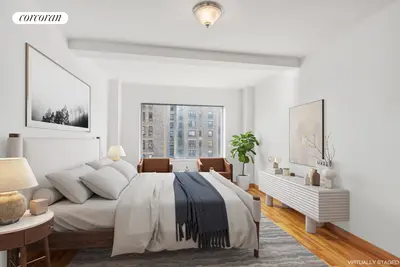
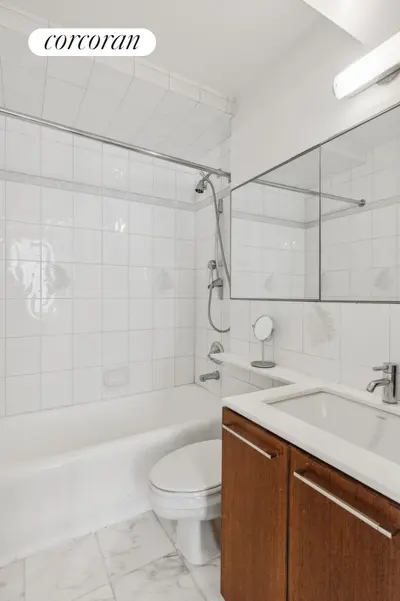
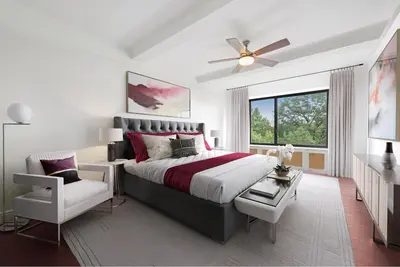
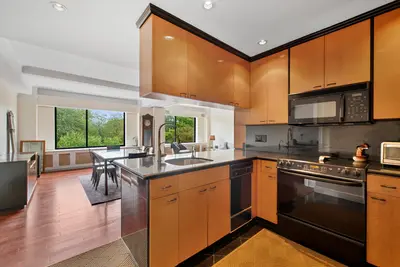
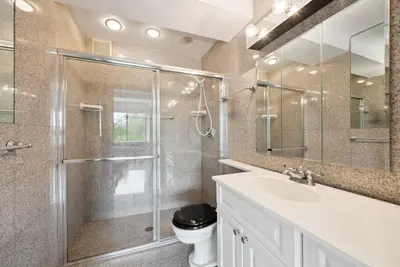
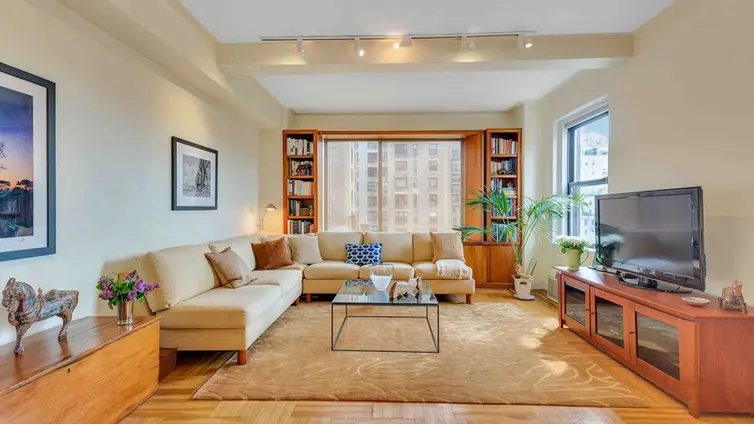
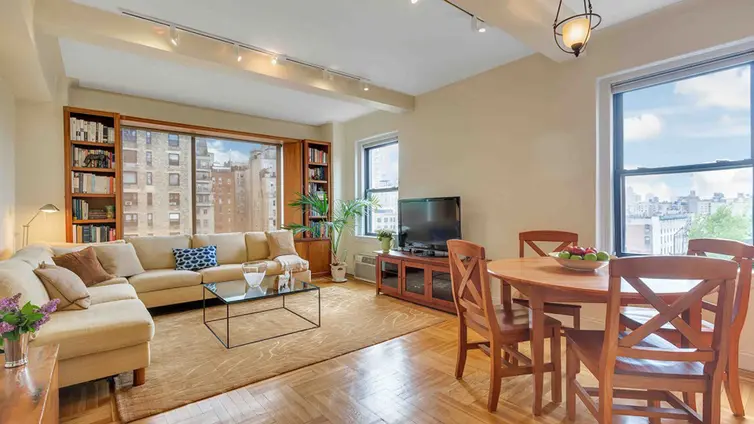
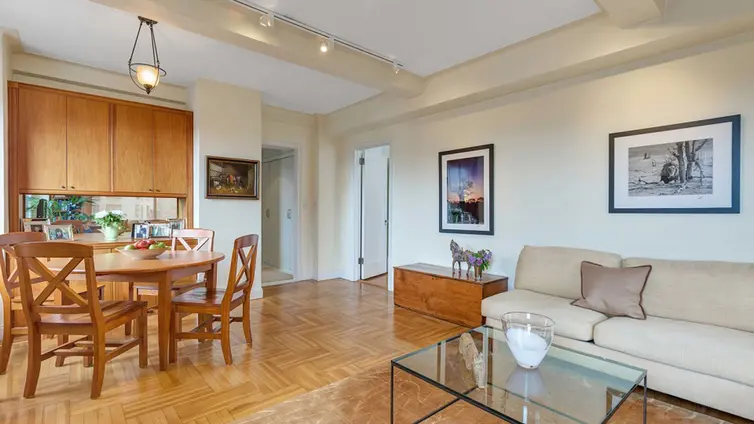
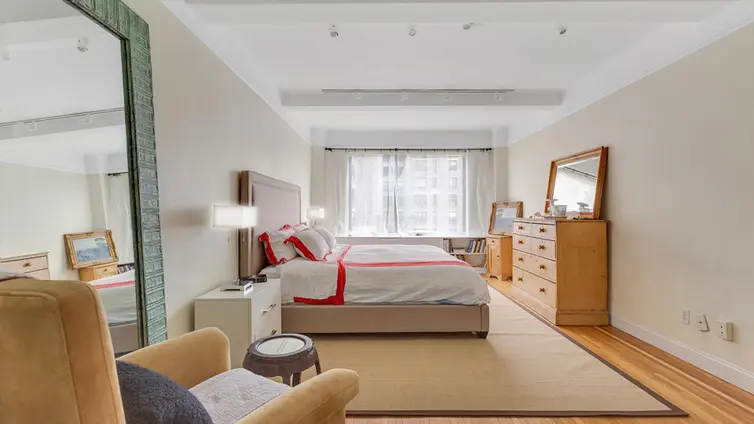
The building's pre-war character is evident in its apartment features, which often include high beamed ceilings, hardwood floors, and gracious room proportions. Many units have been modernized while maintaining their classic pre-war charm.
Interested in off-market listings at The Bolivar? Some previously listed residences might be available – contact us for insider details on potential opportunities!

View school info, local attractions, transportation options & more.
Experience amazing 3D aerial maps and fly throughs.
For some co-ops, instead of price per square foot, we use an estimate of the number of rooms for each sold apartment to chart price changes over time. This is because many co-op listings do not include square footage information, and this makes it challenging to calculate accurate square-foot averages.
By displaying the price per estimated room count, we are able to provide a more reliable and consistent metric for comparing sales in the building. While we hope that this gives you a clearer sense of price trends in the building, all data should be independently verified. All data provided are only estimates and should not be used to make any purchase or sale decision.
|
Year
Avg Price / Room (Est)
Avg. Actual Price
Med. Actual Price
Transactions
2025
$290,833
$872,500
2
2024
$301,504
$1,326,333
3
2023
$385,000
$2,606,250
4
2022
$365,000
$2,422,500
2
2021
$347,371
$2,110,000
8
2020
$482,436
$2,430,000
3
2019
$320,032
$1,175,000
5
2018
$522,861
$2,696,667
6
2017
$327,233
$1,918,033
3
2016
$474,167
$2,990,714
7
2015
$555,794
$3,048,333
6
2014
$391,125
$1,584,335
4
|
Year
Avg Price / Room (Est)
Avg. Actual Price
Med. Actual Price
Transactions
2013
$373,840
$1,806,586
7
2012
$222,756
$837,667
3
2011
$236,667
$757,500
2
2010
$123,200
$1,029,500
4
2009
$366,667
$1,288,000
4
2008
$260,644
$1,104,250
4
2007
$361,806
$1,469,375
4
2006
$279,200
$1,148,734
8
2005
$305,320
$1,163,250
8
2004
$236,611
$988,125
8
2003
$278,195
$1,563,333
9
|
the following is a slider of images. For screen reader users, all slides are visible at all time so you may ignore control buttons.
Sign-up and we'll email you new listings in this building!
Whether you’re a buyer, investor, or simply curious, this report is your key to unlocking in-depth insights and analysis on .
Please confirm your details: