Shh... Many units sell without being publicly listed.
Limited off-market opportunities might be available at +Art – ideal for those looking to explore listings not currently on the market. Contact us to learn more.


Limited off-market opportunities might be available at +Art – ideal for those looking to explore listings not currently on the market. Contact us to learn more.

View school info, local attractions, transportation options & more.
Experience amazing 3D aerial maps and fly throughs.
|
Year
Avg Price / Ft2 (Est)
Median Price / Ft2 (Est)
Avg. Actual Price
Med. Actual Price
Transactions
2025
$1,686
$2,020,000
$1,686
$2,020,000
2
2024
$1,670
$1,452,800
$1,739
$1,590,000
5
2023
$1,762
$1,712,500
$1,762
$1,712,500
2
2022
$1,883
$1,723,333
$1,753
$1,265,000
3
2021
$1,549
$1,270,136
$1,619
$1,275,000
11
2020
$1,665
$1,753,333
$1,593
$1,850,000
3
2019
$1,479
$1,490,000
$1,448
$1,412,500
4
2018
$1,702
$1,753,000
$1,759
$1,435,000
5
2017
$1,787
$1,630,400
$1,751
$1,290,000
10
2016
$1,742
$1,666,667
$1,681
$1,295,000
6
2015
$1,589
$1,685,025
$1,618
$1,855,000
8
2014
$1,601
$1,473,200
$1,610
$1,275,000
20
|
Year
Avg Price / Ft2 (Est)
Median Price / Ft2 (Est)
Avg. Actual Price
Med. Actual Price
Transactions
2013
$1,301
$1,005,201
$1,309
$983,213
8
2012
$1,094
$994,087
$1,100
$908,213
57
2011
$1,123
$1,101,779
$1,099
$977,665
26
2010
-
-
-
-
0
2009
-
-
-
-
0
2008
-
-
-
-
0
2007
-
-
-
-
0
2006
-
-
-
-
0
2005
-
-
-
-
0
2004
-
-
-
-
0
2003
-
-
-
-
0
|
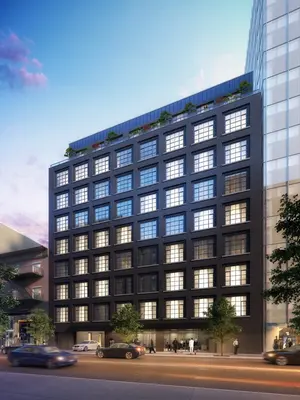
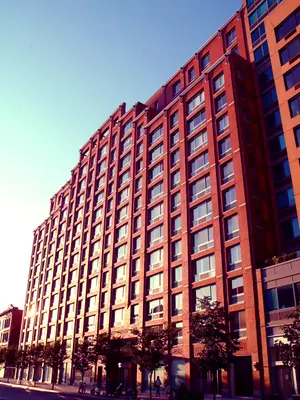
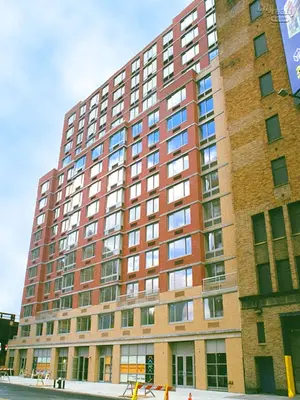
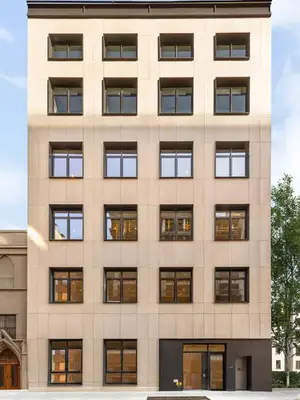
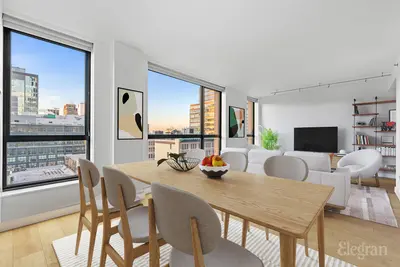
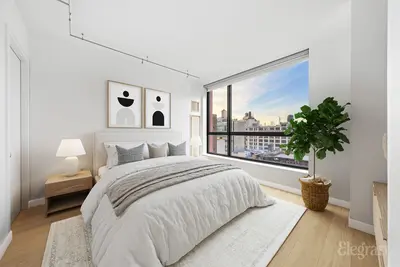
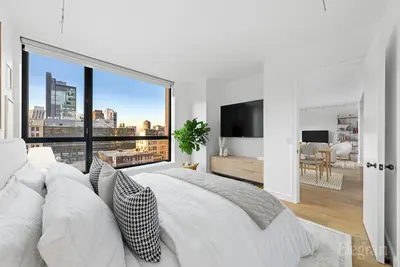
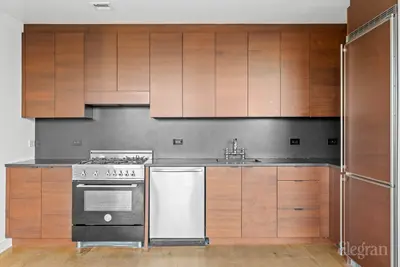
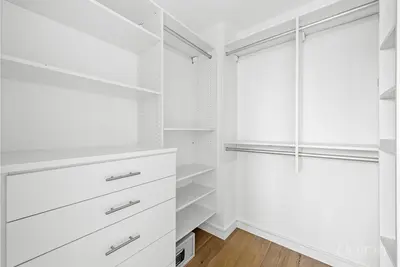
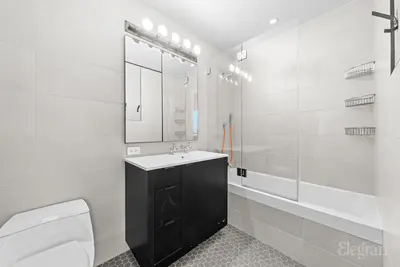
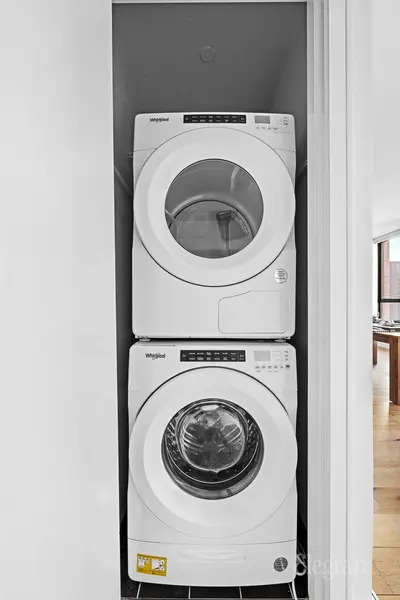
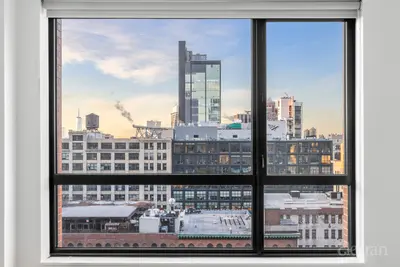
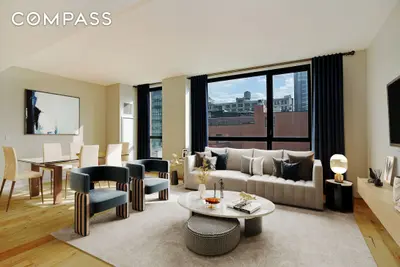
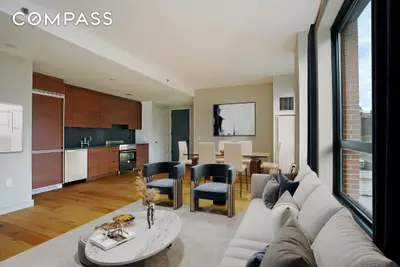
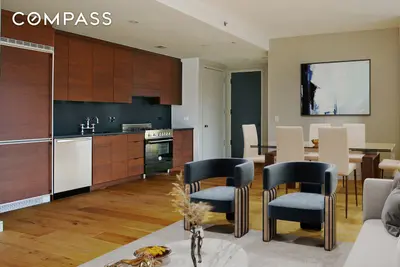
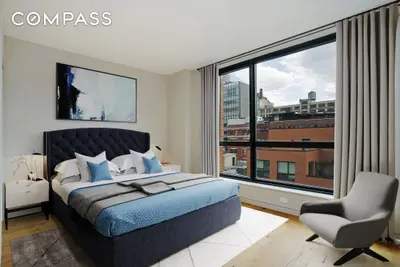
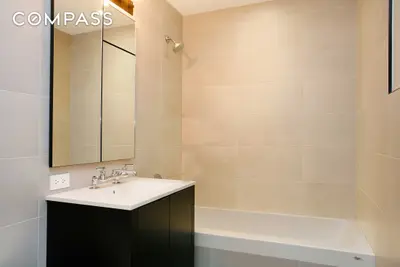
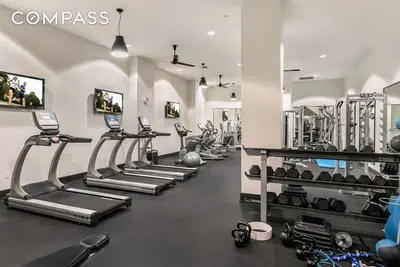
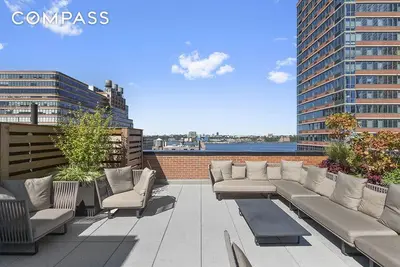
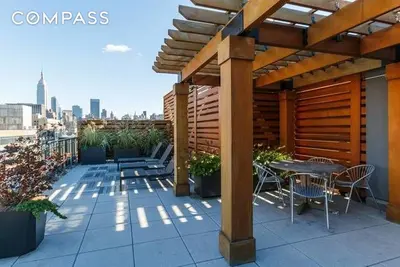
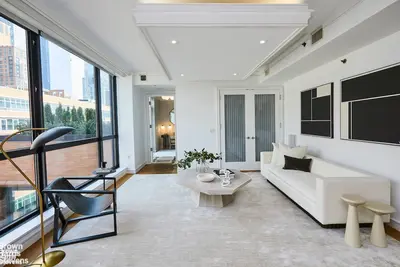
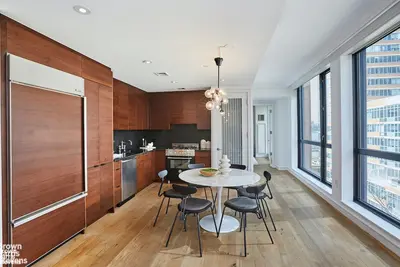
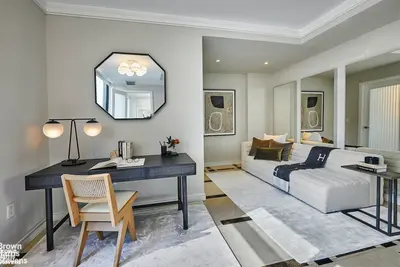
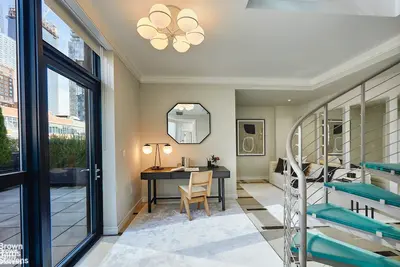
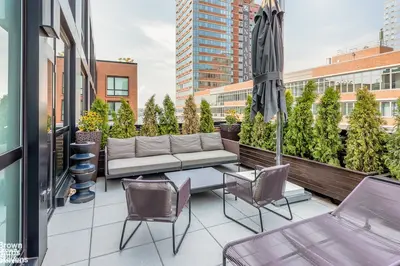
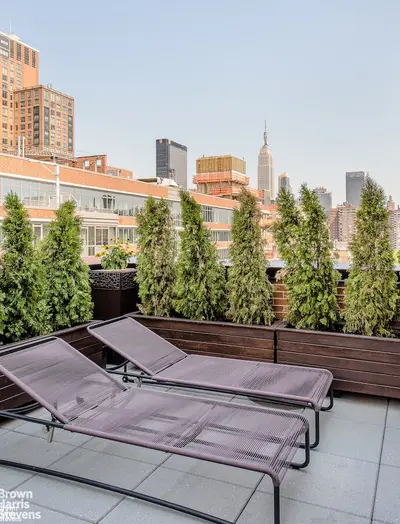
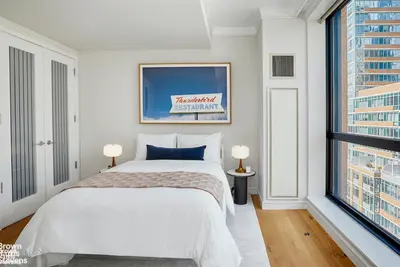
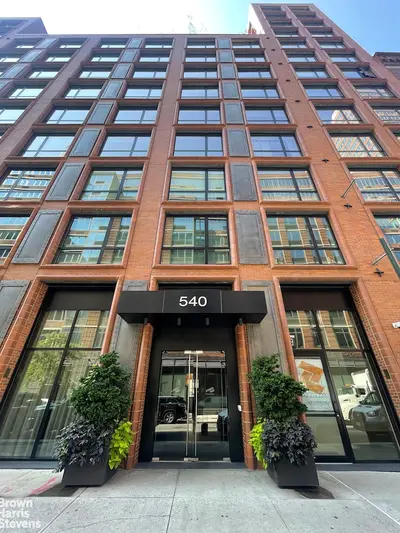
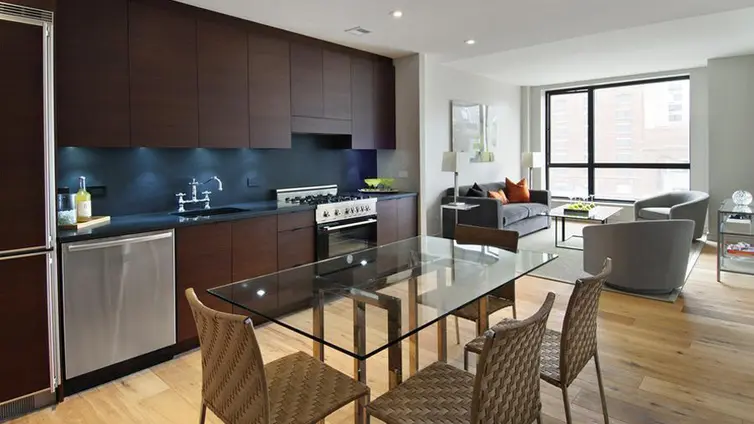
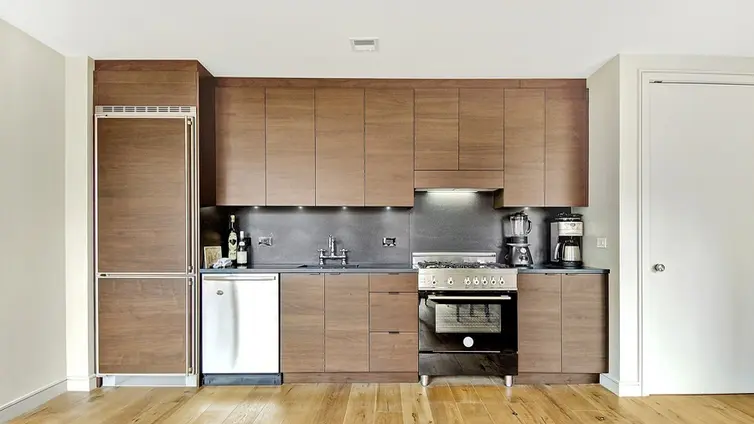
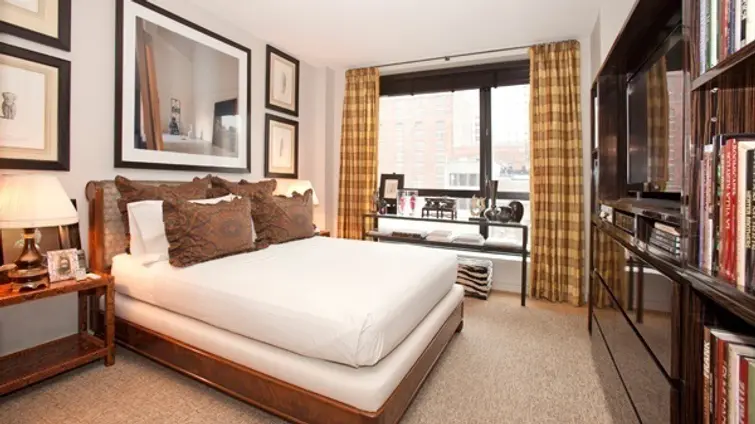
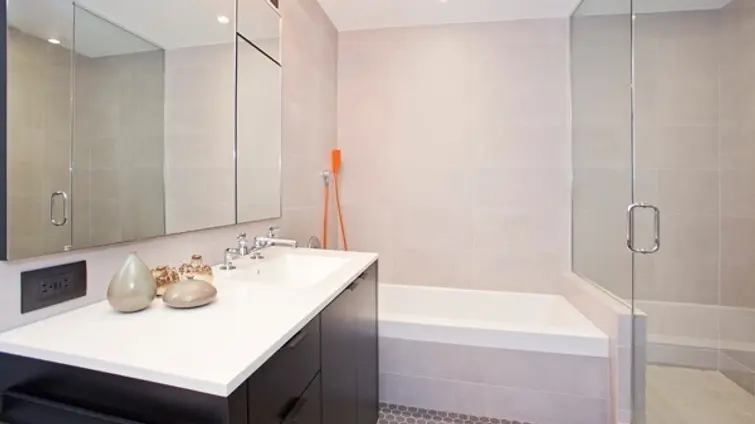
the following is a slider of images. For screen reader users, all slides are visible at all time so you may ignore control buttons.
Sign-up and we'll email you new listings in this building!
Whether you’re a buyer, investor, or simply curious, this report is your key to unlocking in-depth insights and analysis on .
Please confirm your details: