Shh... Many units sell without being publicly listed.
Limited off-market opportunities might be available at 435 East 65th Street – ideal for those looking to explore listings not currently on the market. Contact us to learn more.
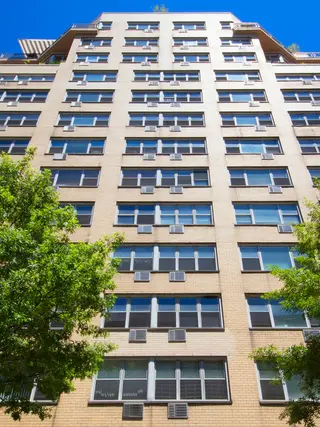
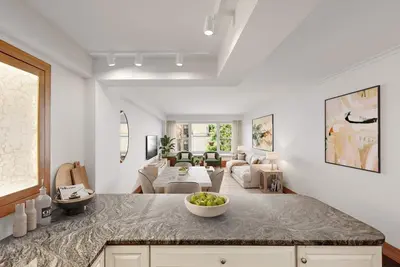

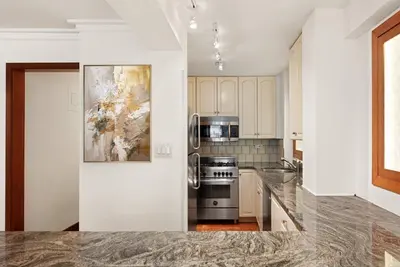


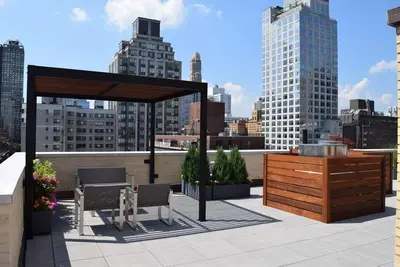


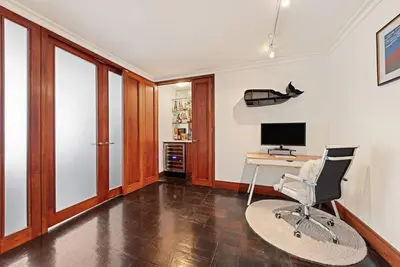

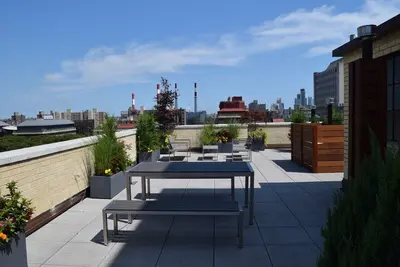
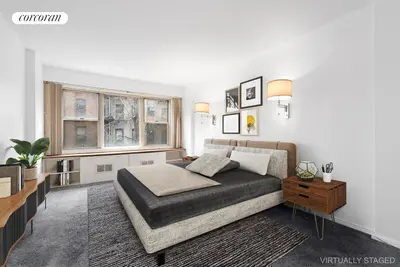
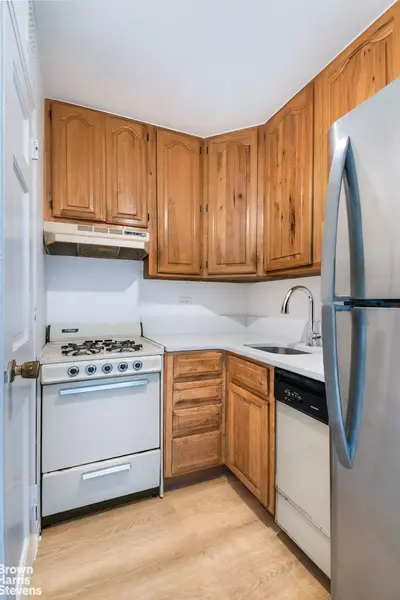
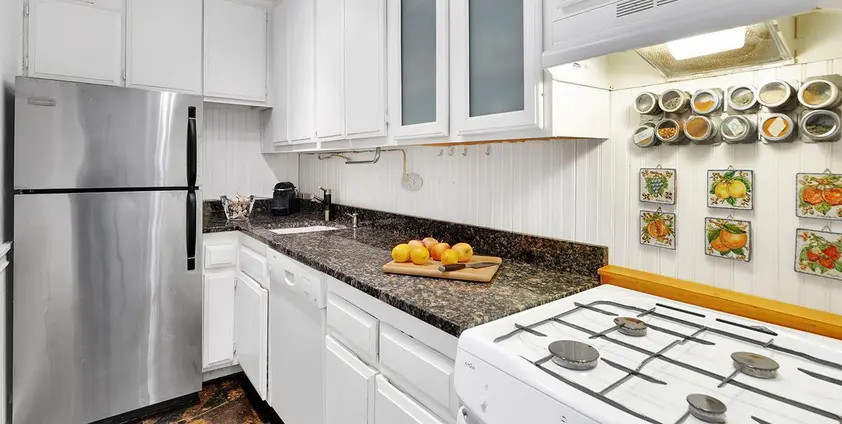
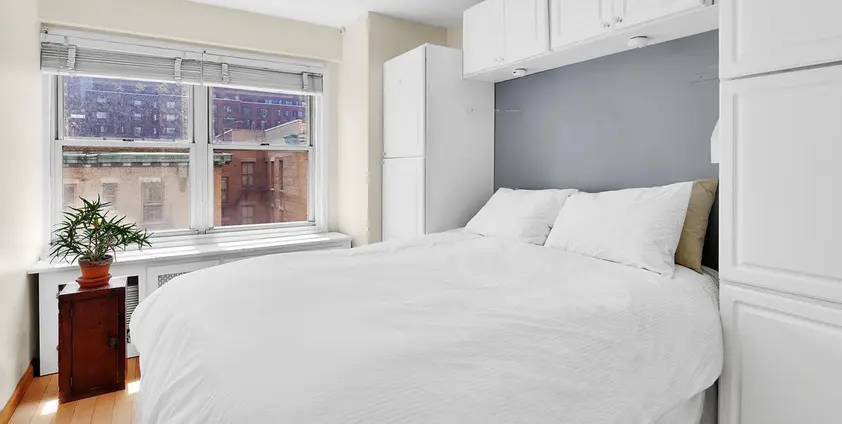
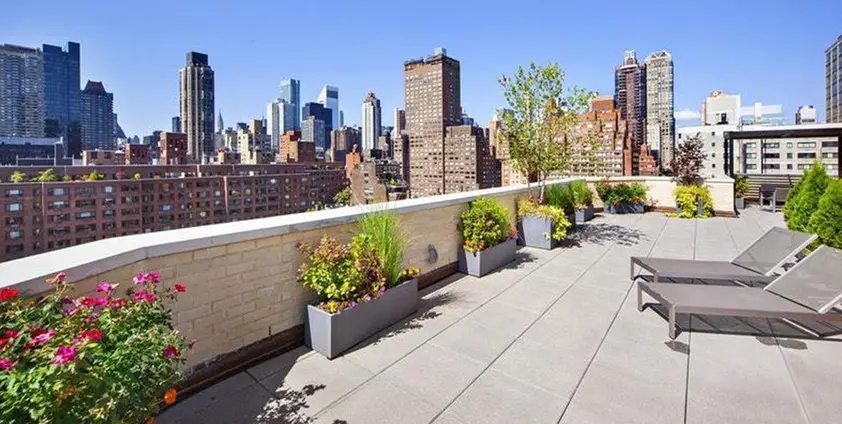
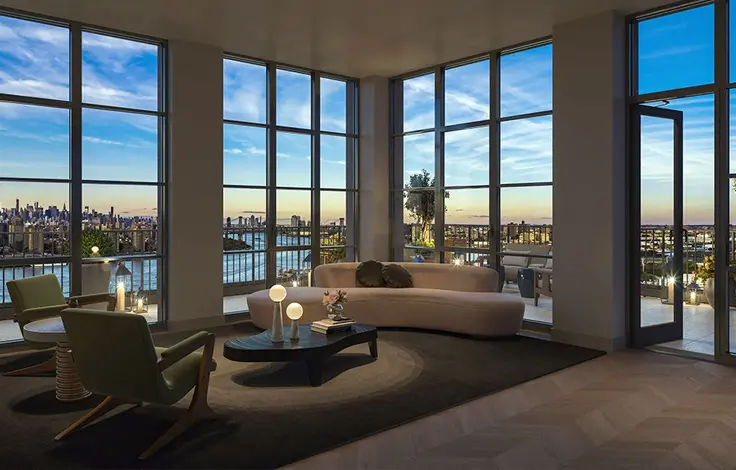
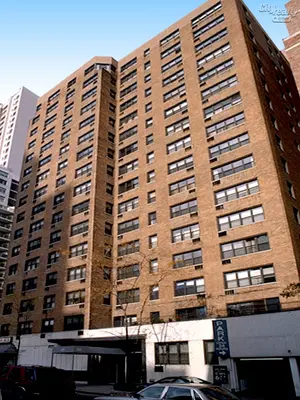
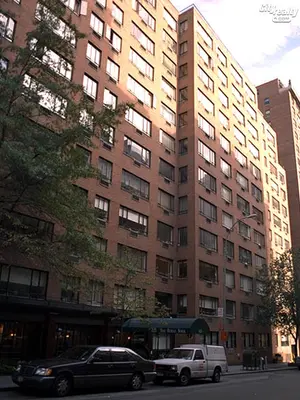
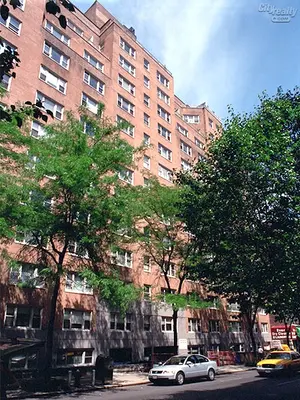
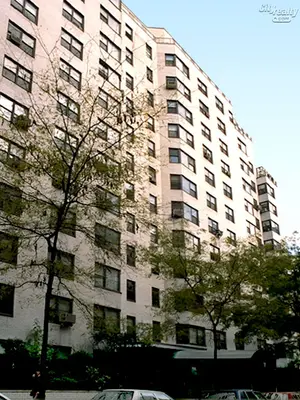
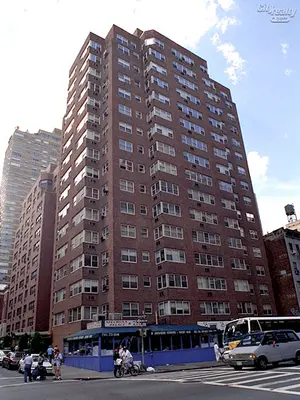
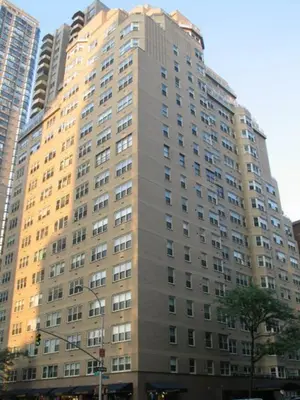
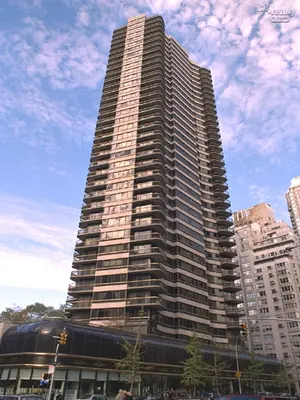
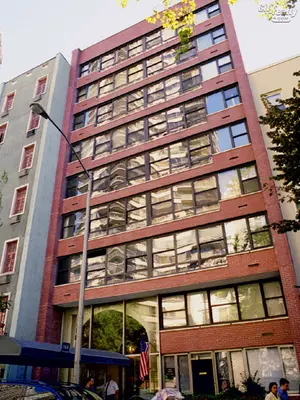
Conveniently located on East 65th Street between First and York Avenues near great shopping, restaurants and all major transportation including the new Q line, 435 East 65th Street is a post-war co-op with a brand-new roof deck and garage in the building. Cats welcome, but sorry, no dogs. Parents buying for children and gifting are allowed. Subletting permitted with board approval (after 1 year). There are no assessments and the buildings underlying mortgage is paid off.
Limited off-market opportunities might be available at 435 East 65th Street – ideal for those looking to explore listings not currently on the market. Contact us to learn more.

View school info, local attractions, transportation options & more.
Experience amazing 3D aerial maps and fly throughs.
For some co-ops, instead of price per square foot, we use an estimate of the number of rooms for each sold apartment to chart price changes over time. This is because many co-op listings do not include square footage information, and this makes it challenging to calculate accurate square-foot averages.
By displaying the price per estimated room count, we are able to provide a more reliable and consistent metric for comparing sales in the building. While we hope that this gives you a clearer sense of price trends in the building, all data should be independently verified. All data provided are only estimates and should not be used to make any purchase or sale decision.
|
Year
Avg Price / Room (Est)
Avg. Actual Price
Med. Actual Price
Transactions
2025
$197,500
$775,833
3
2024
$173,444
$831,750
4
2023
$175,444
$526,333
3
2022
$168,333
$505,000
2
2021
$170,367
$536,000
10
2020
$171,222
$670,000
6
2019
$193,470
$812,268
7
2018
$196,056
$588,167
6
2017
$182,400
$651,200
5
2016
$168,929
$526,750
4
2015
$158,150
$474,450
4
2014
$182,775
$719,000
8
|
Year
Avg Price / Room (Est)
Avg. Actual Price
Med. Actual Price
Transactions
2013
$189,521
$664,647
9
2012
$135,333
$464,667
6
2011
$136,033
$498,750
4
2010
$131,966
$395,898
3
2009
$154,417
$421,250
2
2008
$203,133
$897,333
3
2007
$145,950
$420,500
4
2006
$157,165
$653,496
2
2005
$147,352
$502,375
8
2004
$106,004
$305,534
13
2003
$97,333
$279,500
6
|
the following is a slider of images. For screen reader users, all slides are visible at all time so you may ignore control buttons.
Sign-up and we'll email you new listings in this building!
Whether you’re a buyer, investor, or simply curious, this report is your key to unlocking in-depth insights and analysis on .
Please confirm your details:


Broker & Buyer Comments