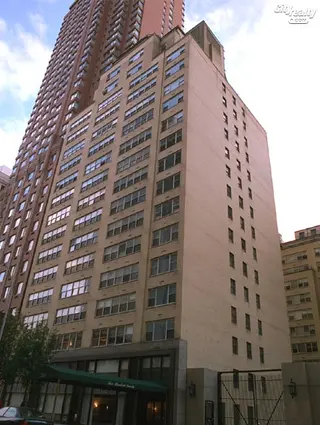
Parker 72nd, 520 East 72nd Street - Lenox Hill
- Apartments
- Overview & Photos
- Maps
- Floorplans
- Sales Data & Comps
- Similar Buildings
- All Units


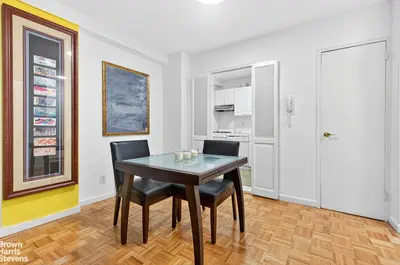


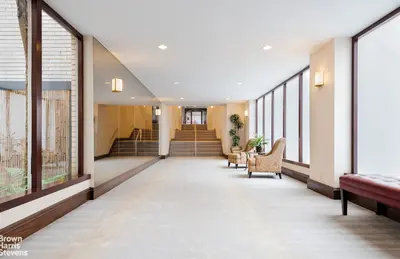
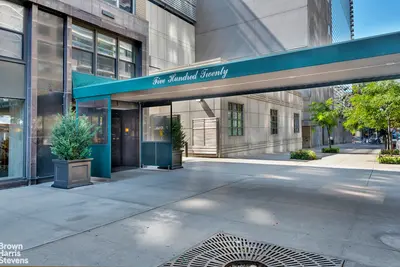


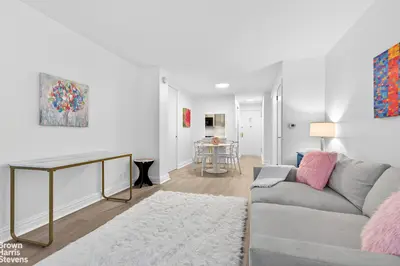
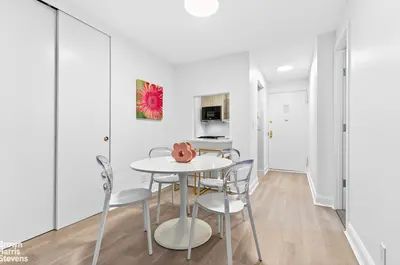
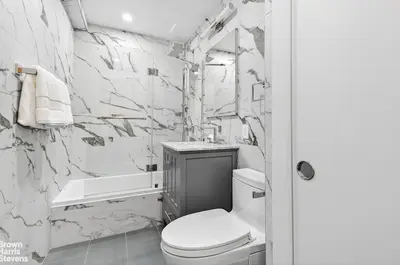
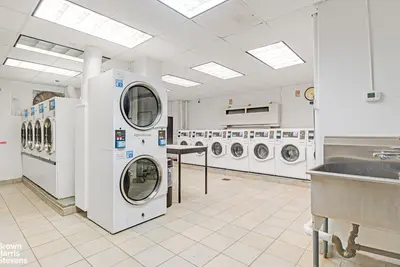
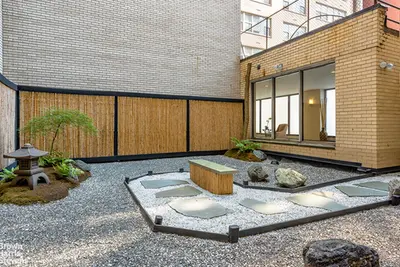

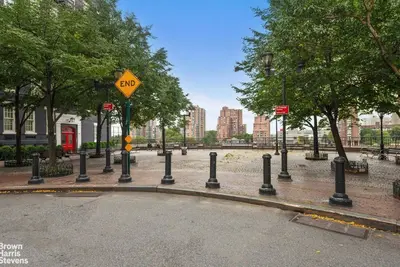
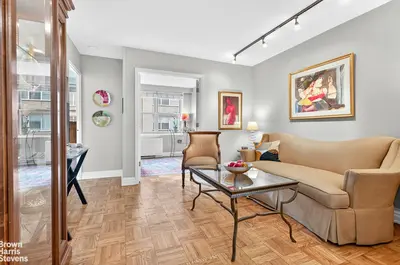

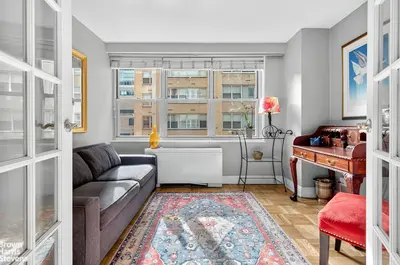
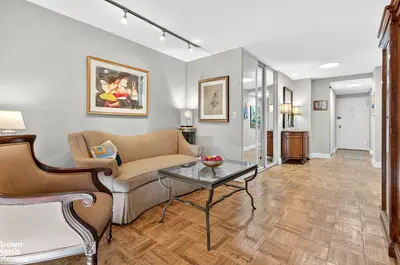


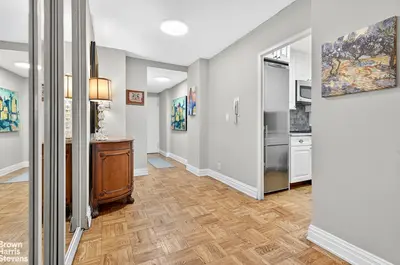
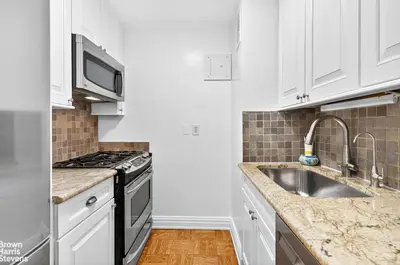
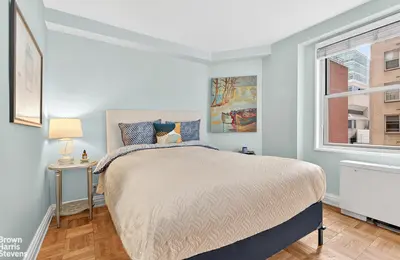

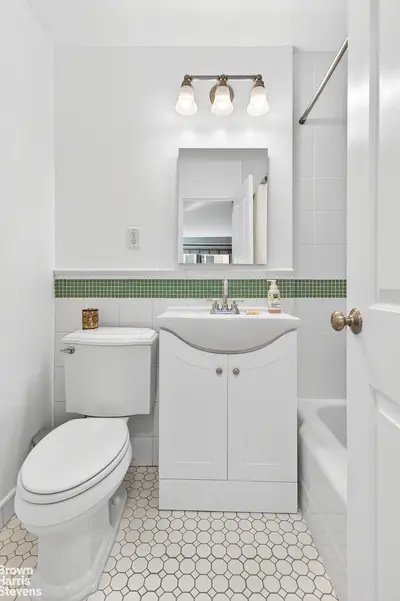
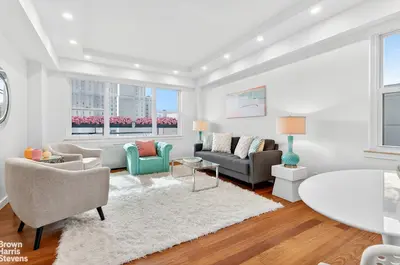
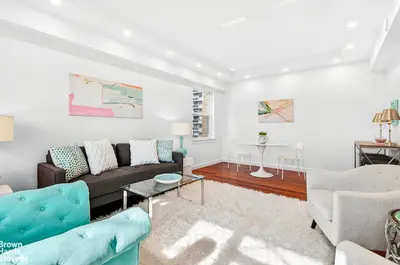
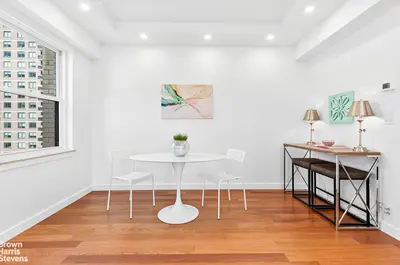

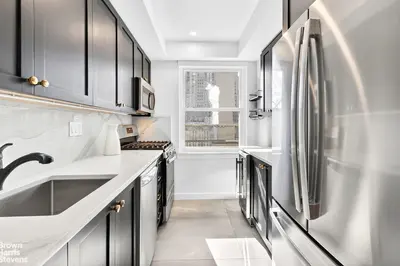
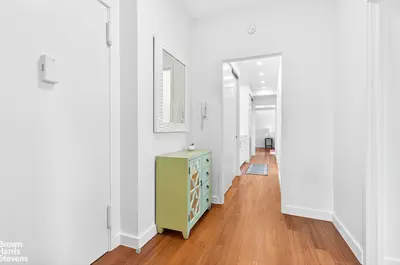
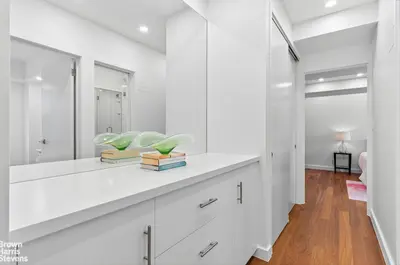

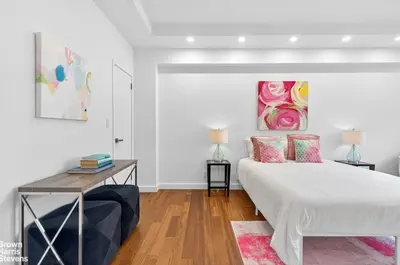

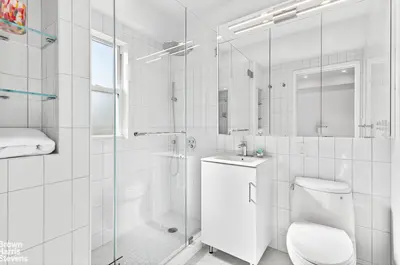
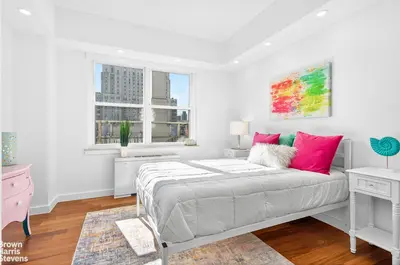
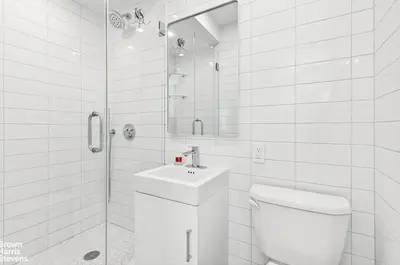

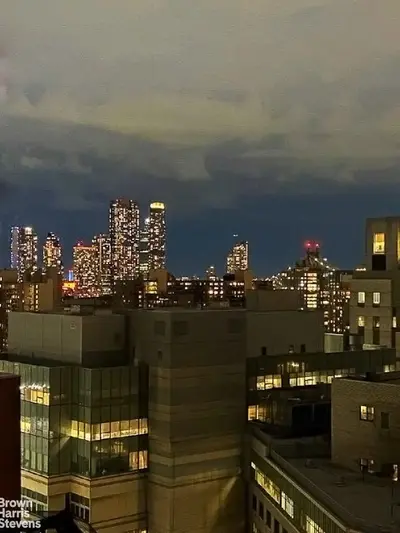
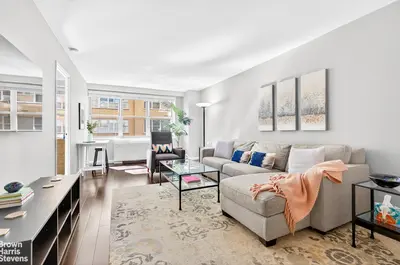
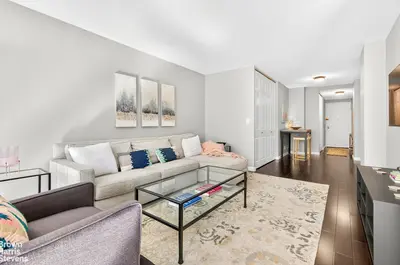
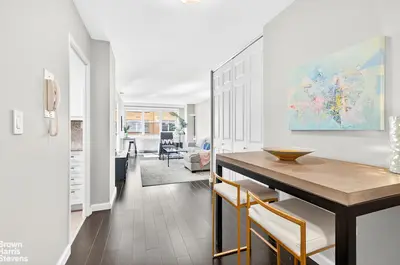


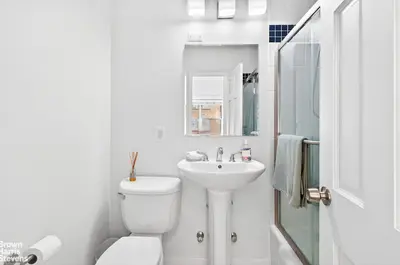
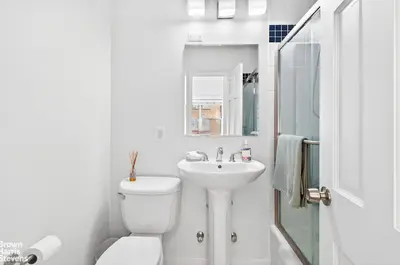


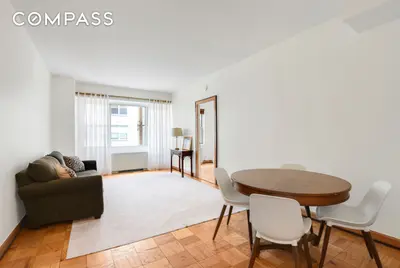

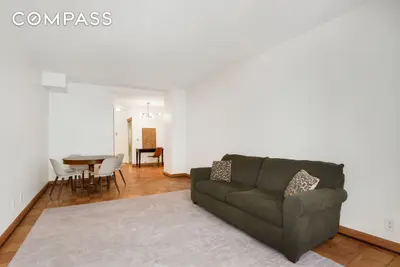
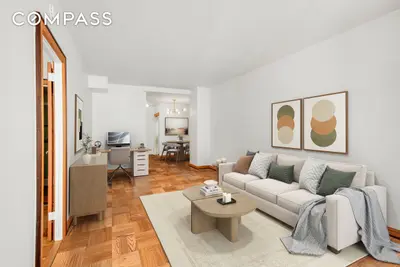
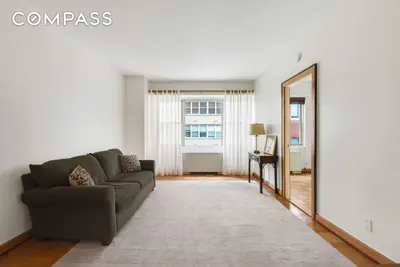
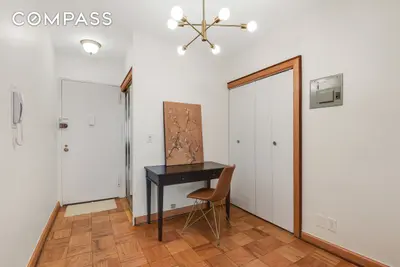
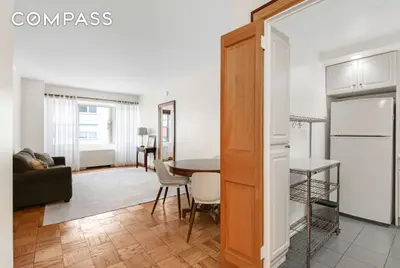
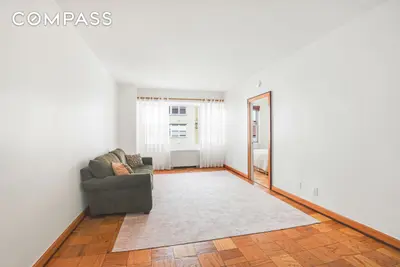
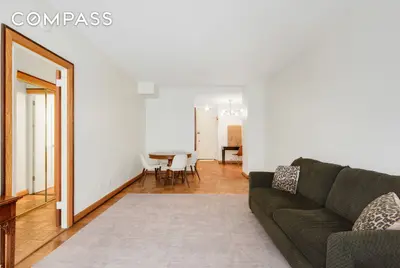
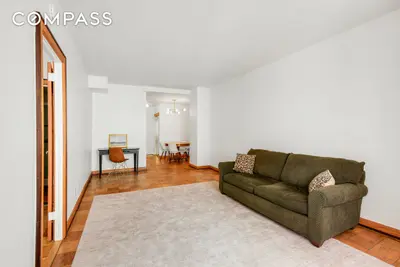
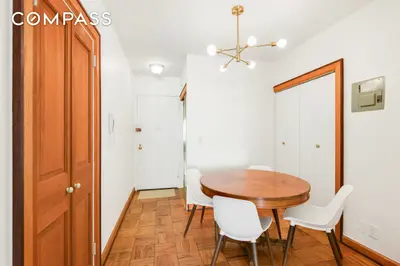
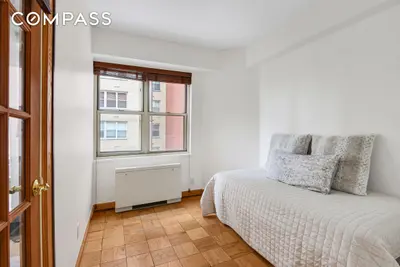
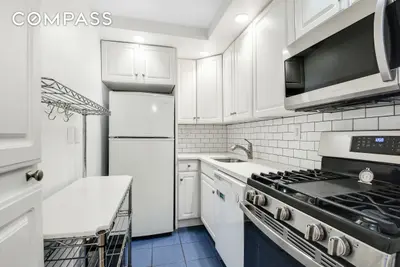
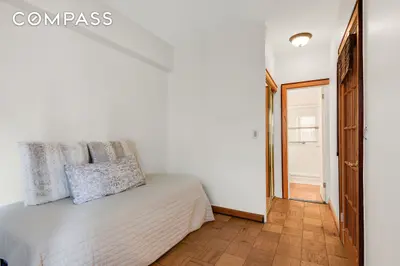
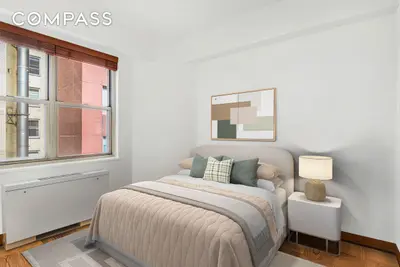


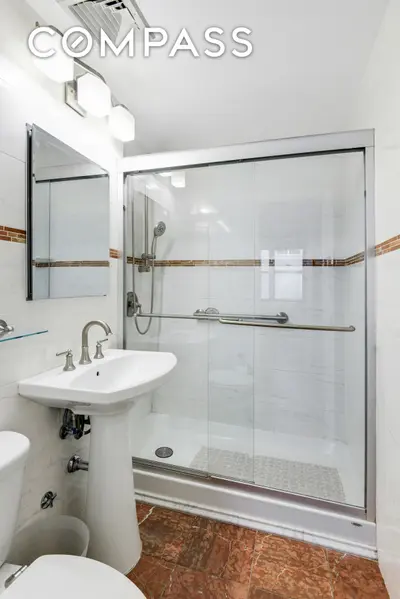
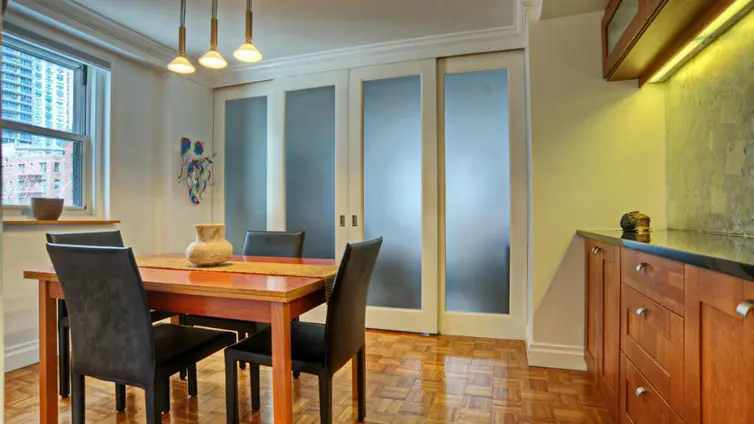
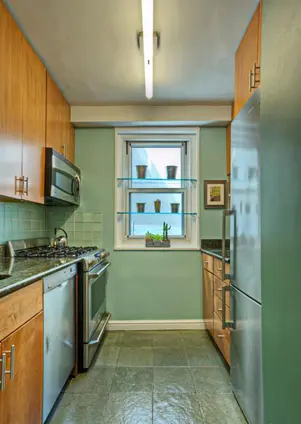
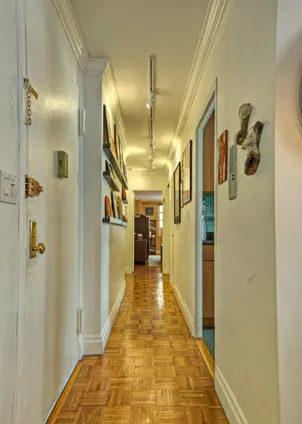
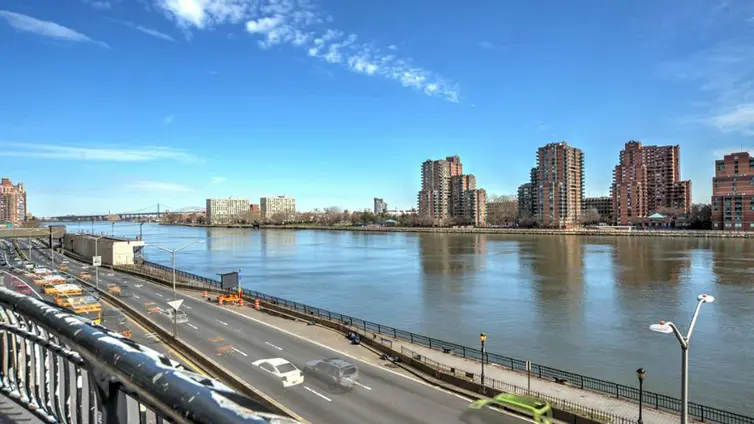
Nestled on a quiet, tree-lined cul-de-sac overlooking the East River and with easy access to two pocket parks and the East River Promenade, 520 East 72nd Street is a full-service Upper East Side co-op offering amenities that include a 24-hour doorman/concierge, a live-in resident manager, a garage, laundry facility, a bike room, building link, a library and a zen-garden.
Non-smoking building. Co-purchasers, guarantors, pieds-a-terre and subletting (after two years, for two years out of ten) are all allowed. Pets are also welcome!
The building is also convenient to the Second Avenue Subway, two bus routes on the corner (72nd Street cross-town and the M31 to 57th Street and the Westside), shopping and recreational facilities. Citi Bikes on the corner.


View school info, local attractions, transportation options & more.
Experience amazing 3D aerial maps and fly throughs.
For some co-ops, instead of price per square foot, we use an estimate of the number of rooms for each sold apartment to chart price changes over time. This is because many co-op listings do not include square footage information, and this makes it challenging to calculate accurate square-foot averages.
By displaying the price per estimated room count, we are able to provide a more reliable and consistent metric for comparing sales in the building. While we hope that this gives you a clearer sense of price trends in the building, all data should be independently verified. All data provided are only estimates and should not be used to make any purchase or sale decision.