Lincoln Guild, 303 West 66th Street - Upper West Side
- Apartments
- Overview & Photos
- Maps
- Floorplans
- Sales Data & Comps
- Similar Buildings
- All Units


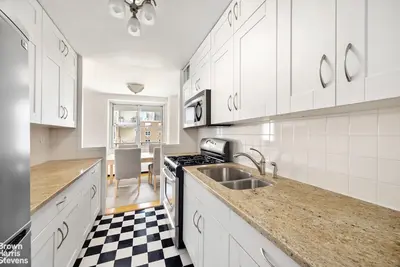
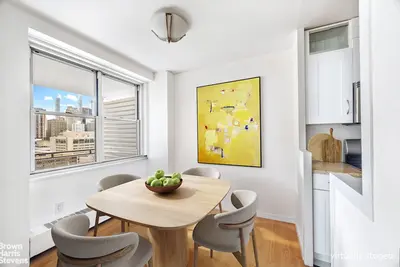
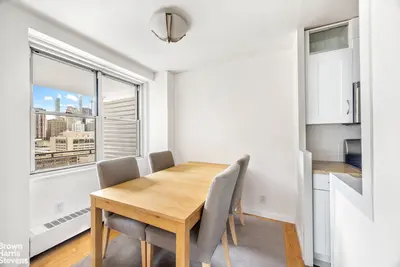
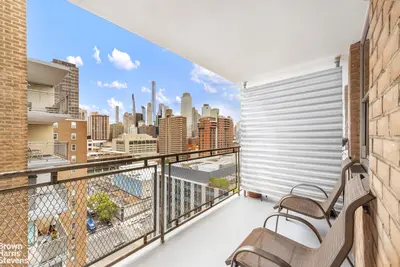
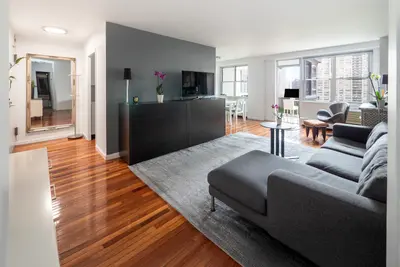
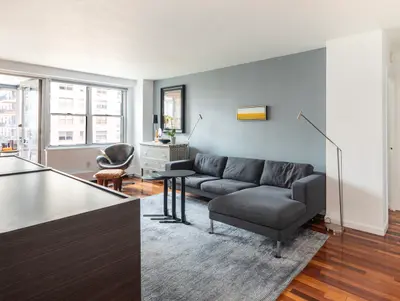
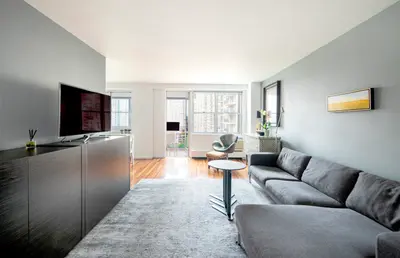
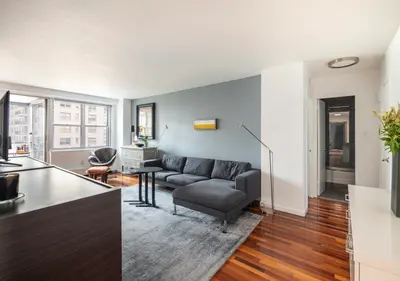
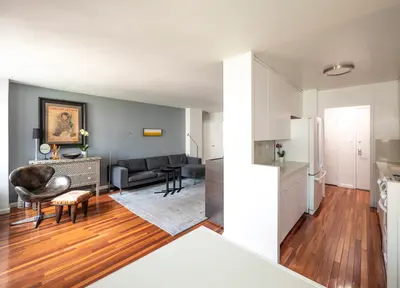
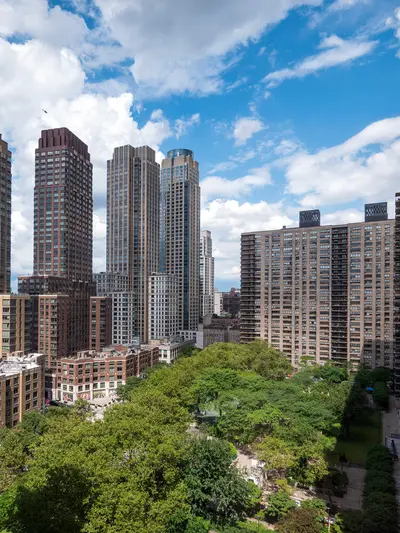
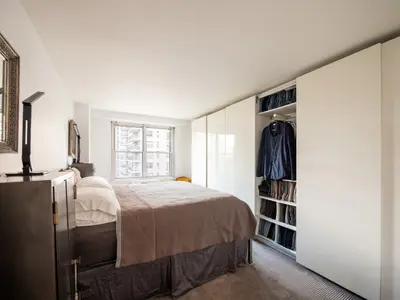

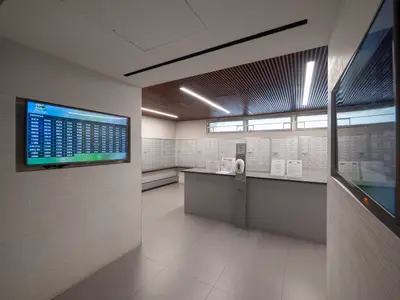
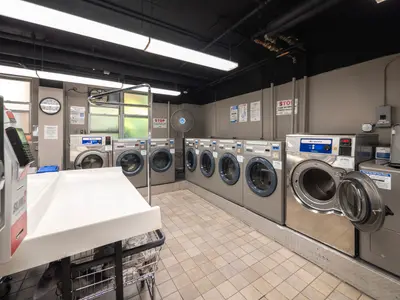

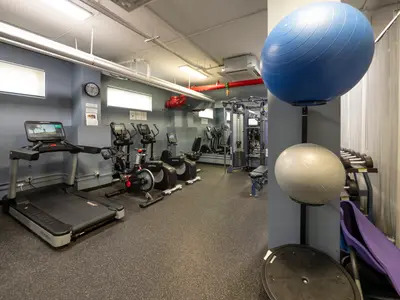
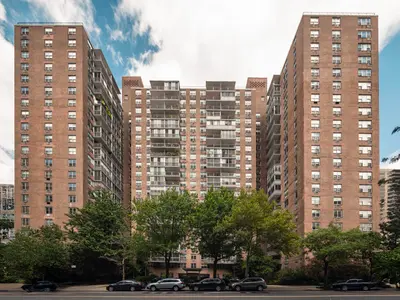
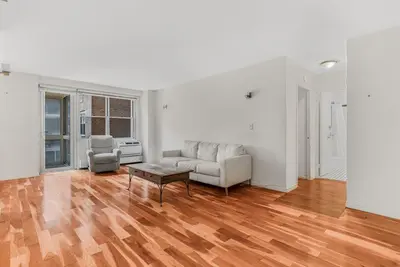
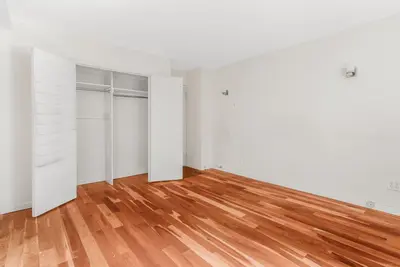
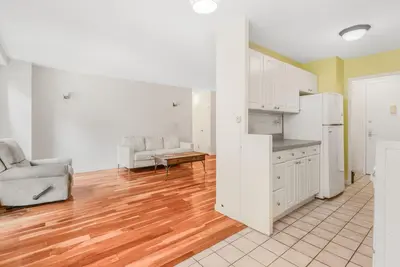
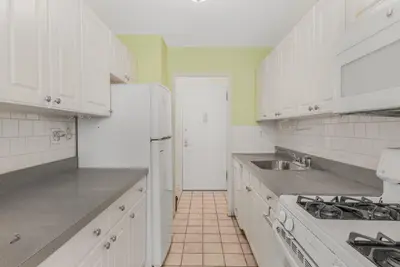
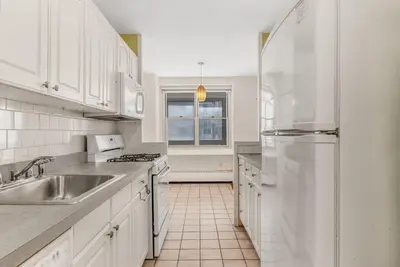
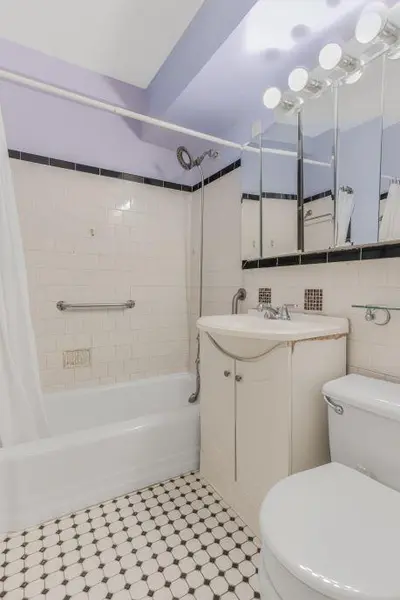
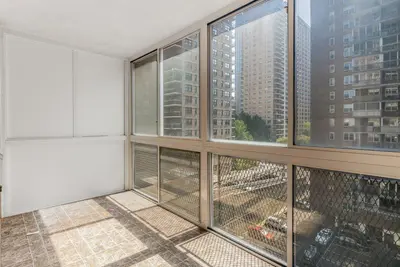
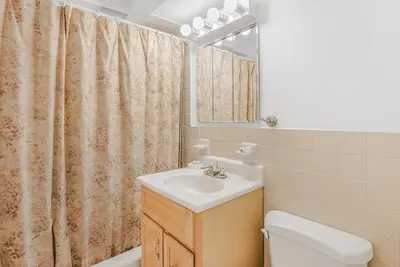
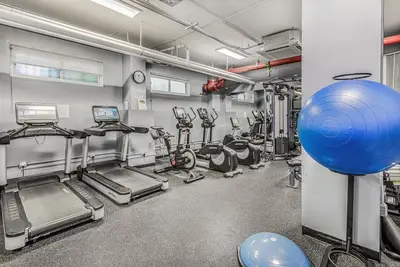
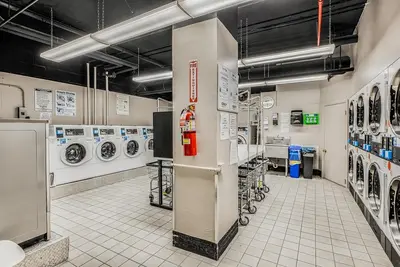
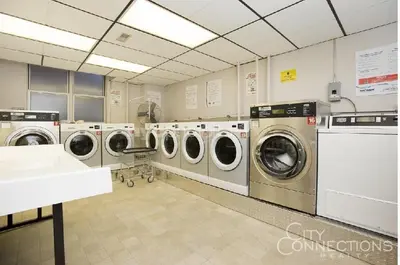
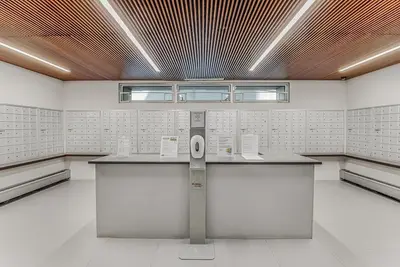
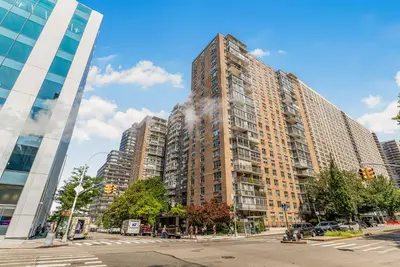
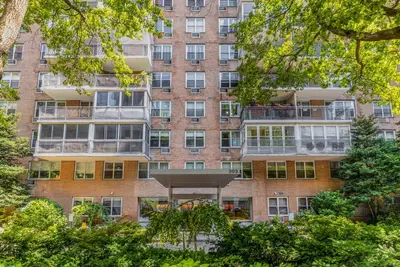
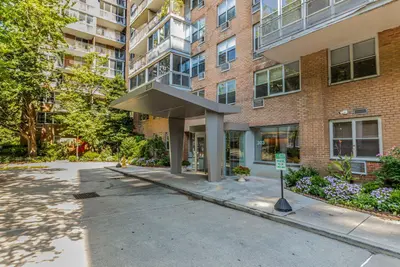

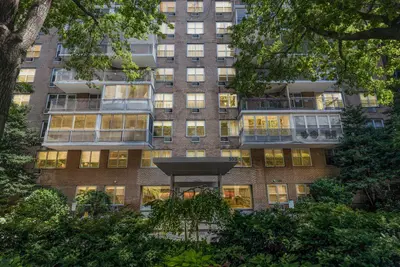


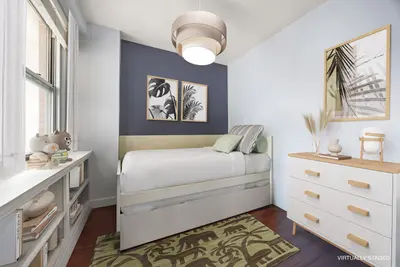
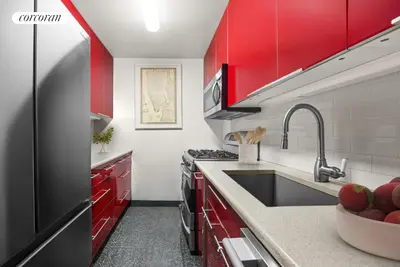
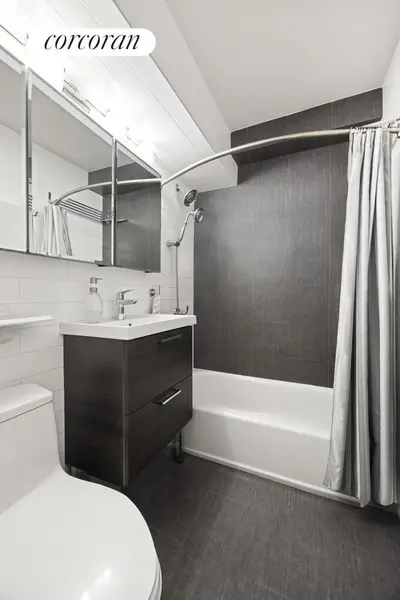

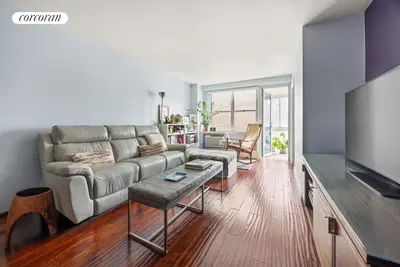
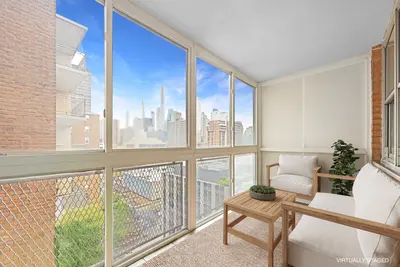
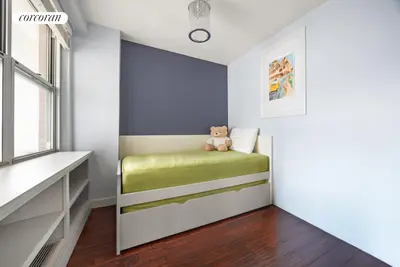
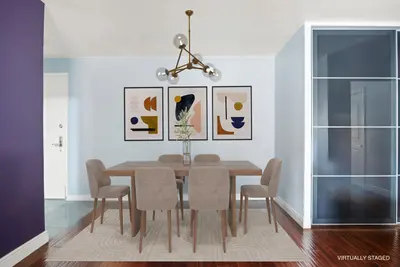
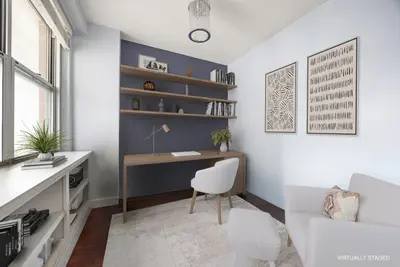


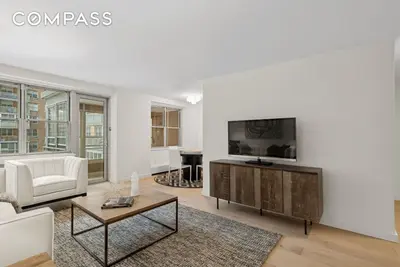
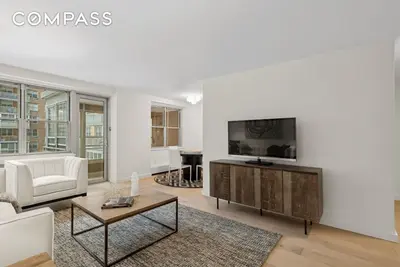

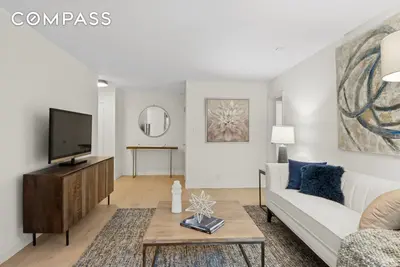
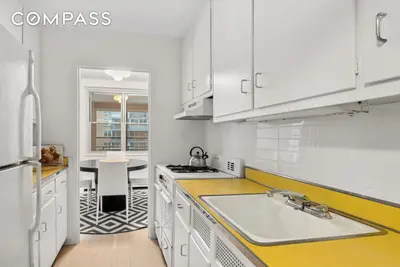

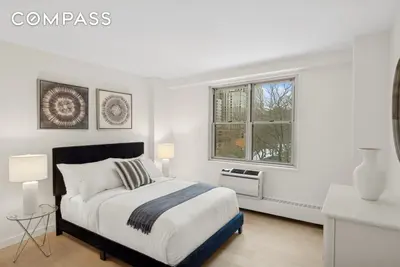

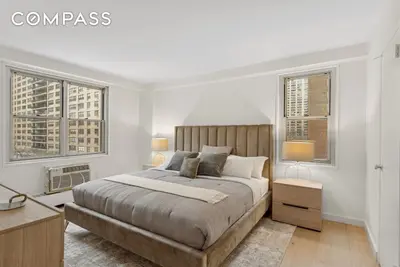


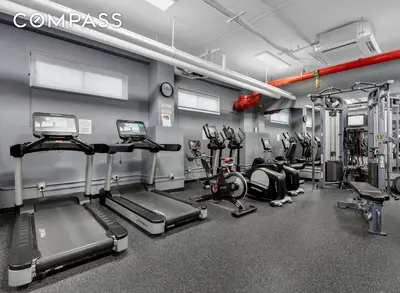
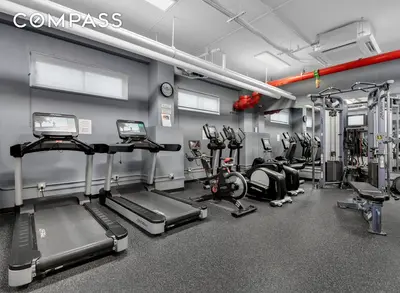

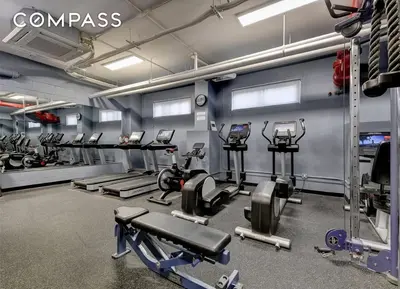

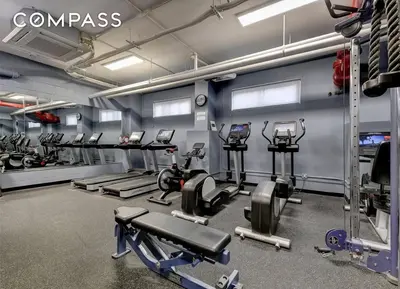


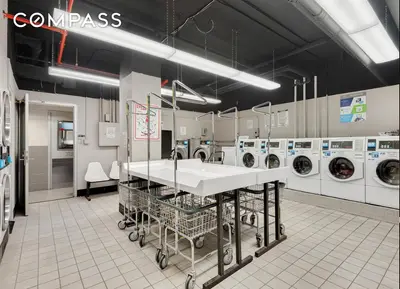
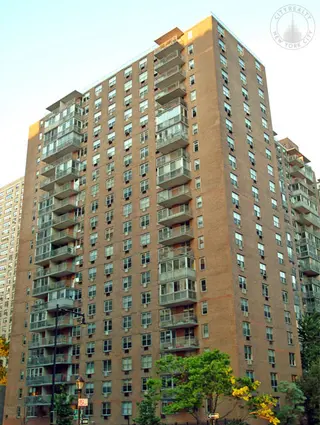
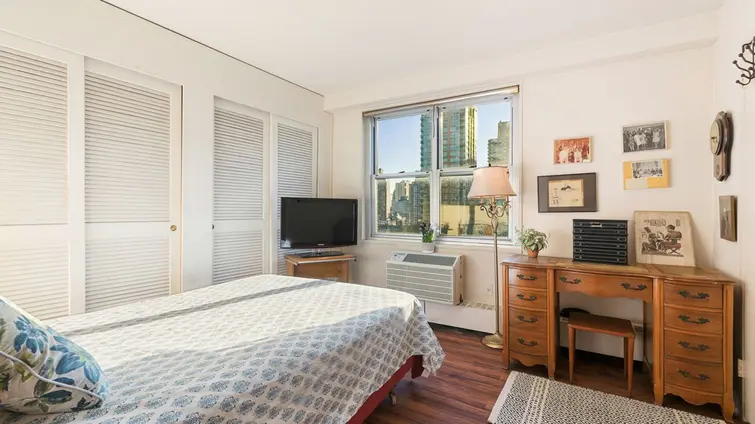
Lincoln Guild is a postwar cooperative comprising 420 units and surrounded by beautiful landscaping. The staff includes on-site management, a superintendent, and 24-hour lobby attendant with concierge/package service. Amenities include a gym, renovated lounge, and modern central laundry rooms.
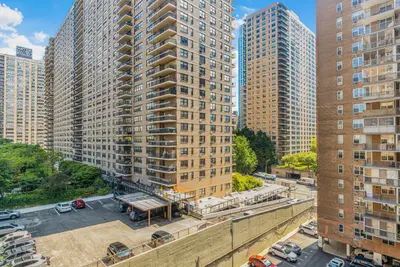
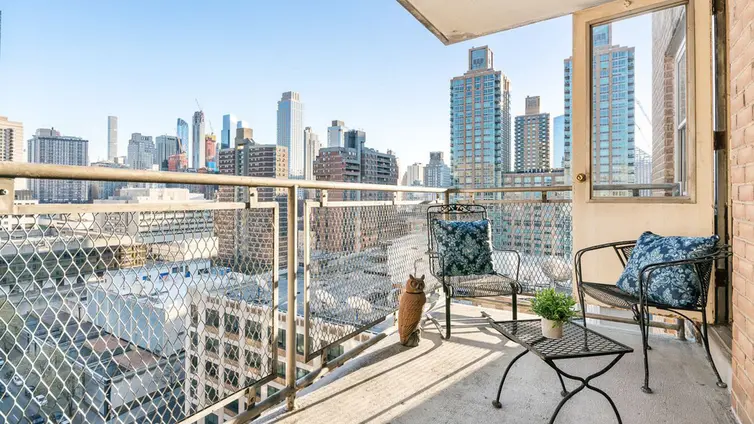
Lincoln Guild is located at 303 West 66th Broadway near Lincoln Center, Central Park, Riverside Park, the Hudson River Greenway, the Time Warner Center, Trader Joe's, Fairway Market, the Greenmarket at Richard Tucker Square, the M66, M72, and M57 bus lines, and the 66th Street 1 train. Co-purchasing, pied-a-terres, and gifting are all permitted, but dogs are not.

View school info, local attractions, transportation options & more.
Experience amazing 3D aerial maps and fly throughs.
For some co-ops, instead of price per square foot, we use an estimate of the number of rooms for each sold apartment to chart price changes over time. This is because many co-op listings do not include square footage information, and this makes it challenging to calculate accurate square-foot averages.
By displaying the price per estimated room count, we are able to provide a more reliable and consistent metric for comparing sales in the building. While we hope that this gives you a clearer sense of price trends in the building, all data should be independently verified. All data provided are only estimates and should not be used to make any purchase or sale decision.
Broker & Buyer Comments