The Gallery House, 77 West 55th Street, NYC - Condo Apartments
- Apartments
- Overview & Photos
- Maps
- Floorplans
- Sales Data & Comps
- Similar Buildings
- All Units

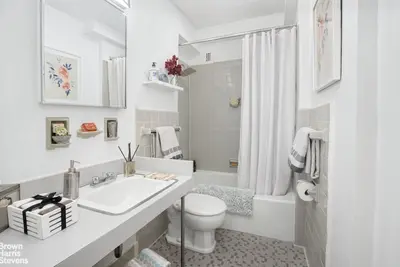

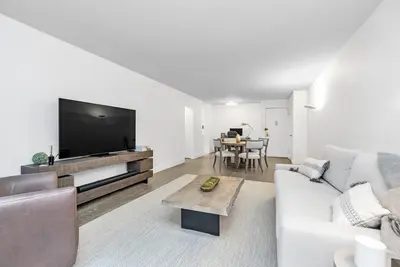


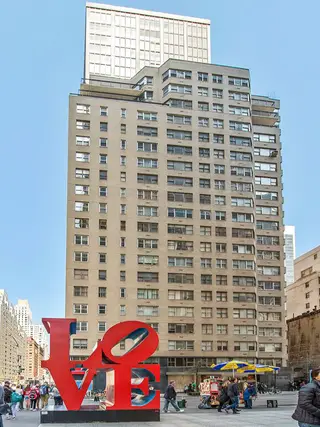
Gallery House is a well-appointed 20-story cooperative located at 77 West 55th Street, completed in 1962. Designed by Horace Ginsbern & Associates, the building comprises 186 units and features a variety of amenities that enhance the living experience for residents.
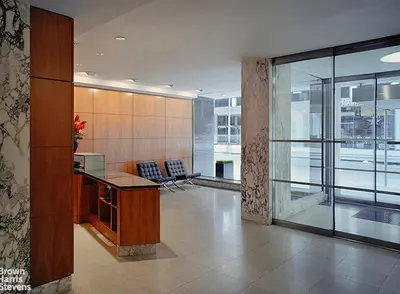
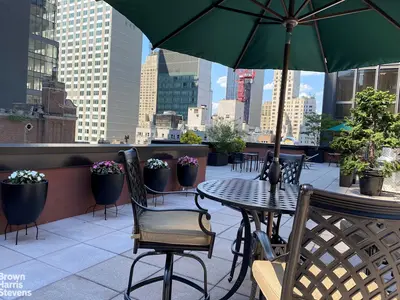
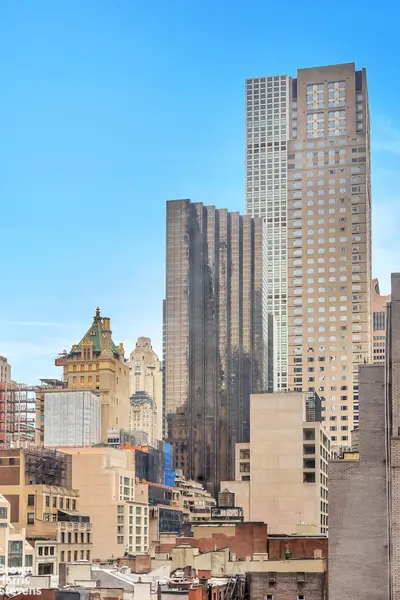
The building offers a 24-hour doorman and concierge service, a live-in superintendent, and convenient laundry facilities equipped with new machines. Residents can enjoy a beautifully landscaped roof deck, which provides breathtaking views of the skyline and Central Park. Additional amenities include storage options and a pet-friendly policy that accommodates pets up to 50 pounds.
Gallery House is situated in a prime location just south of Central Park, providing easy access to world-class dining, shopping along Fifth Avenue, and cultural landmarks such as Carnegie Hall and the Museum of Modern Art. The building’s proximity to the Theater District and various transportation options—including the N, Q, R, W, A, C, B, D, and 1 subway lines—makes it an ideal choice for both full-time residents and those seeking a pied-à-terre in New York City.
Notably, the building has housed famous residents, including Paul Desmond, the acclaimed alto saxophonist known for his work with the Dave Brubeck Quartet. With its combination of modern amenities and a vibrant location, Gallery House remains a desirable address in Manhattan.


View school info, local attractions, transportation options & more.
Experience amazing 3D aerial maps and fly throughs.
Broker & Buyer Comments