The Westmore, 333 West 57th Street - Midtown West
- Apartments
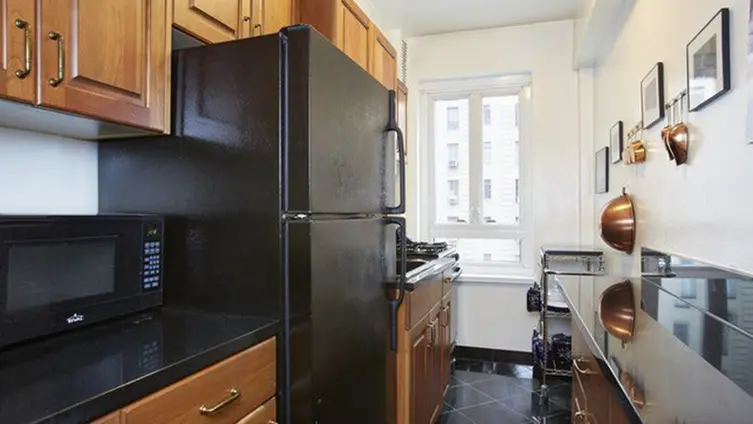
- Overview & Photos
- Maps
- Floorplans
- Sales Data & Comps
- Similar Buildings
- All Units
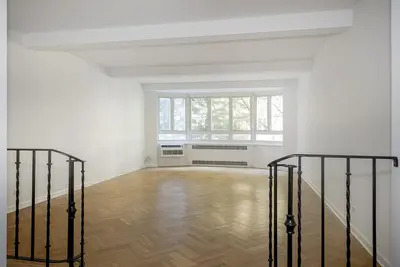
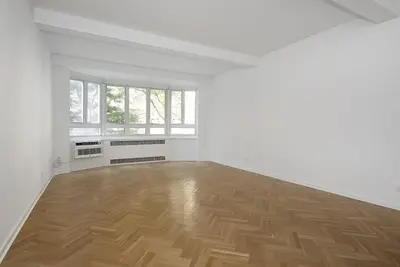
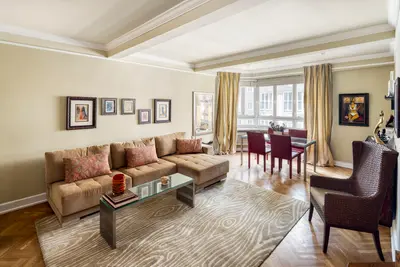


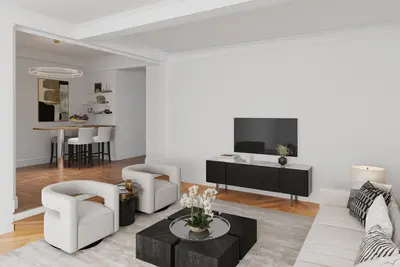


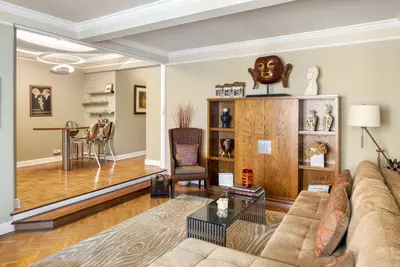

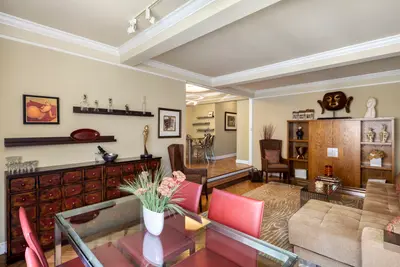
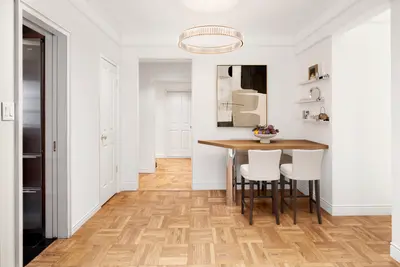
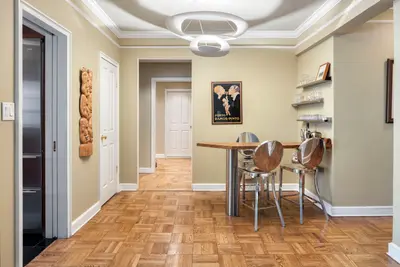


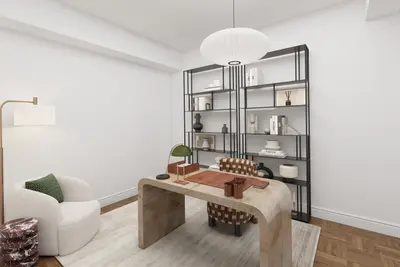


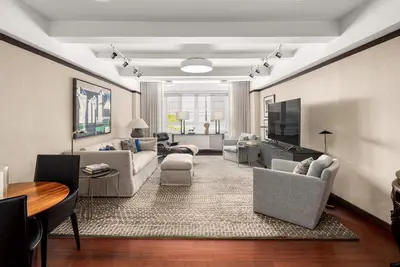
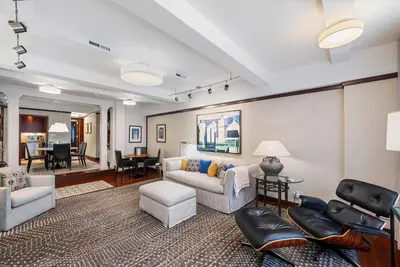
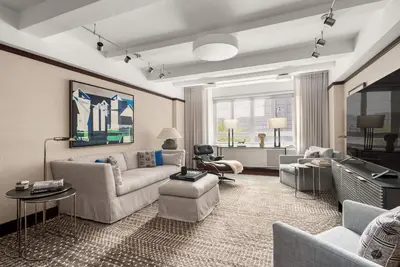
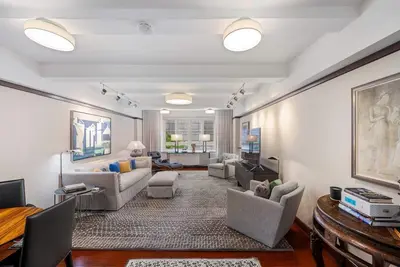
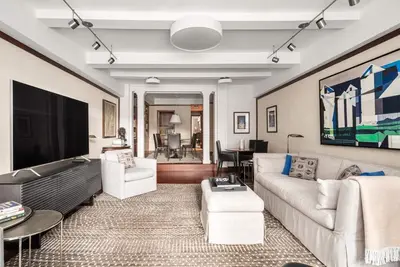
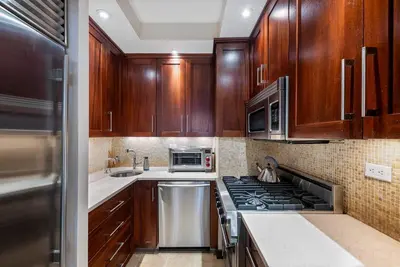
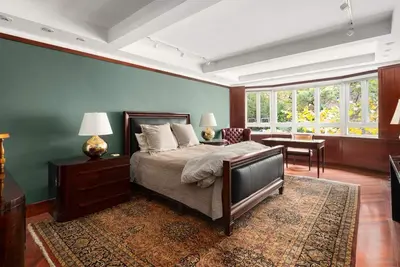
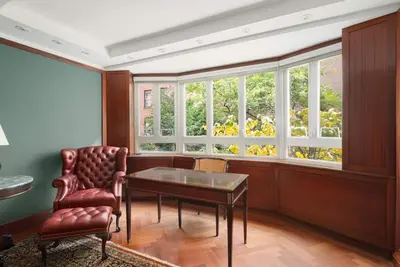


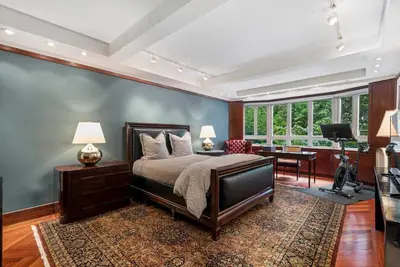

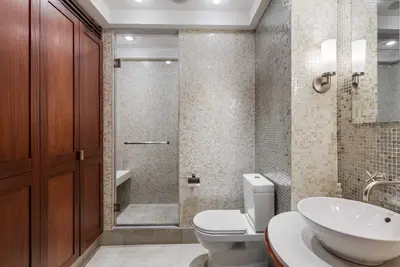
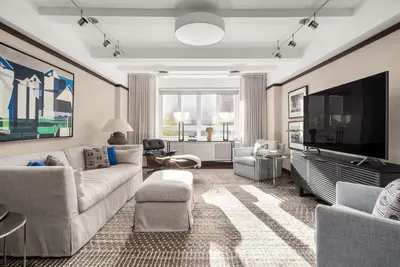
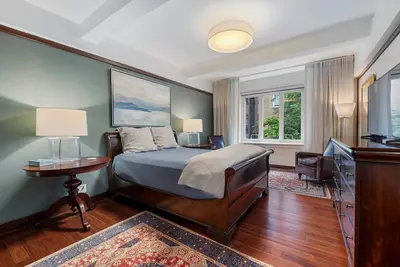
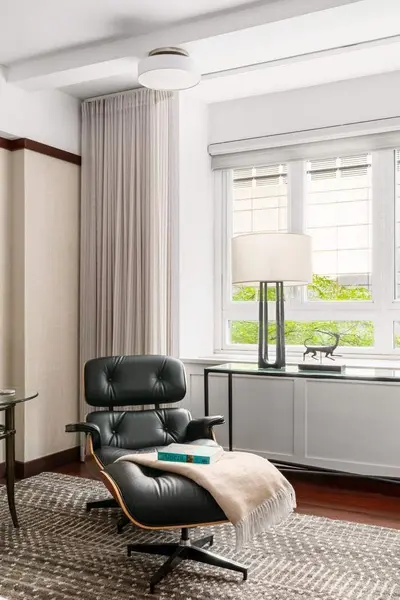

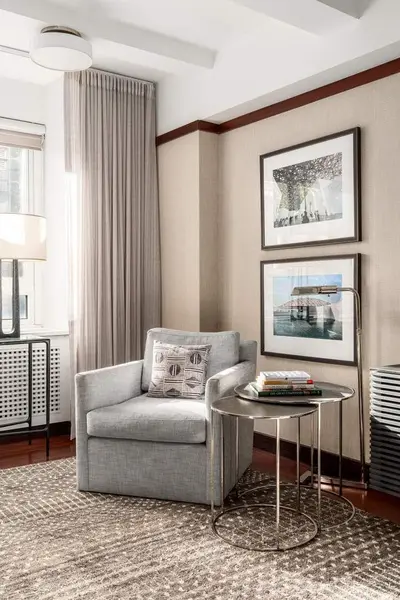


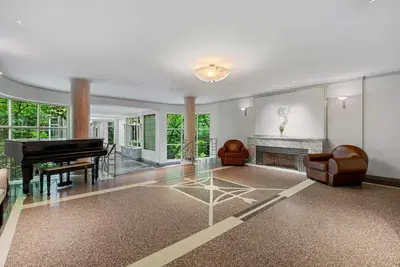
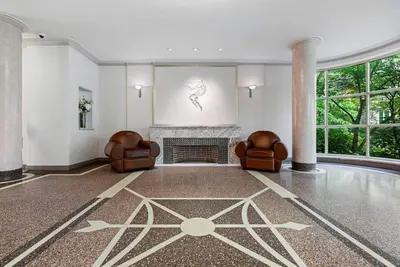
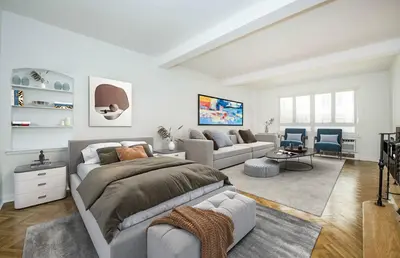
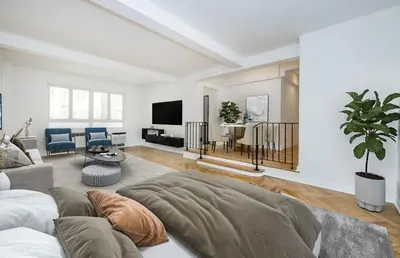
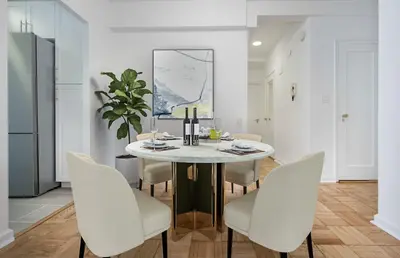
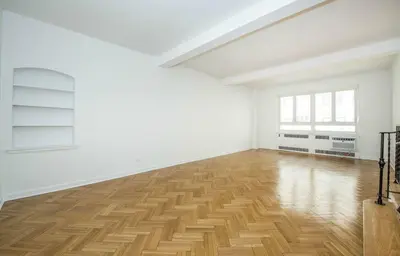
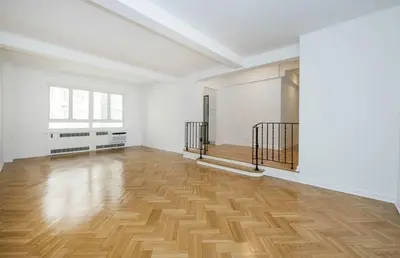
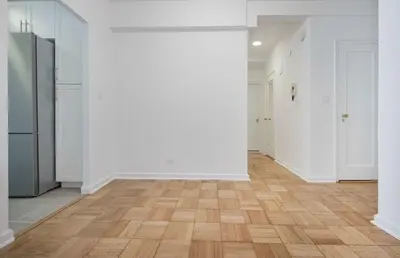


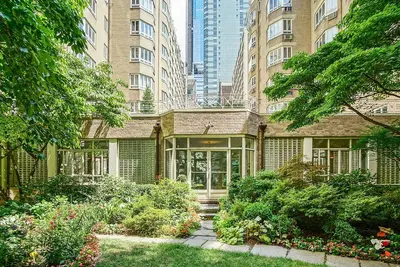


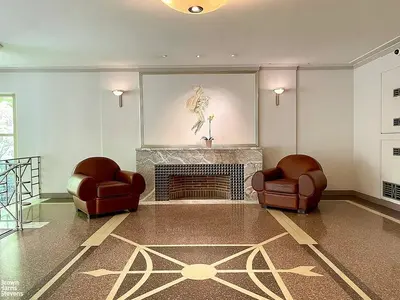


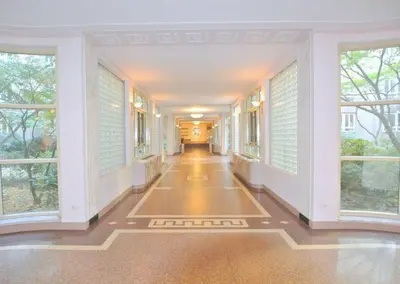
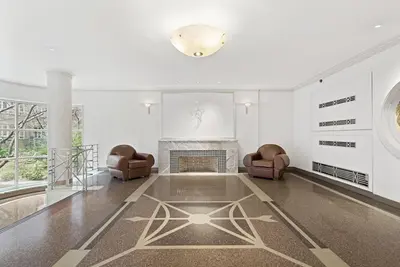
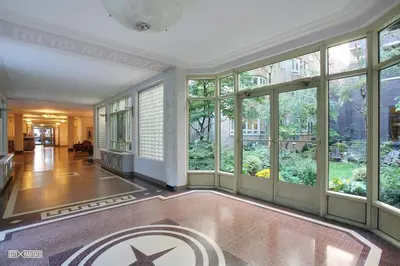


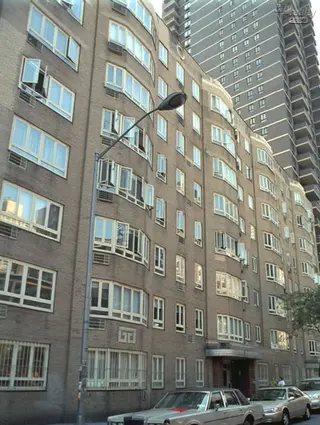
The Westmore, an 8-story Art Deco building at 333 West 57th Street, features 170 units in a unique condop structure that combines co-op ownership with condominium-style bylaws. Designed by architectural firm Boak & Paris, the building showcases classic pre-war details including a restored Art Deco marble lobby and interior English gardens.
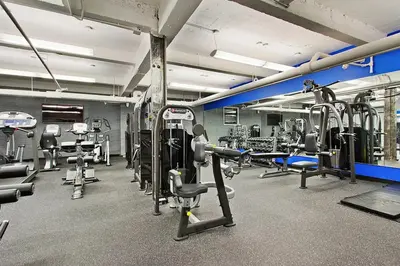
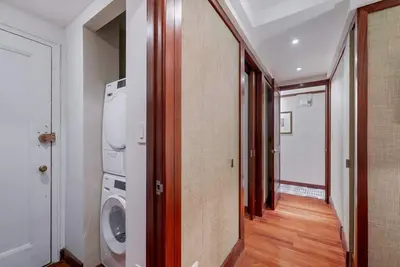
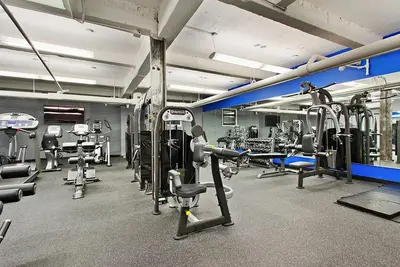
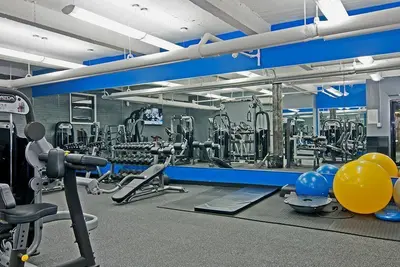
The building offers extensive amenities including two furnished roof terraces with BBQ grills, a fitness center, central laundry facilities, and storage options. The full-service staff includes 24-hour doormen, porters, and a live-in resident manager. The property features convenient dual entrances on both 57th and 58th Streets.
Situated near Columbus Circle, the building provides liberal ownership policies including unlimited subletting from day one, pet-friendly accommodations, and acceptance of LLCs, gifting, and guarantors. Its location offers easy access to Central Park, Lincoln Center, Carnegie Hall, the Theater District, and multiple subway lines, placing residents within reach of New York's premier cultural, entertainment, and shopping destinations.


View school info, local attractions, transportation options & more.
Experience amazing 3D aerial maps and fly throughs.
For some co-ops, instead of price per square foot, we use an estimate of the number of rooms for each sold apartment to chart price changes over time. This is because many co-op listings do not include square footage information, and this makes it challenging to calculate accurate square-foot averages.
By displaying the price per estimated room count, we are able to provide a more reliable and consistent metric for comparing sales in the building. While we hope that this gives you a clearer sense of price trends in the building, all data should be independently verified. All data provided are only estimates and should not be used to make any purchase or sale decision.