Shh... Many units sell without being publicly listed.
Looking for something special? Select off-market options at The Byron may be available – connect with us for access.
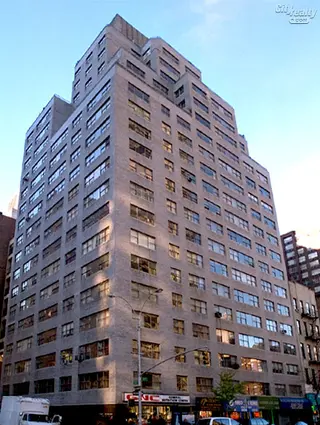

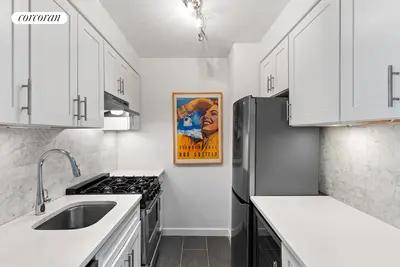
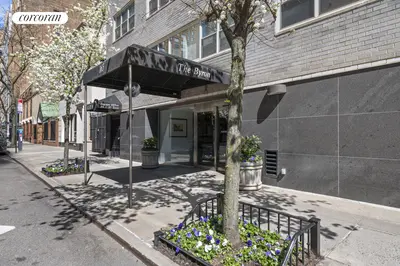
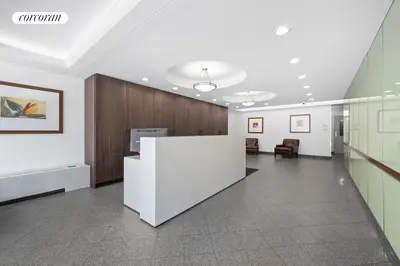
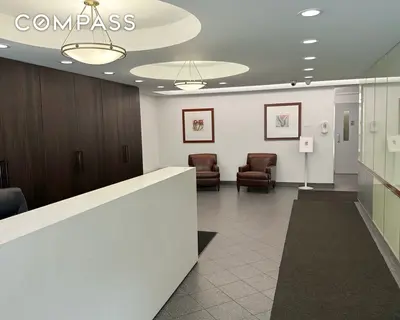
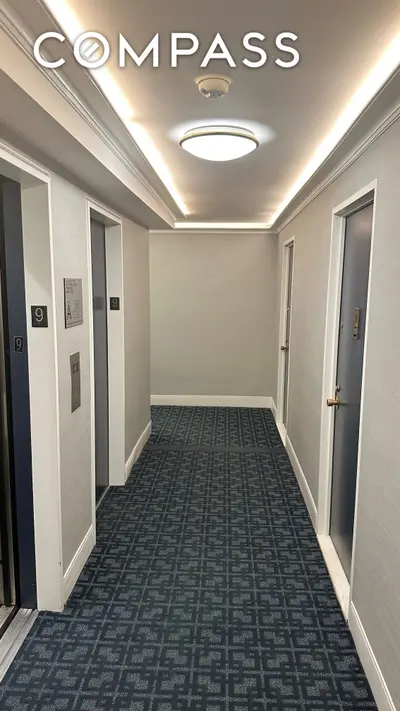

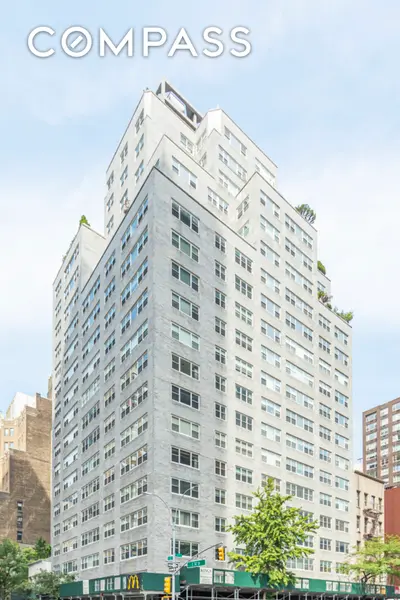
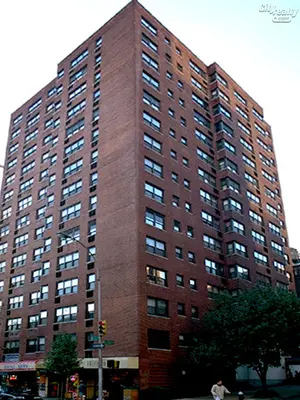
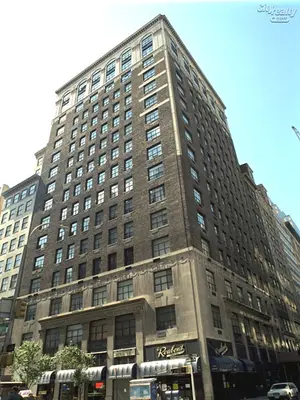
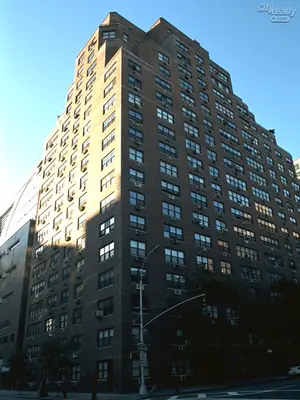
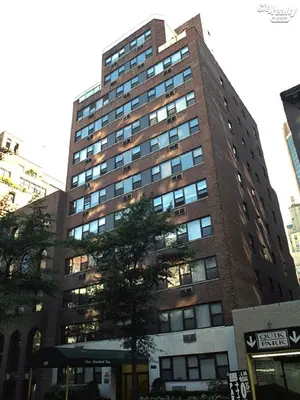
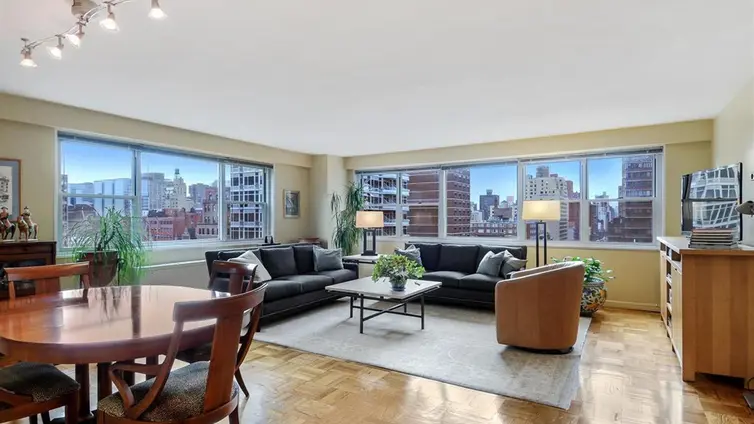
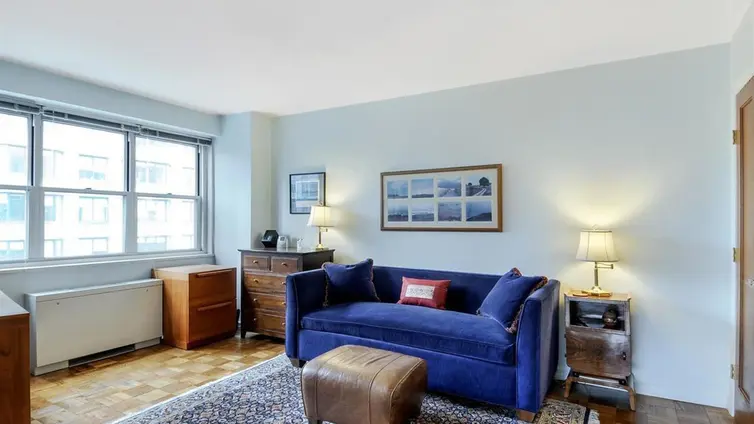
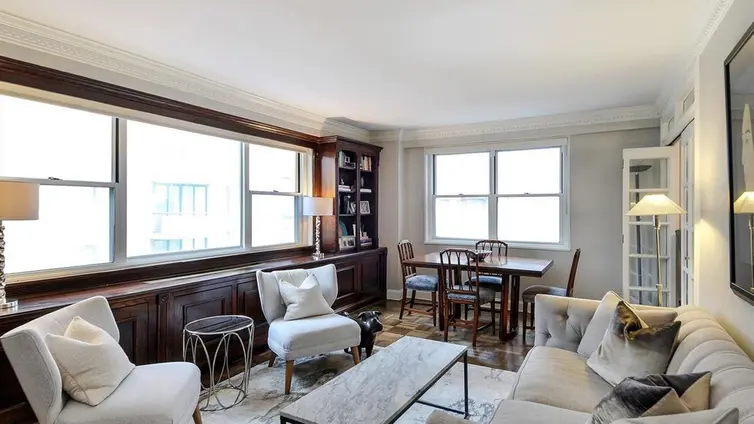
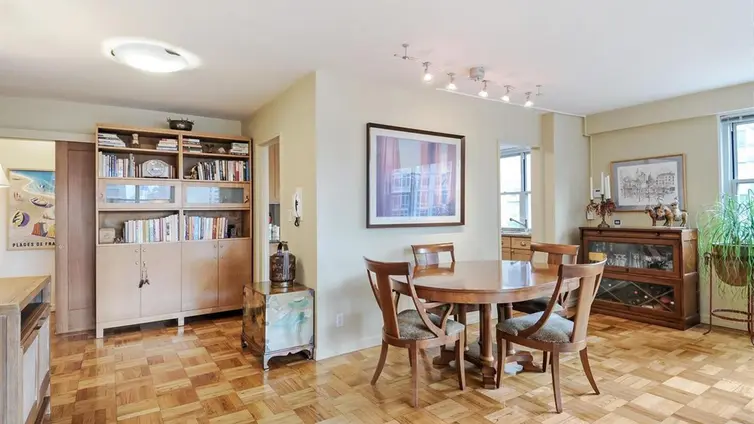
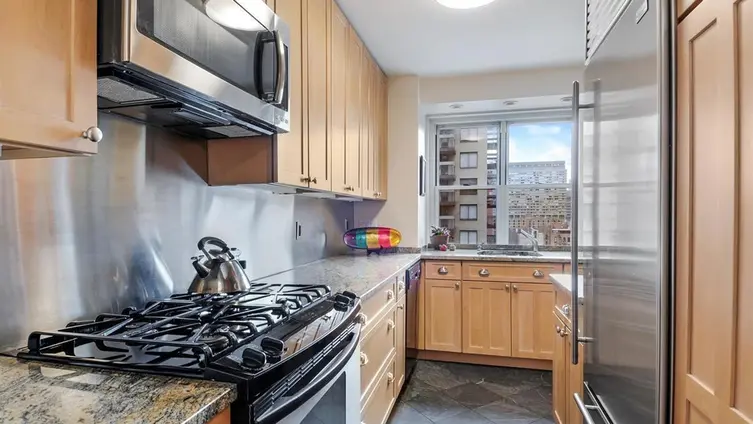
The Byron, built in 1964 and converted to a cooperative in 1984, is a 20-story residential building located in the Kips Bay/Murray Hill area of Manhattan. The full-service building contains 134 units and features a 24-hour doorman, live-in superintendent, and recently renovated lobby and hallways.
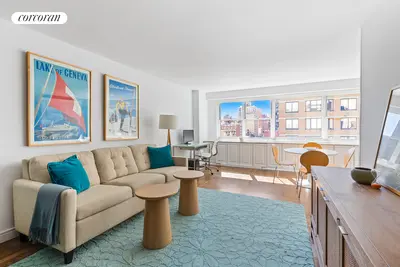
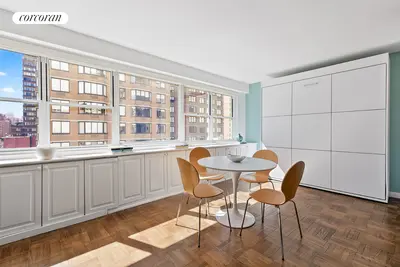
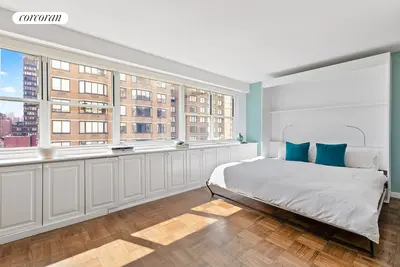
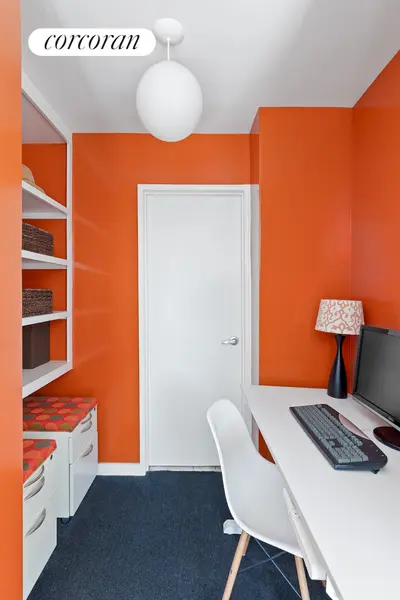
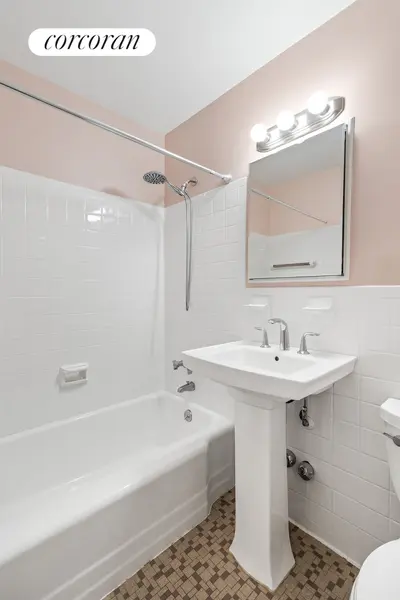
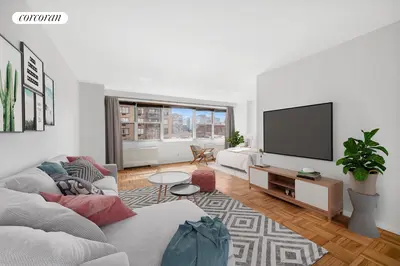
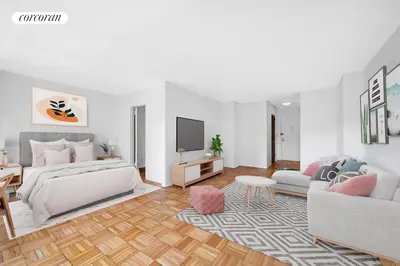
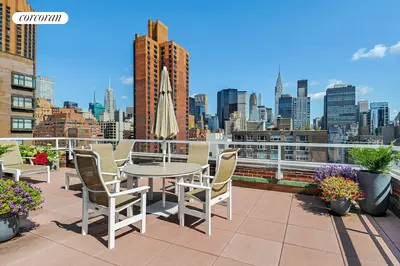
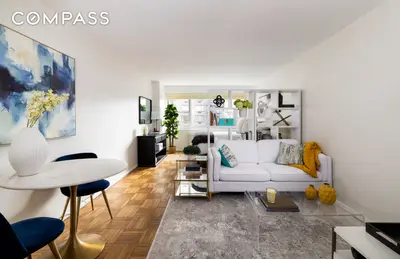
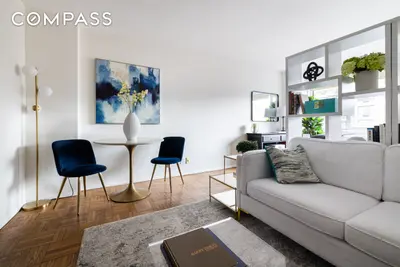
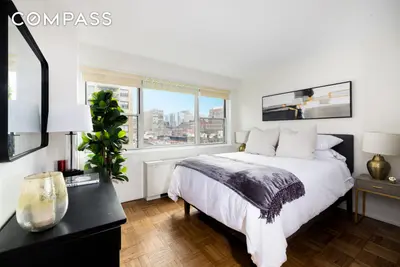
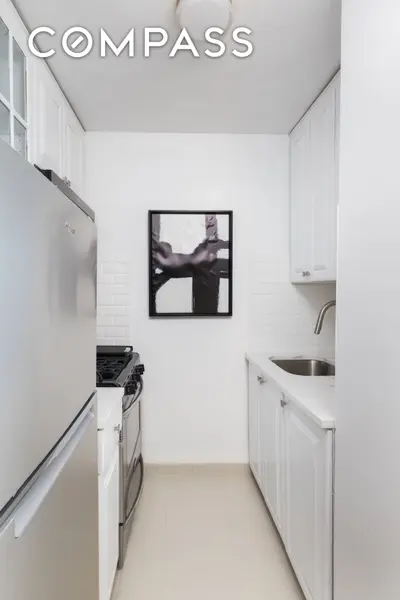
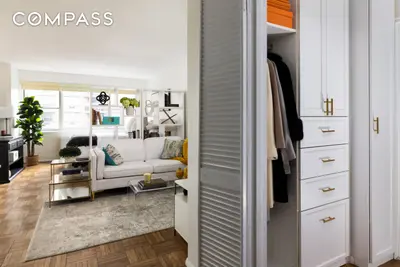
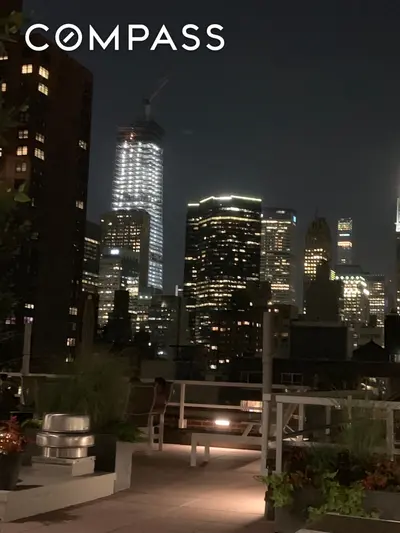
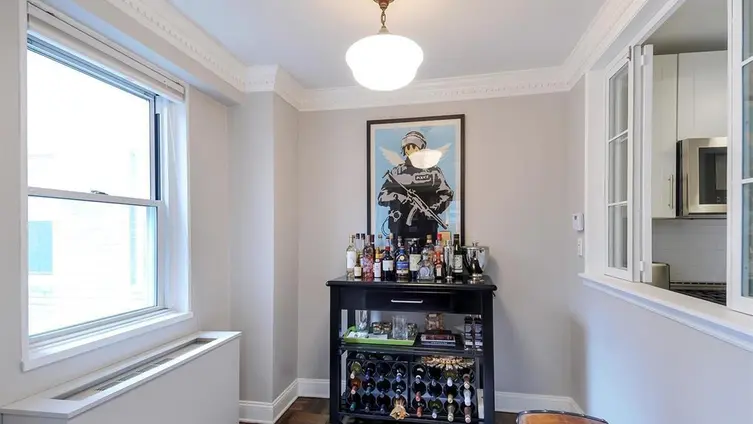
Residents enjoy several amenities including a landscaped roof deck with panoramic city views, central laundry facilities, bike storage, and individual storage units. The building is known for its spacious apartments, ranging from studios to two-bedrooms, many featuring generous closet space and good natural light. Some units offer views of iconic landmarks including the Empire State Building.
Situated in a highly convenient location, The Byron is one block from the 6 train and within walking distance to Grand Central Terminal. The immediate neighborhood offers excellent amenities including Trader Joe's across the street, along with easy access to Fairway and Whole Foods. The co-op is pet-friendly and allows pied-a-terre, co-purchasing, and gifting, with 75% financing permitted. Maintenance includes HVAC costs, and residents can opt into a bulk cable/internet rate program.
Looking for something special? Select off-market options at The Byron may be available – connect with us for access.

View school info, local attractions, transportation options & more.
Experience amazing 3D aerial maps and fly throughs.
For some co-ops, instead of price per square foot, we use an estimate of the number of rooms for each sold apartment to chart price changes over time. This is because many co-op listings do not include square footage information, and this makes it challenging to calculate accurate square-foot averages.
By displaying the price per estimated room count, we are able to provide a more reliable and consistent metric for comparing sales in the building. While we hope that this gives you a clearer sense of price trends in the building, all data should be independently verified. All data provided are only estimates and should not be used to make any purchase or sale decision.
|
Year
Avg Price / Ft2 (Est)
Median Price / Ft2 (Est)
Avg. Actual Price
Med. Actual Price
Transactions
2025
-
-
-
-
0
2024
$883
$747,143
$892
$745,000
7
2023
$831
$688,800
$831
$689,000
5
2022
$1,006
$916,000
$931
$815,000
5
2021
$939
$933,444
$927
$750,000
9
2020
$1,088
$1,216,667
$1,088
$1,345,000
3
2019
-
$795,667
-
$780,000
3
2018
-
$457,500
-
$457,500
2
2017
$929
$818,857
$916
$865,000
7
2016
$973
$770,813
$961
$732,500
8
2015
$964
$716,625
$874
$544,500
8
2014
$856
$853,429
$792
$695,000
14
|
Year
Avg Price / Ft2 (Est)
Median Price / Ft2 (Est)
Avg. Actual Price
Med. Actual Price
Transactions
2013
$663
$527,167
$663
$457,500
6
2012
$702
$608,750
$672
$421,500
8
2011
$697
$667,400
$703
$640,000
5
2010
$798
$698,333
$798
$505,000
3
2009
$636
$591,333
$635
$562,500
6
2008
$789
$592,250
$783
$652,500
4
2007
$846
$854,866
$807
$899,000
5
2006
$815
$646,400
$794
$555,000
7
2005
$794
$607,643
$727
$500,000
7
2004
$549
$404,214
$525
$379,000
7
2003
$511
$513,571
$514
$435,000
7
Please note that price/ft2 calculations is from only 61% of total transactions during the period
|
the following is a slider of images. For screen reader users, all slides are visible at all time so you may ignore control buttons.
Sign-up and we'll email you new listings in this building!
Whether you’re a buyer, investor, or simply curious, this report is your key to unlocking in-depth insights and analysis on .
Please confirm your details: