Shh... Many units sell without being publicly listed.
Looking for something special? Select off-market options at 350 Bleecker Street may be available – connect with us for access.
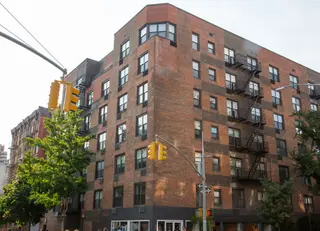
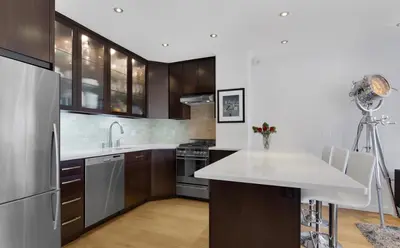
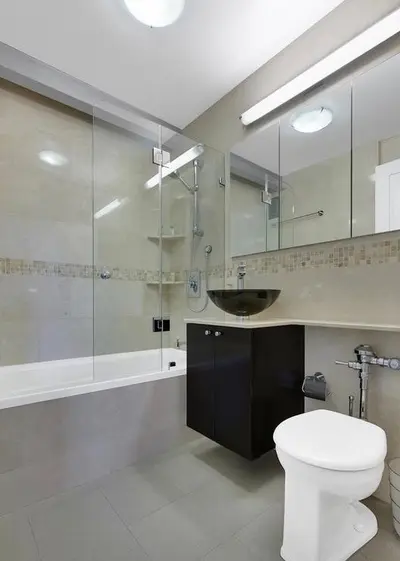
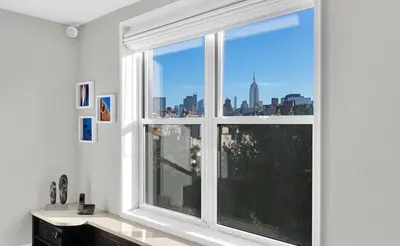
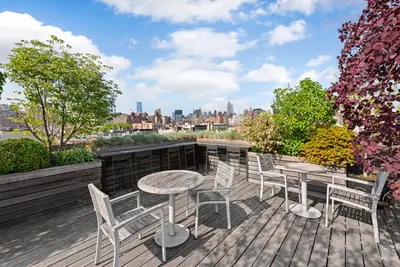
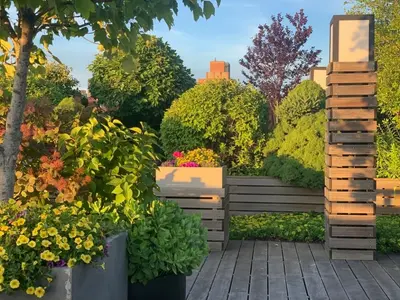
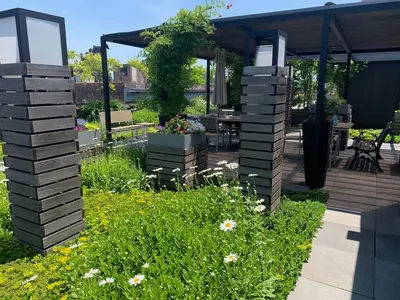
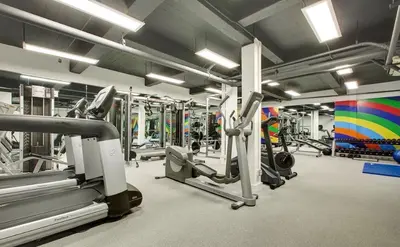
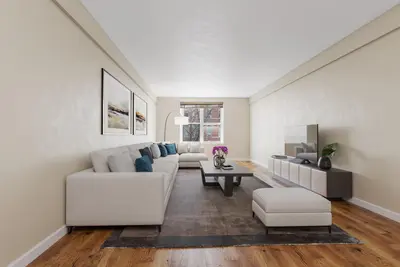
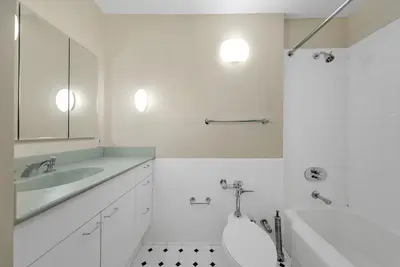
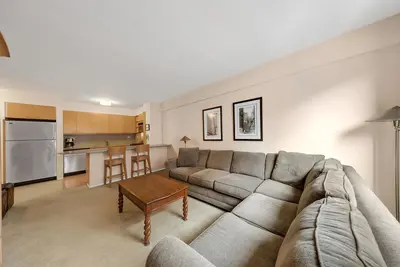
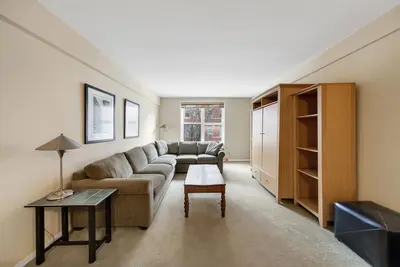
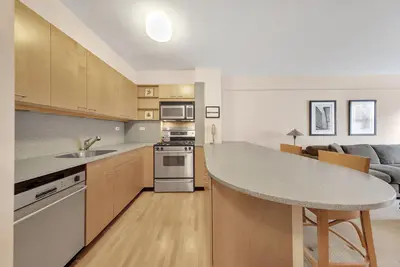
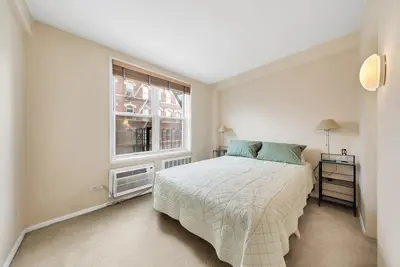
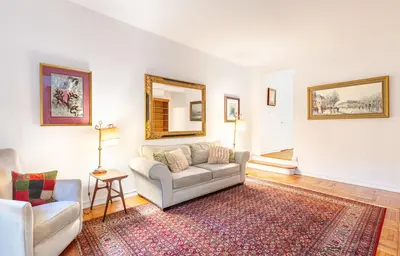
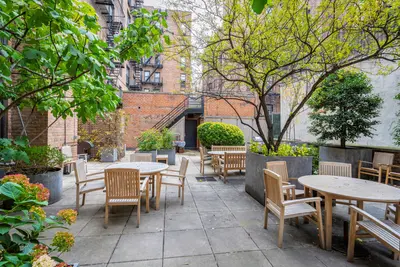
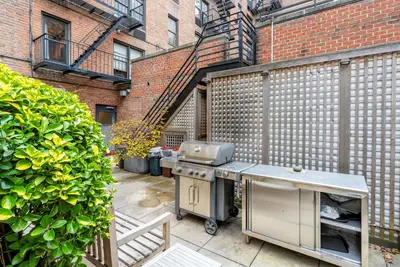
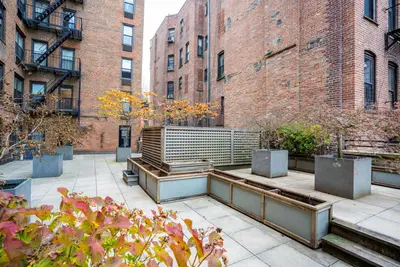
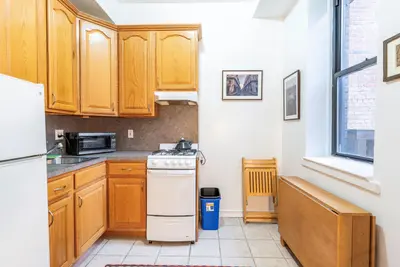
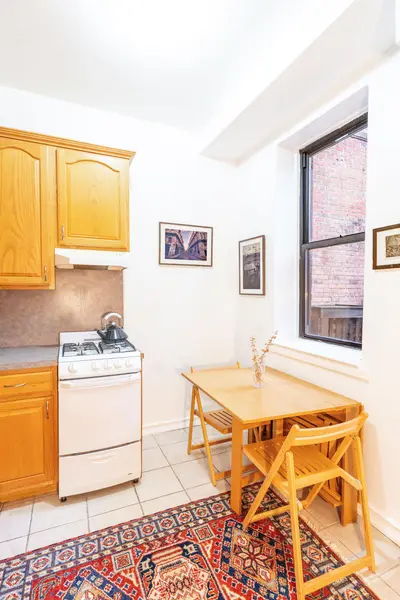
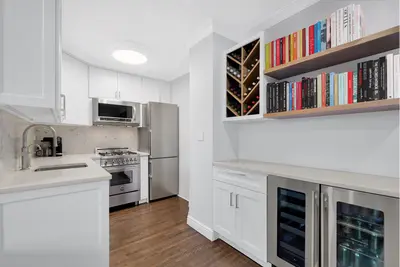
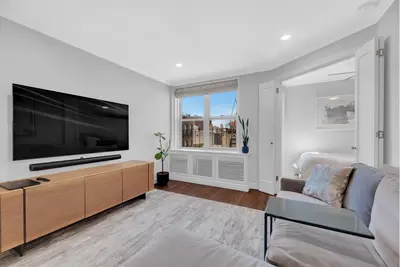
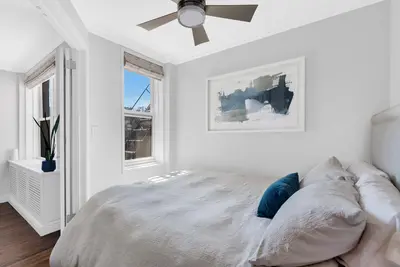
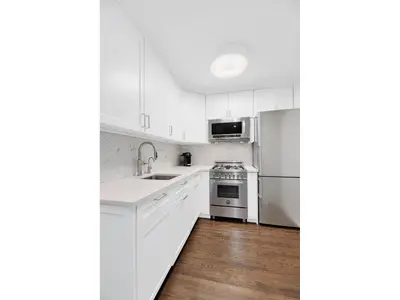
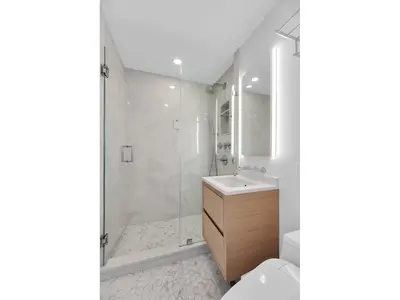
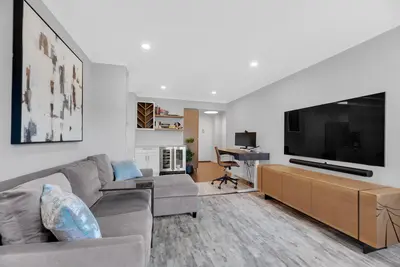
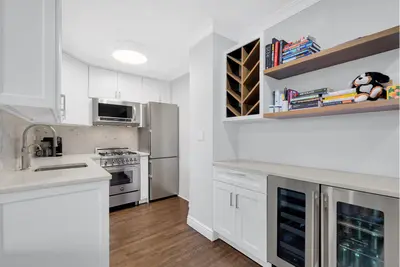
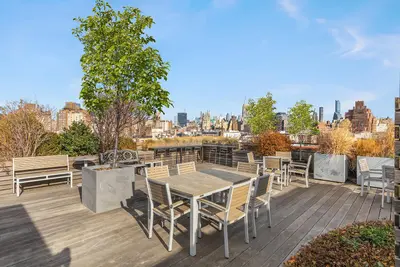
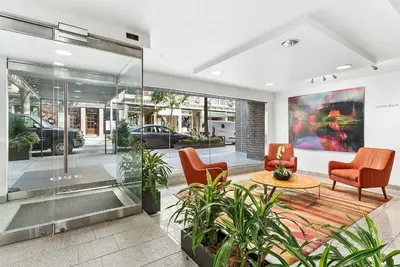
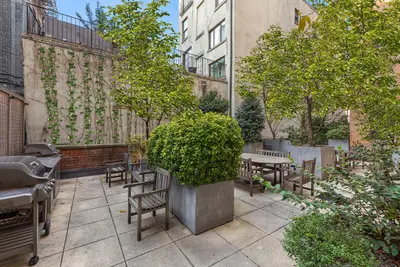
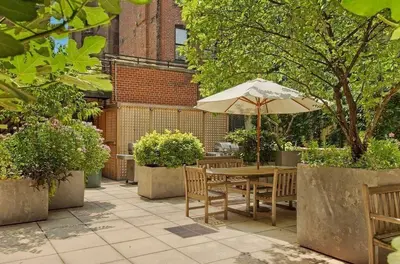
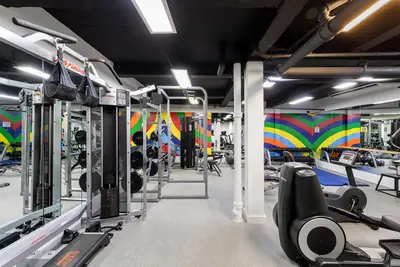
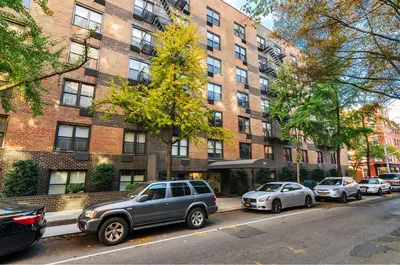
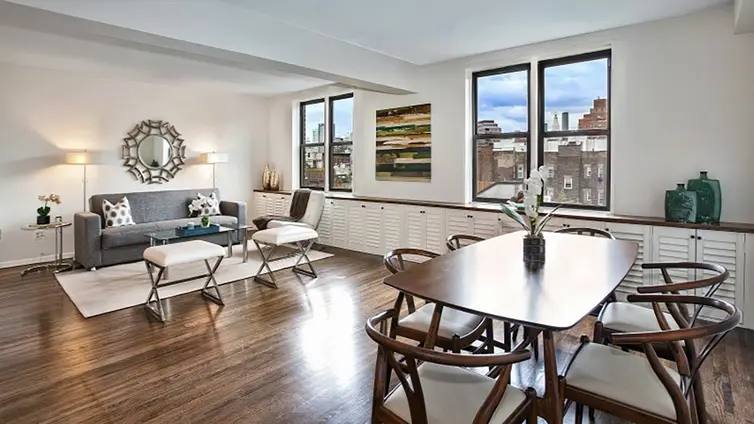
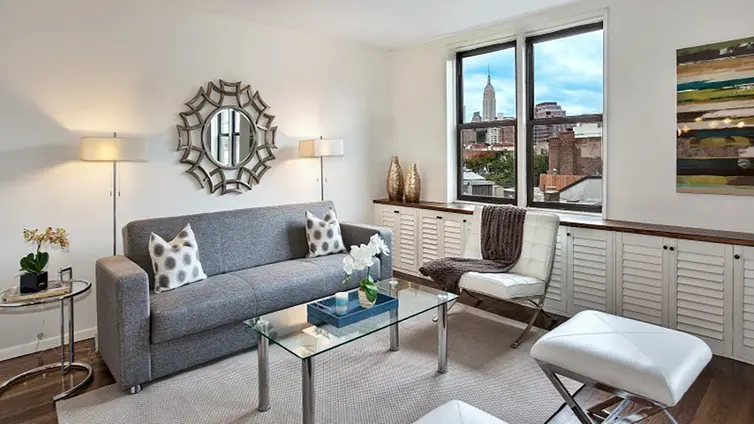
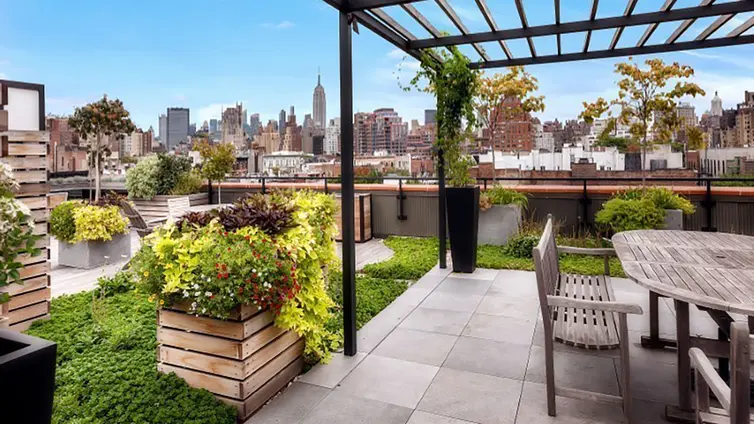
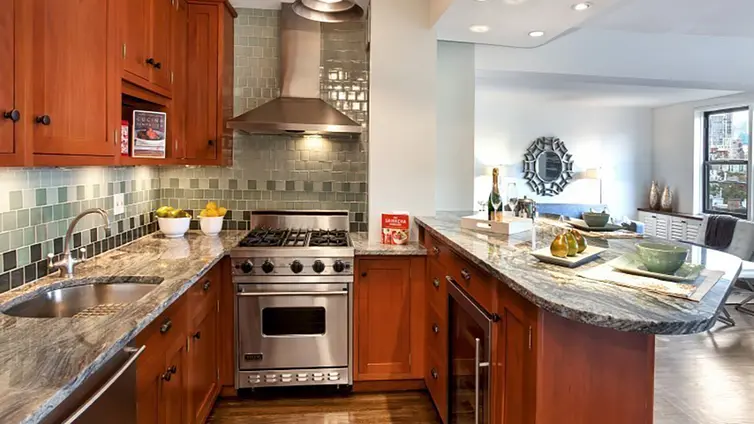
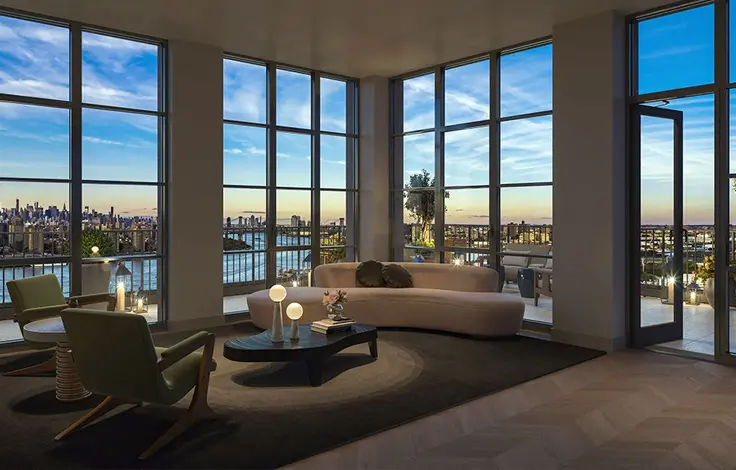
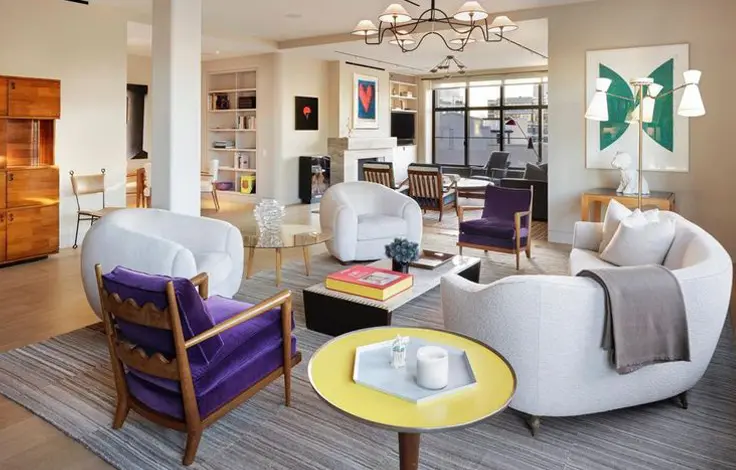
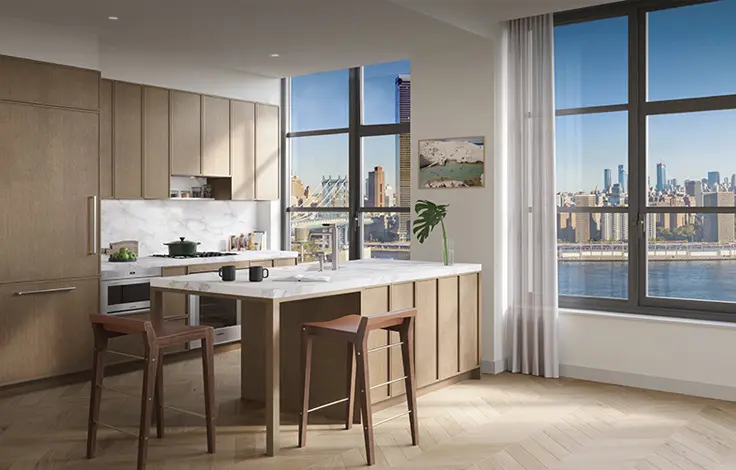
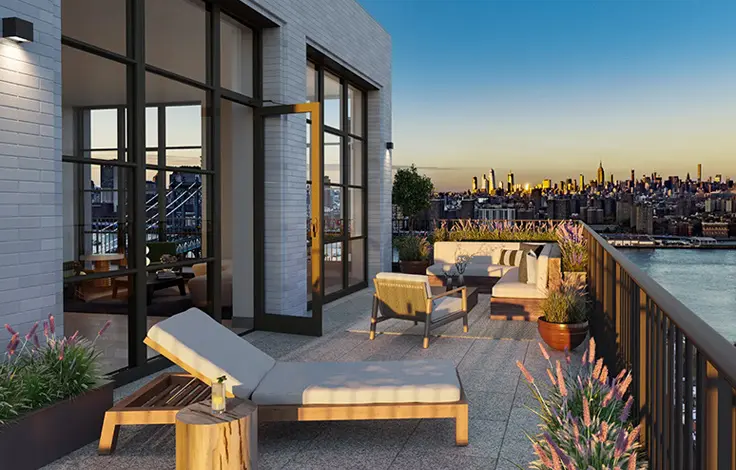
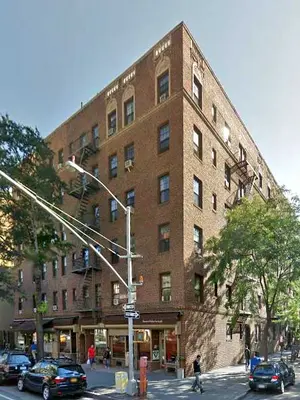
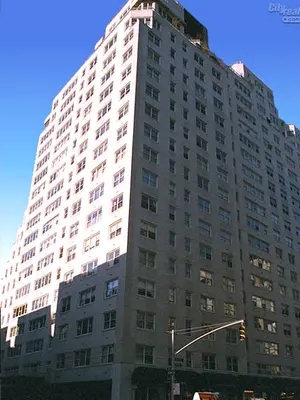
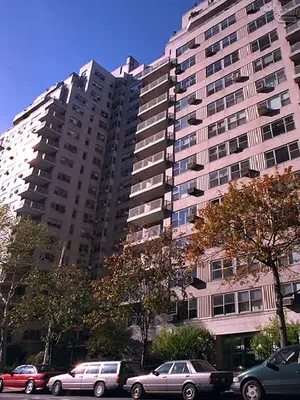
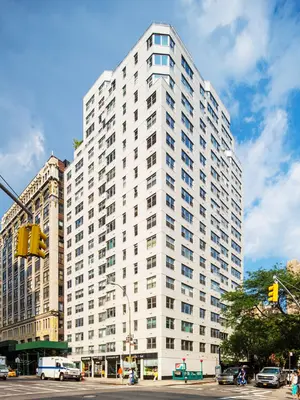
350 Bleecker Street is a post-war cooperative finished in 1962, measuring 7 stories and 137 units. The pet-friendly building is staffed by a doorman and live-in superintendent, and residents enjoy a warm and friendly community that hosts summer rooftop parties and holiday get-togethers. Amenities include a gym, bike room, storage, a rooftop garden with 360-degree views, and a courtyard with picnic tables, umbrellas, and two gas grills. Located between West 10th Street and Charles Street, it is well situated in the heart of the West Village and surrounded by elegant architecture, many luxury brands' flagship stores, restaurants in all directions, Hudson River Park, and the Saturday farmers' market at Abingdon Square. It is supremely convenient to transportation with the cross-town bus at the corner of 10th Street and the subway 2 blocks away.
Looking for something special? Select off-market options at 350 Bleecker Street may be available – connect with us for access.

View school info, local attractions, transportation options & more.
Experience amazing 3D aerial maps and fly throughs.
For some co-ops, instead of price per square foot, we use an estimate of the number of rooms for each sold apartment to chart price changes over time. This is because many co-op listings do not include square footage information, and this makes it challenging to calculate accurate square-foot averages.
By displaying the price per estimated room count, we are able to provide a more reliable and consistent metric for comparing sales in the building. While we hope that this gives you a clearer sense of price trends in the building, all data should be independently verified. All data provided are only estimates and should not be used to make any purchase or sale decision.
|
Year
Avg Price / Room (Est)
Avg. Actual Price
Med. Actual Price
Transactions
2025
$316,000
$790,000
1
2024
$322,500
$1,317,500
2
2023
$358,333
$1,414,200
5
2022
$338,643
$893,474
8
2021
$346,630
$1,221,663
12
2020
$427,222
$1,823,333
3
2019
$246,889
$653,333
6
2018
$316,088
$1,038,548
8
2017
$375,880
$1,515,250
6
2016
$390,943
$1,583,643
7
2015
$337,800
$1,729,667
3
2014
$307,500
$945,100
4
|
Year
Avg Price / Room (Est)
Avg. Actual Price
Med. Actual Price
Transactions
2013
$346,624
$1,558,500
6
2012
$273,870
$1,224,350
10
2011
$196,911
$522,833
3
2010
$237,458
$681,444
9
2009
$251,771
$927,500
4
2008
$237,246
$1,037,350
4
2007
$238,830
$994,250
12
2006
$215,941
$735,000
9
2005
$190,667
$572,000
1
2004
$149,704
$546,150
10
2003
$125,856
$392,385
13
|
the following is a slider of images. For screen reader users, all slides are visible at all time so you may ignore control buttons.
Sign-up and we'll email you new listings in this building!
Whether you’re a buyer, investor, or simply curious, this report is your key to unlocking in-depth insights and analysis on .
Please confirm your details:


Broker & Buyer Comments