Shh... Many units sell without being publicly listed.
Explore off-market possibilities at Gilsey House – inquire to find out about residences with owners open to private offers!
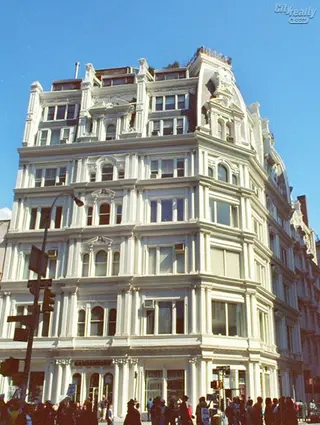
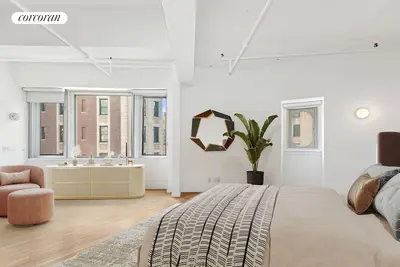
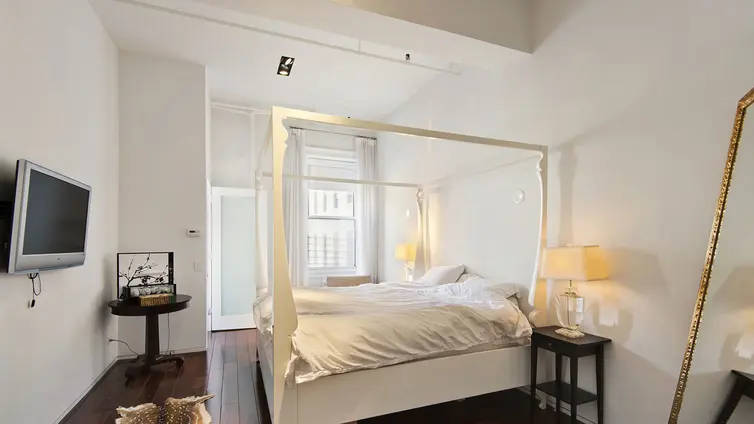
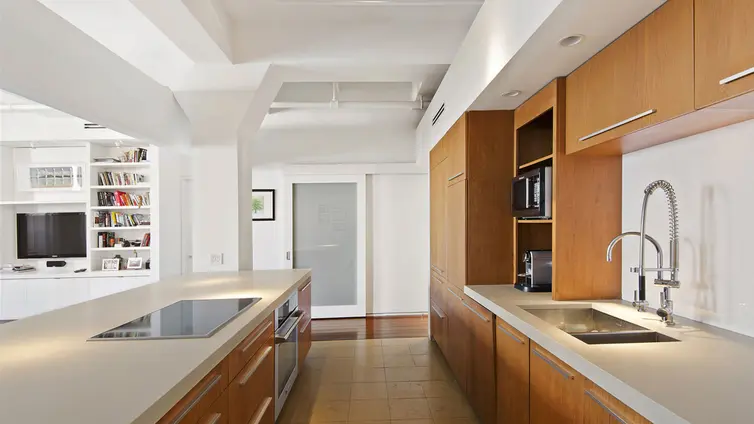
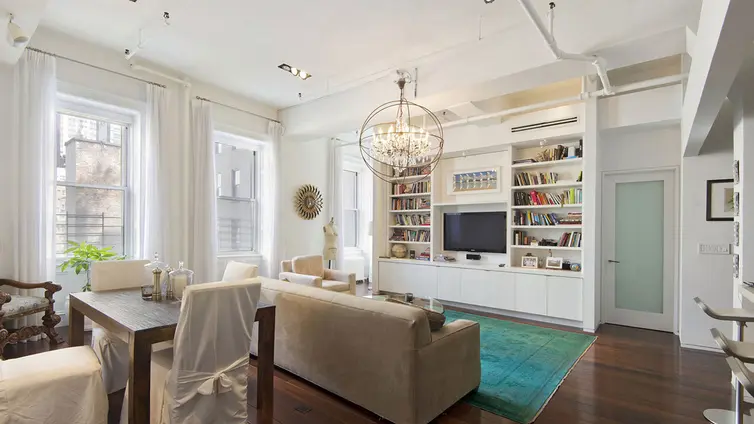
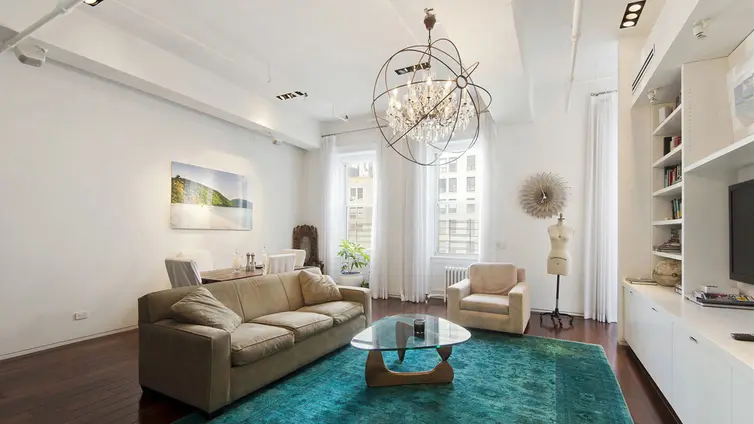
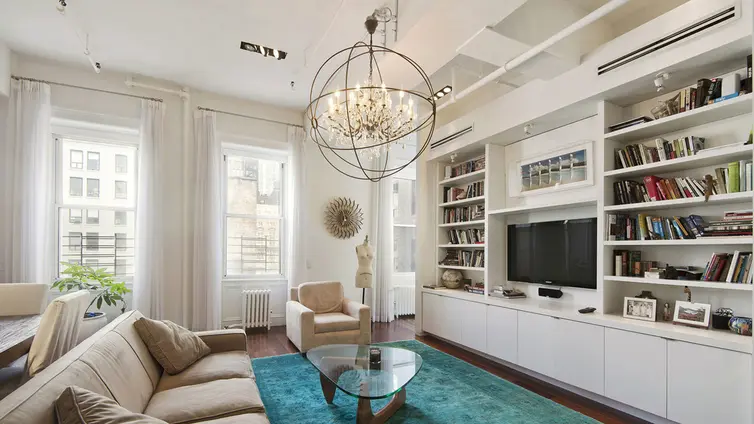
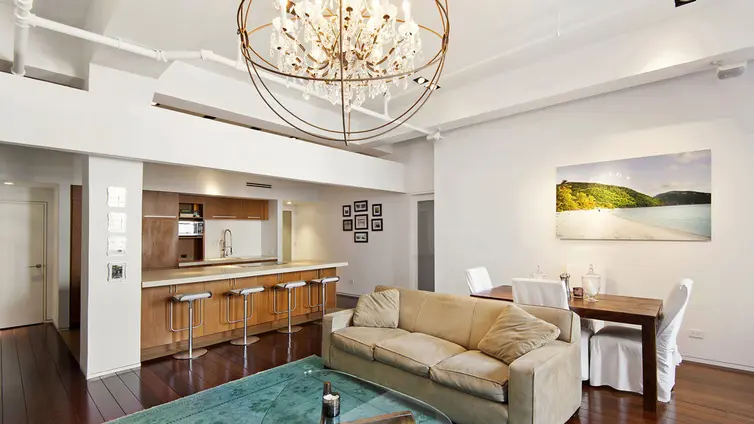
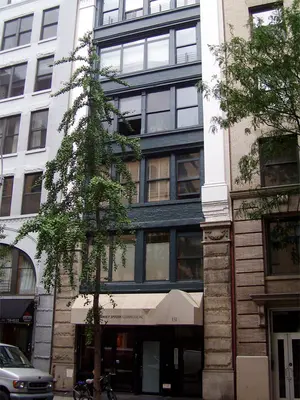
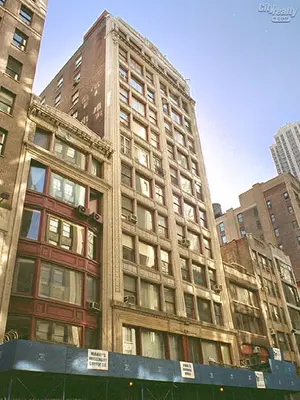
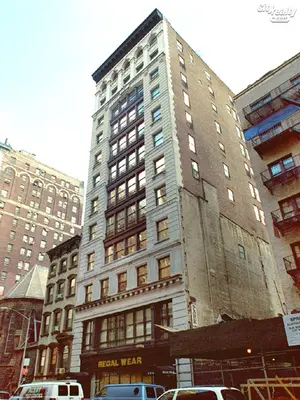
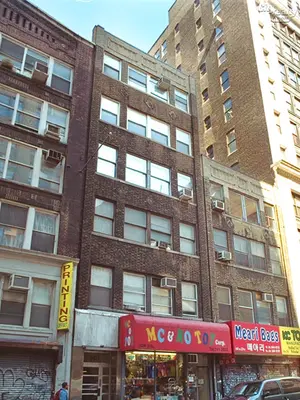
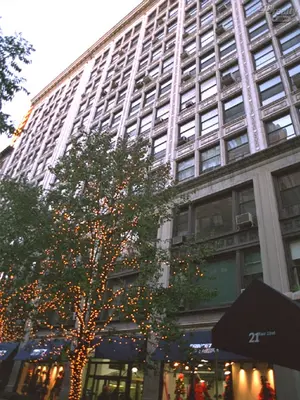
The Gilsey House at 1200 Broadway stands as one of New York City's most impressive Second Empire cast-iron buildings. Designed by Stephen Decatur Hatch for Peter Gilsey and constructed between 1869-1871, the building features a distinctive Second Empire Baroque style façade by Daniel D. Badger, complete with mansard roof, ornate details, and a clock supported by mermaid figures. When it opened as a hotel in 1872, its 300 rooms were adorned with rosewood and walnut finishes, marble fireplaces, and bronze-gilt chandeliers. The hotel's silver dollar bar became a worldwide destination, attracting notable guests including Mark Twain, Oscar Wilde, and Diamond Jim Brady.
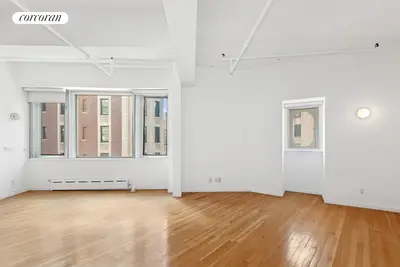
The building's history reflects the evolution of its neighborhood, transitioning from a luxury hotel to loft space in 1911 as the area became part of the Garment Center. In 1980, it was converted into a 40-unit residential cooperative. The building underwent various restorations, including façade work in 2023, preserving its architectural significance while adapting to modern use. The Gilsey House was designated a New York City Landmark in 1979.
Now situated in Manhattan's NoMad district, the eight-story building maintains its historic character while offering contemporary amenities including a full-time superintendent, porters, keyed elevators, bike storage, and laundry facilities. The location provides easy access to Madison Square Park, numerous hotels, restaurants, and shopping options, with convenient proximity to multiple subway lines.
Explore off-market possibilities at Gilsey House – inquire to find out about residences with owners open to private offers!

View school info, local attractions, transportation options & more.
Experience amazing 3D aerial maps and fly throughs.
For some co-ops, instead of price per square foot, we use an estimate of the number of rooms for each sold apartment to chart price changes over time. This is because many co-op listings do not include square footage information, and this makes it challenging to calculate accurate square-foot averages.
By displaying the price per estimated room count, we are able to provide a more reliable and consistent metric for comparing sales in the building. While we hope that this gives you a clearer sense of price trends in the building, all data should be independently verified. All data provided are only estimates and should not be used to make any purchase or sale decision.
|
Year
Avg Price / Ft2 (Est)
Median Price / Ft2 (Est)
Avg. Actual Price
Med. Actual Price
Transactions
2025
-
-
-
-
0
2024
$1,081
$4,585,000
$1,081
$4,585,000
1
2023
-
-
-
-
0
2022
$966
$2,149,626
$966
$2,095,000
3
2021
$1,039
$2,425,000
$1,039
$2,425,000
1
2020
-
-
-
-
0
2019
-
$1,875,000
-
$1,875,000
1
2018
$886
$2,494,333
$886
$2,550,000
3
2017
-
-
-
-
0
2016
-
$2,000,000
-
$2,000,000
1
2015
$1,300
$3,645,000
$1,312
$2,865,000
5
2014
$1,270
$2,300,000
$1,270
$2,300,000
2
|
Year
Avg Price / Ft2 (Est)
Median Price / Ft2 (Est)
Avg. Actual Price
Med. Actual Price
Transactions
2013
$933
$1,900,000
$933
$1,900,000
1
2012
$838
$1,675,500
$838
$1,675,500
2
2011
$743
$1,927,567
$743
$1,357,700
3
2010
$761
$1,486,250
$739
$1,522,500
4
2009
-
-
-
-
0
2008
-
$1,250,000
$1,250,000
1
2007
-
-
-
-
0
2006
$795
$1,470,000
$795
$1,470,000
1
2005
$597
$1,266,000
$642
$1,300,000
3
2004
$509
$1,087,250
$450
$1,062,000
4
2003
$538
$913,000
$538
$913,000
2
Please note that price/ft2 calculations is from only 68% of total transactions during the period
|
the following is a slider of images. For screen reader users, all slides are visible at all time so you may ignore control buttons.
Sign-up and we'll email you new listings in this building!
Whether you’re a buyer, investor, or simply curious, this report is your key to unlocking in-depth insights and analysis on .
Please confirm your details:

Broker & Buyer Comments