Gramercy East, 301 East 22nd Street - Gramercy Park
- Apartments
- Overview & Photos
- Maps
- Floorplans
- Sales Data & Comps
- Similar Buildings
- All Units
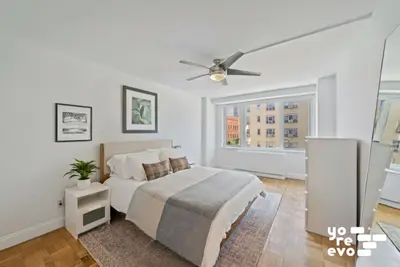

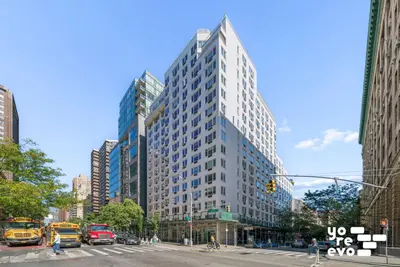
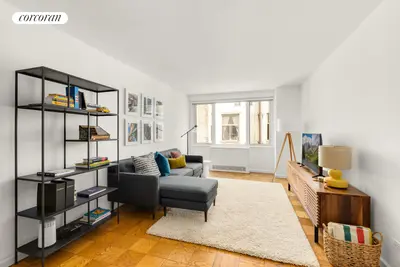
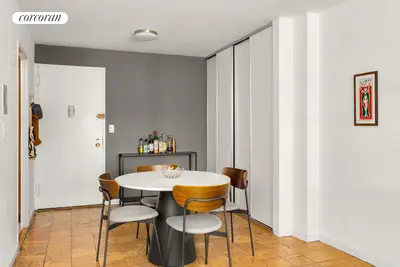
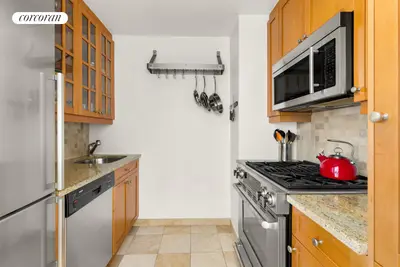


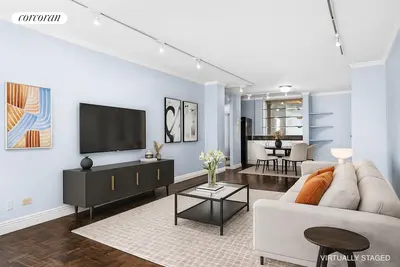
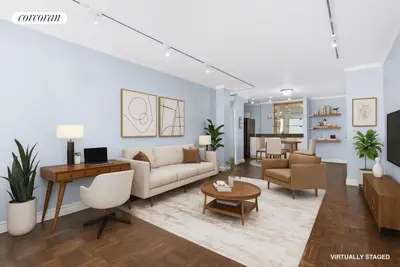

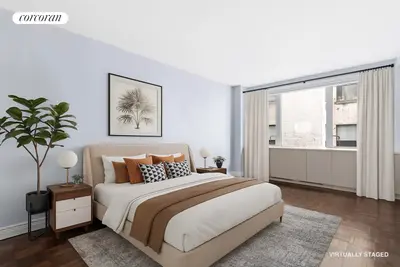
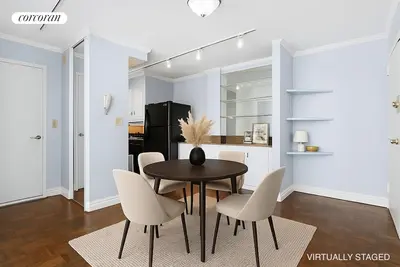
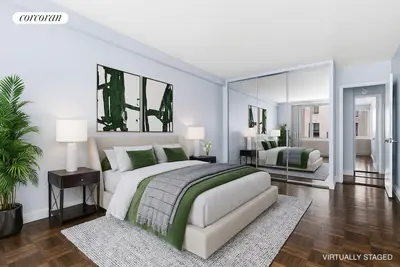


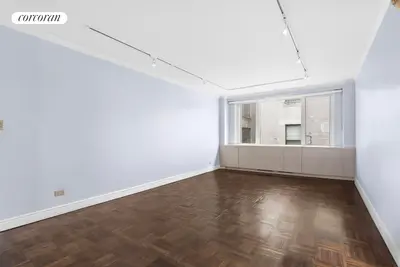

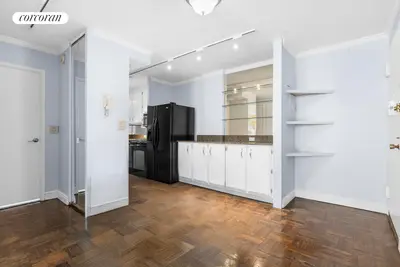
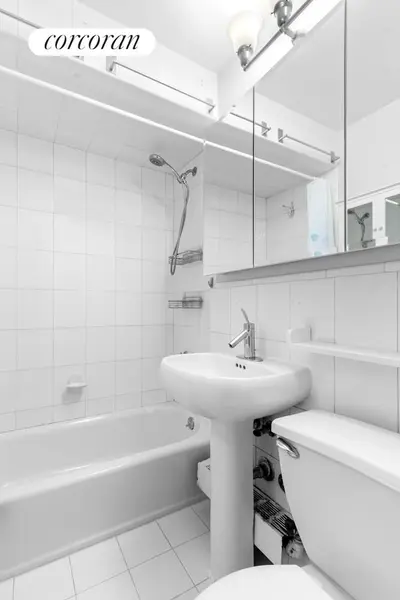
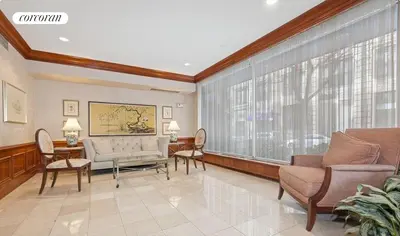


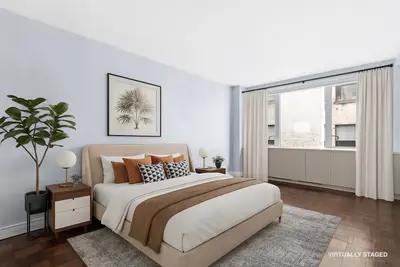


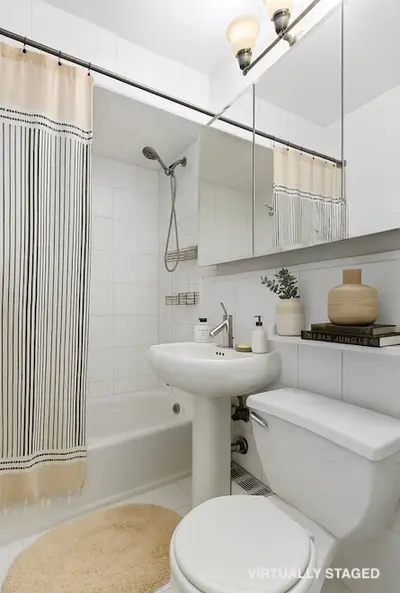
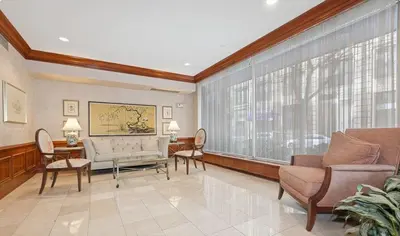
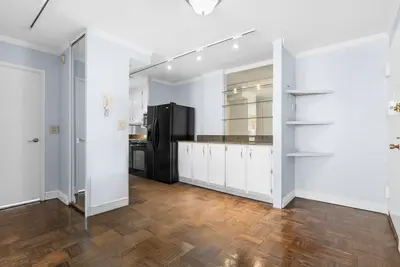

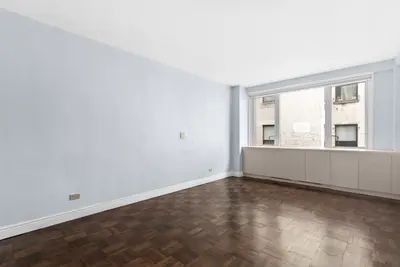


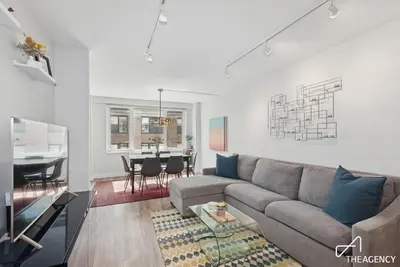
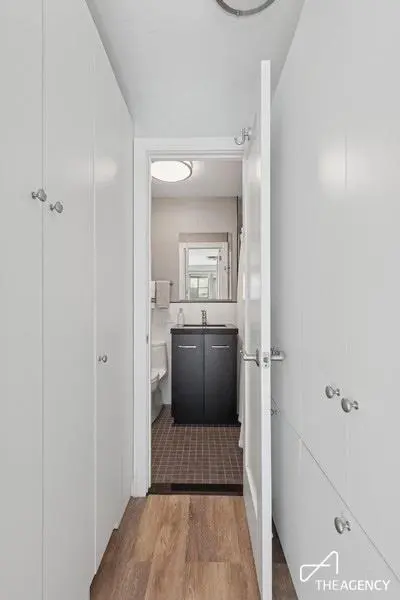
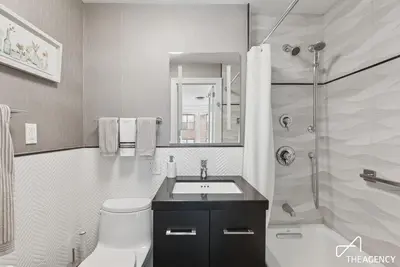
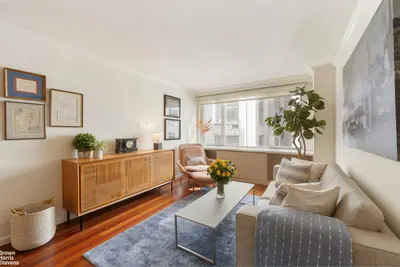
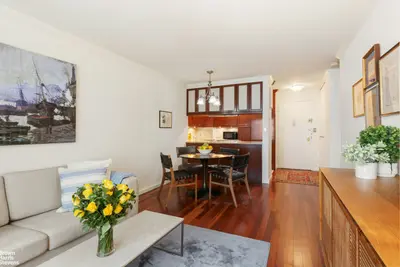
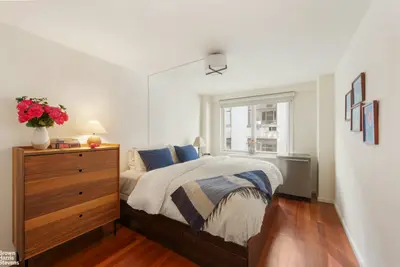
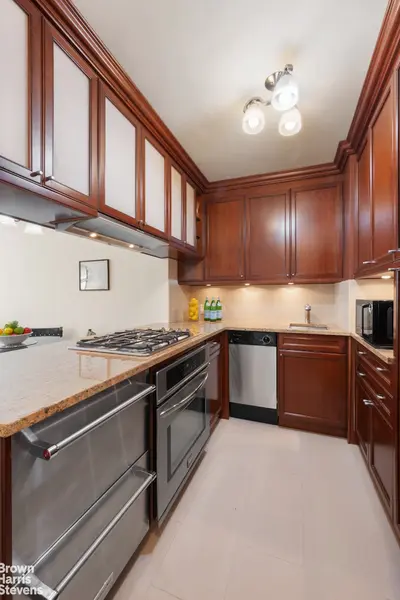
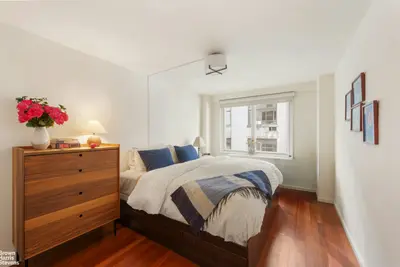


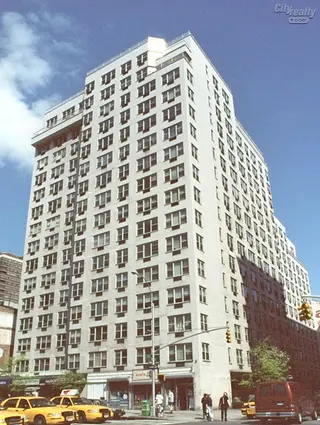
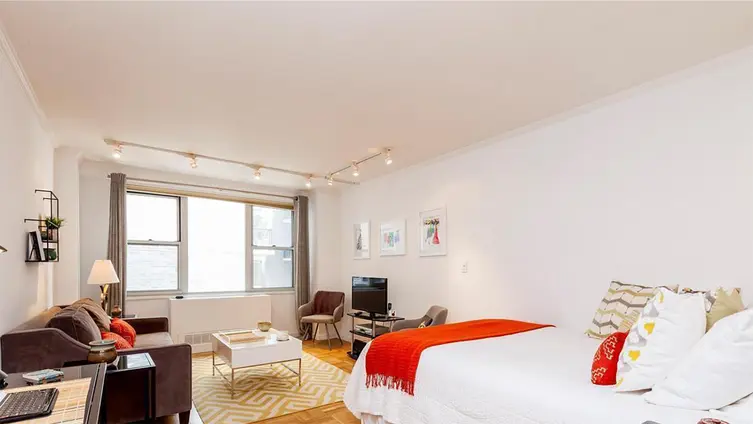
Gramercy East, located at 301 East 22nd Street, is a 17-story full-service luxury cooperative building constructed in 1966 and converted in 1985. The building houses 262 units and stands in a prime location near Gramercy Park, offering convenient access to the Flatiron District and Union Square areas.
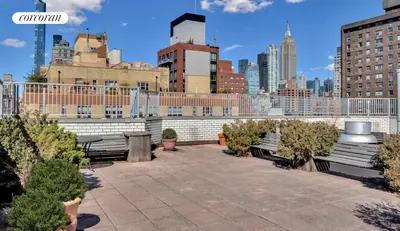
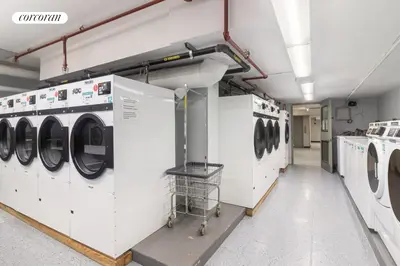
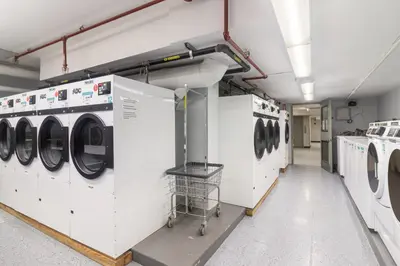
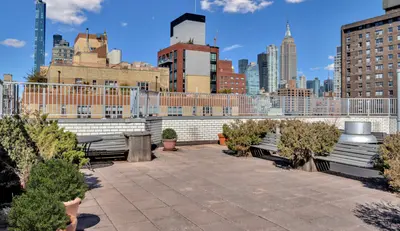
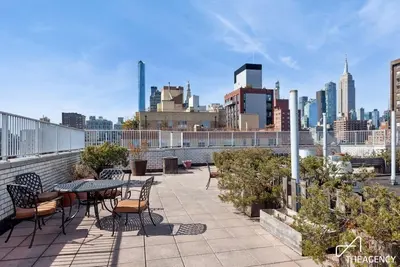
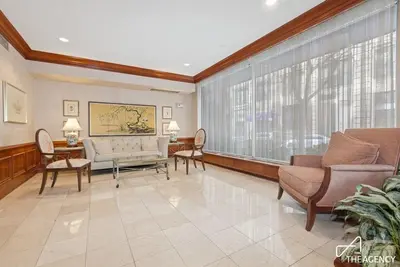
The building features comprehensive amenities including 24-hour doorman service, a live-in superintendent, a beautifully landscaped roof deck with stunning city views, and modern conveniences such as laundry facilities, bike storage, and a parking garage with direct elevator access. The location provides easy access to multiple subway lines, including the 4, 5, 6, N, R, Q, and L trains.
Gramercy East maintains a flexible and resident-friendly policy, permitting pied-a-terres, co-purchasing, and pets, with up to 80% financing allowed. The building's location offers proximity to renowned restaurants, shopping destinations, and various entertainment options, making it a desirable residence in one of Manhattan's most sought-after neighborhoods.


View school info, local attractions, transportation options & more.
Experience amazing 3D aerial maps and fly throughs.
For some co-ops, instead of price per square foot, we use an estimate of the number of rooms for each sold apartment to chart price changes over time. This is because many co-op listings do not include square footage information, and this makes it challenging to calculate accurate square-foot averages.
By displaying the price per estimated room count, we are able to provide a more reliable and consistent metric for comparing sales in the building. While we hope that this gives you a clearer sense of price trends in the building, all data should be independently verified. All data provided are only estimates and should not be used to make any purchase or sale decision.


Broker & Buyer Comments