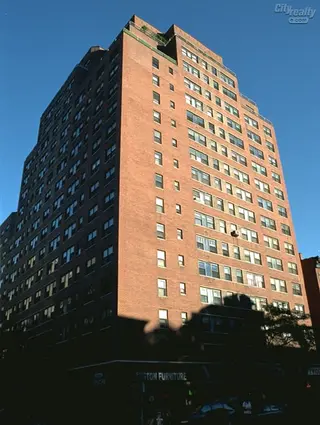
Victoria House, 200 East 27th Street - Gramercy Park
- Apartments
- Overview & Photos
- Maps
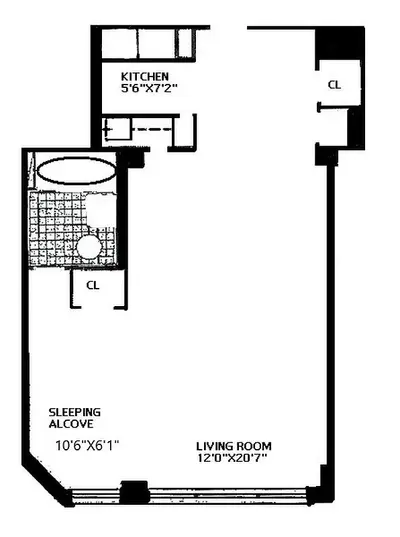
- Floorplans
- Sales Data & Comps
- Similar Buildings
- All Units
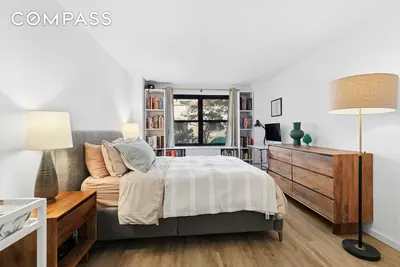
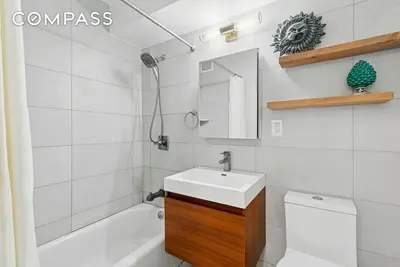
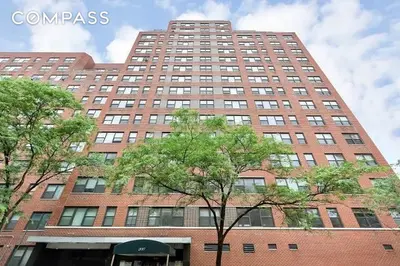
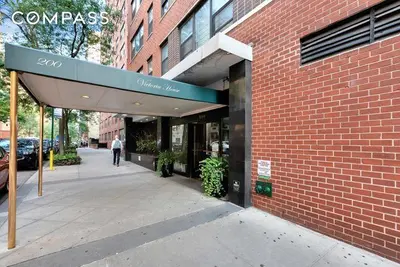
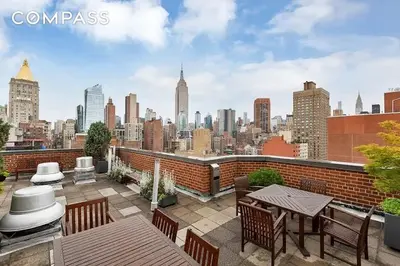
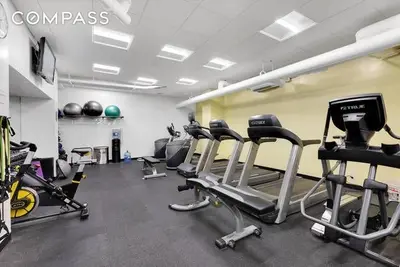
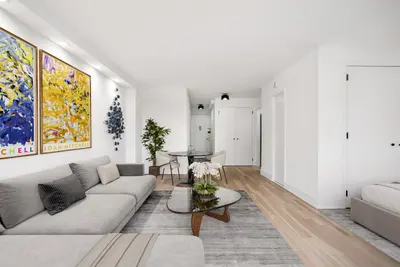
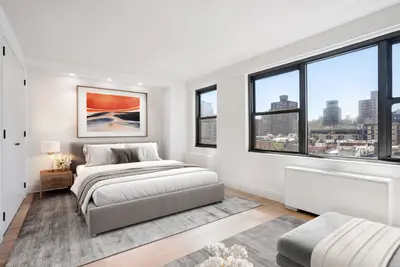
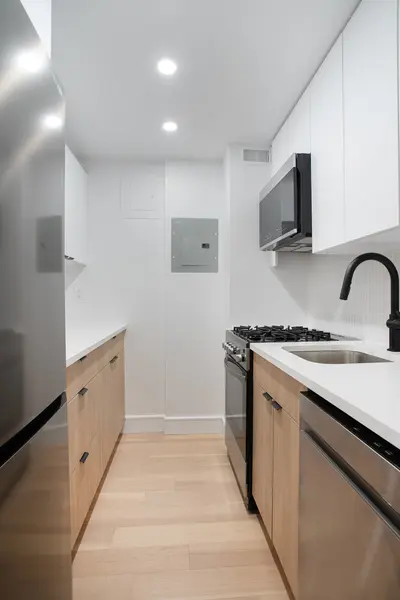
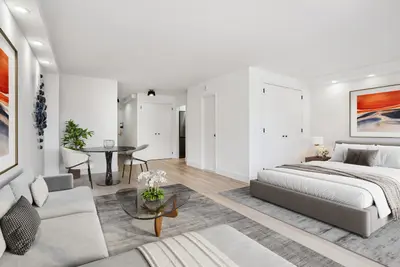
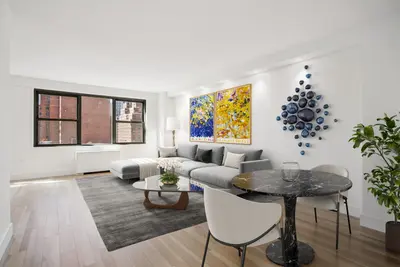
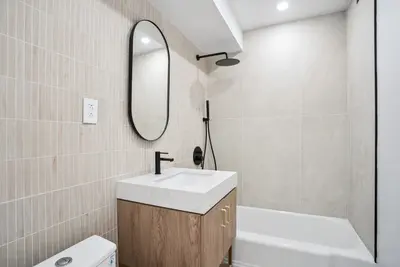
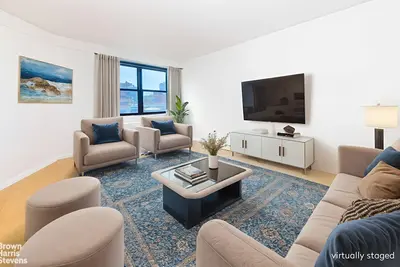
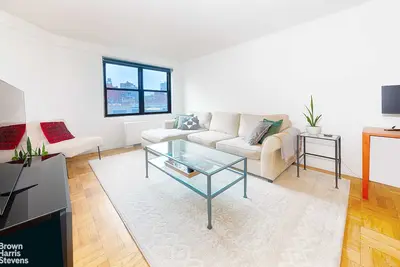
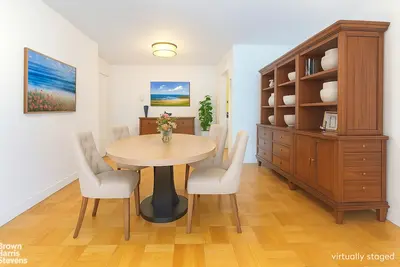
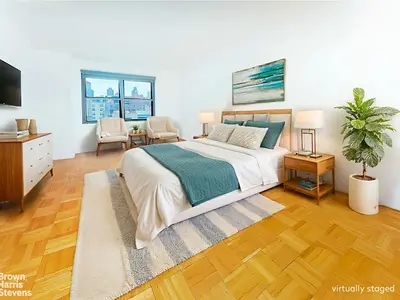
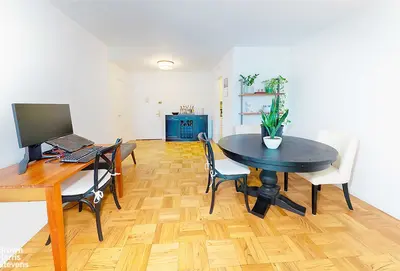
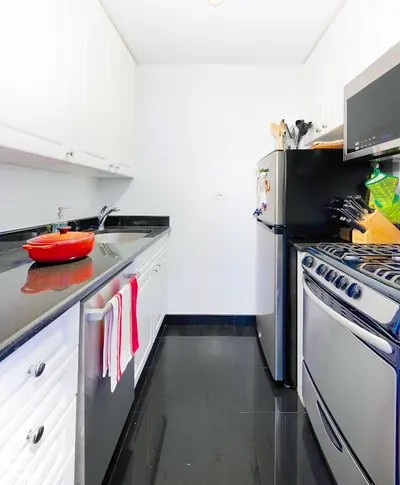
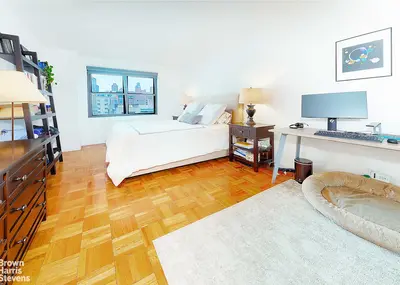
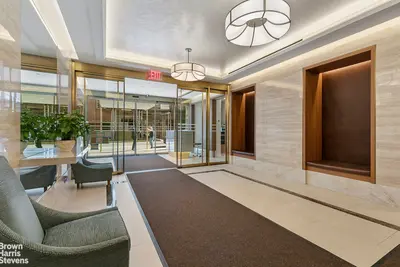
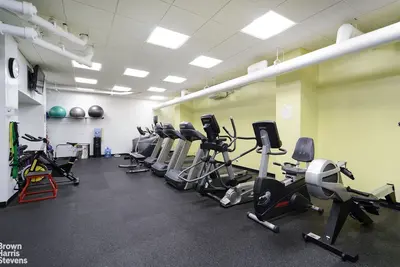


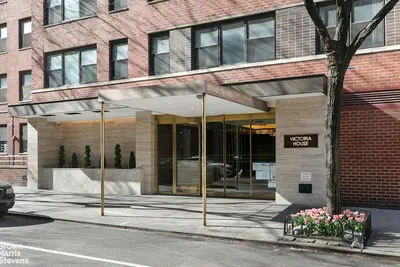
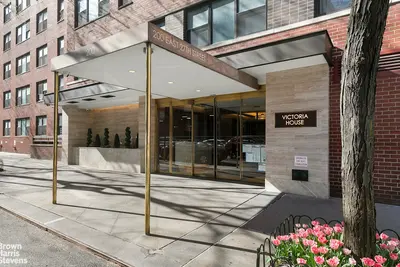
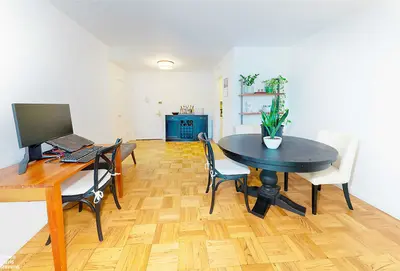


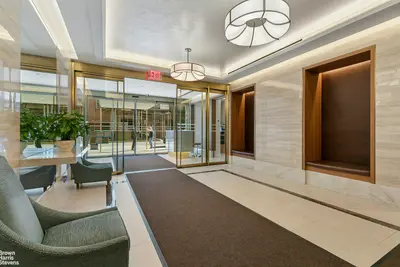
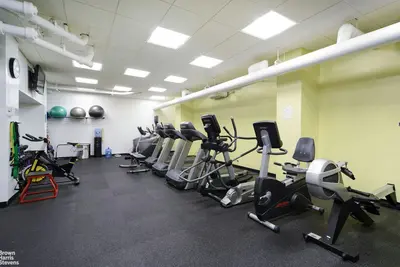


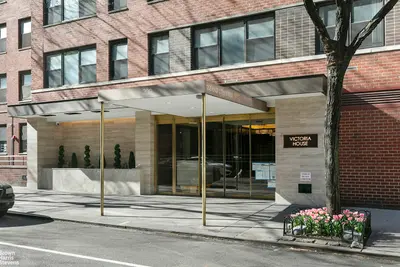
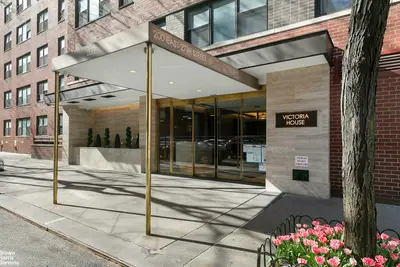

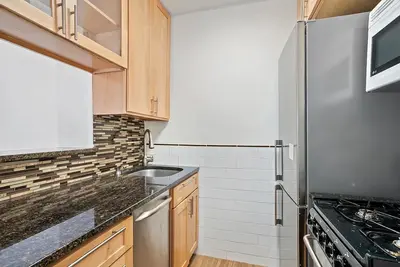
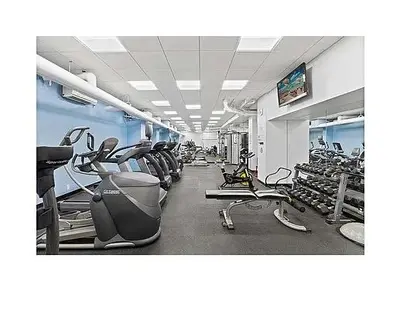
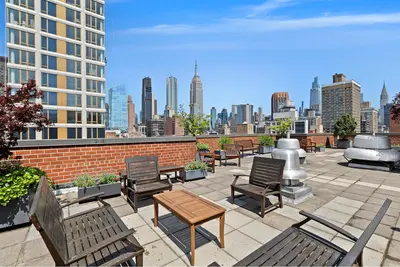
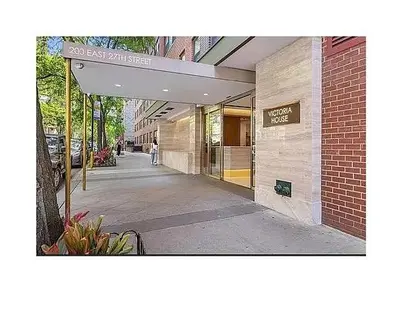
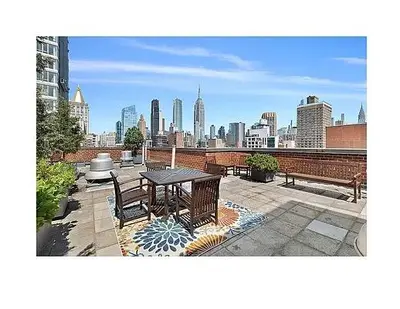
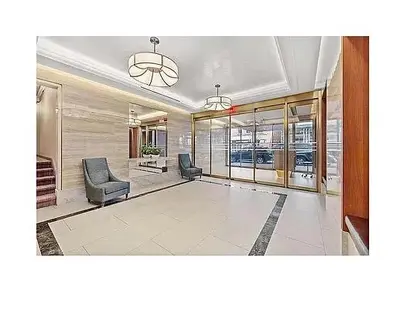
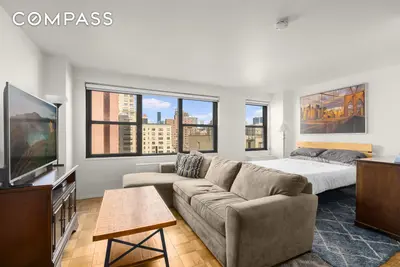
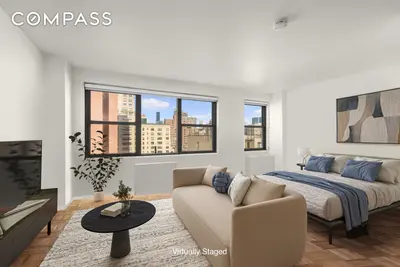
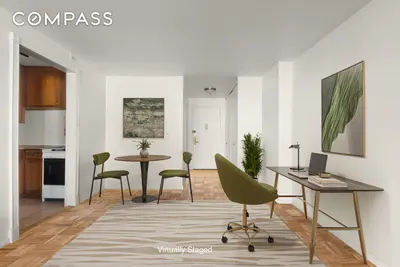
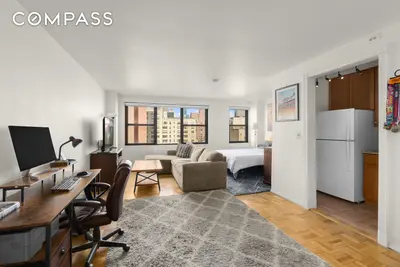
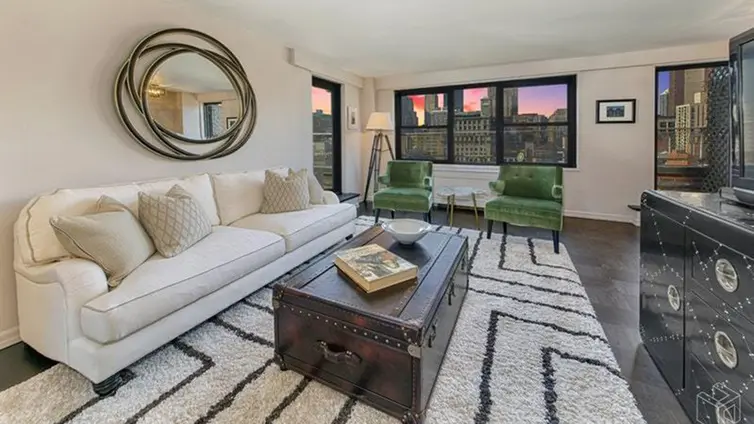
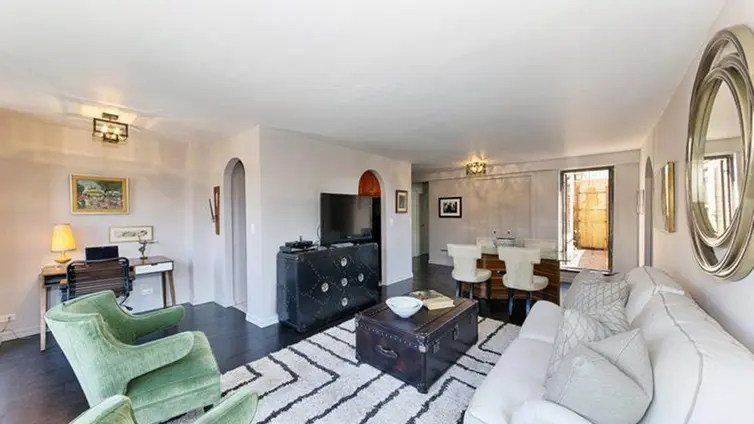
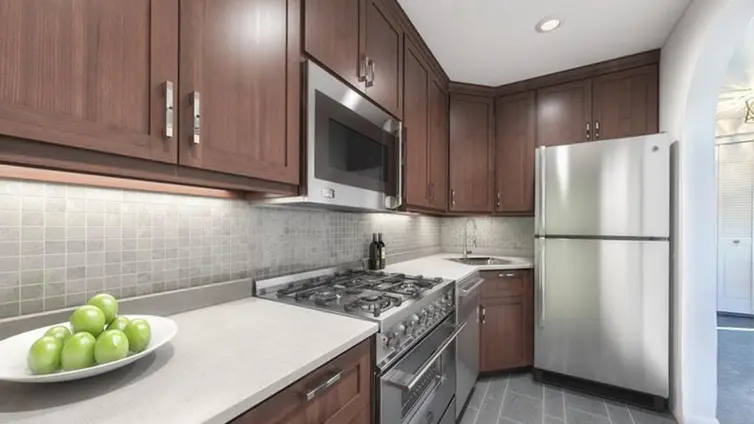
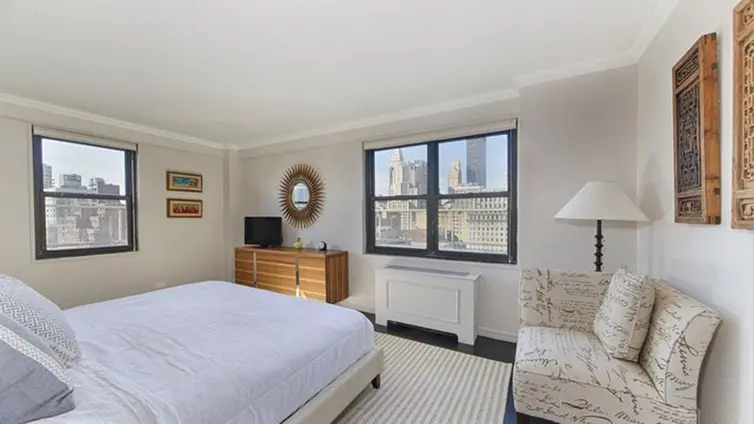
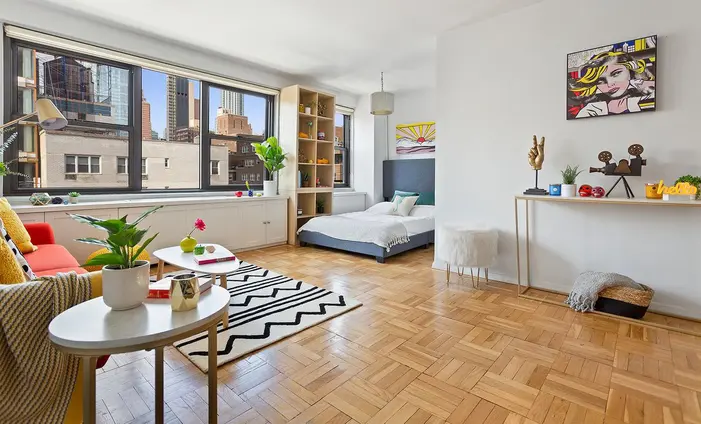
This 19-story, 280-unit co-op in the heart of Kips Bay has undergone a recent renovation that included Verizon Fios wiring, a landscaped roof deck, a newly renovated fitness center, a garage, a bike room and an upgraded laundry room. The building also offers a 24-hour doorman and a resident manager. Two blocks from the 6 train, Victoria House is victorious when it comes to convenience to Midtown and the rest of the city, and Madison Square Park, outdoor playgrounds, theaters and restaurants await in every direction. Schools and colleges like the School of Visual Arts and Baruch College add to the neighborhood’s casual campus vibe, and Trader Joe’s, Fairway, AMC Kips Bay theater and countless additional cultural and shopping destinations add to its livability.


View school info, local attractions, transportation options & more.
Experience amazing 3D aerial maps and fly throughs.
For some co-ops, instead of price per square foot, we use an estimate of the number of rooms for each sold apartment to chart price changes over time. This is because many co-op listings do not include square footage information, and this makes it challenging to calculate accurate square-foot averages.
By displaying the price per estimated room count, we are able to provide a more reliable and consistent metric for comparing sales in the building. While we hope that this gives you a clearer sense of price trends in the building, all data should be independently verified. All data provided are only estimates and should not be used to make any purchase or sale decision.
Broker & Buyer Comments