Learn more about off-market listings at The Theso!
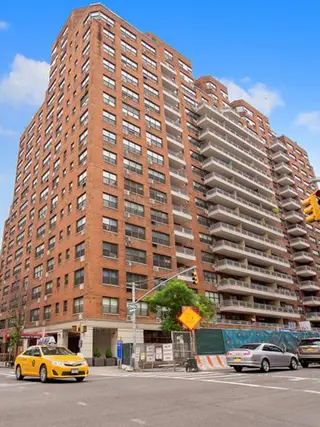
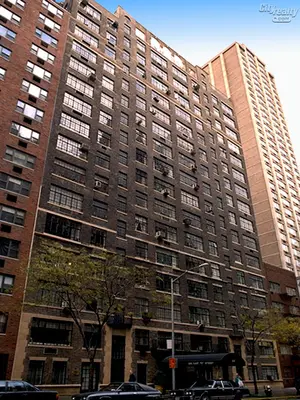
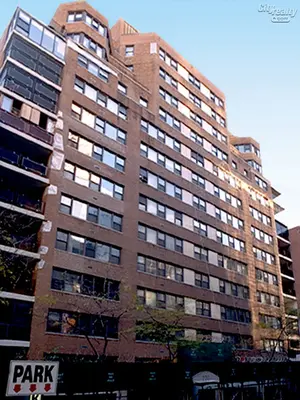
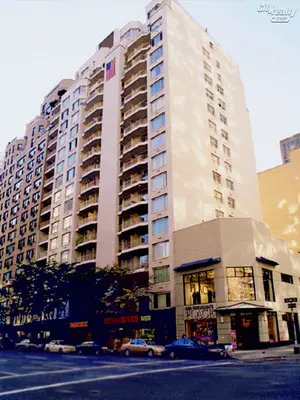
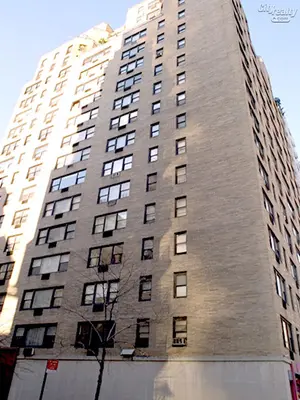
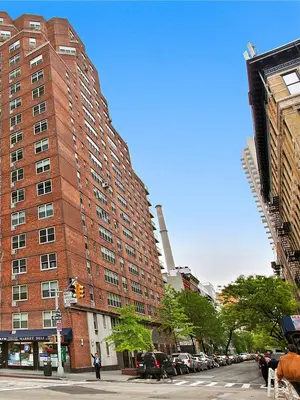
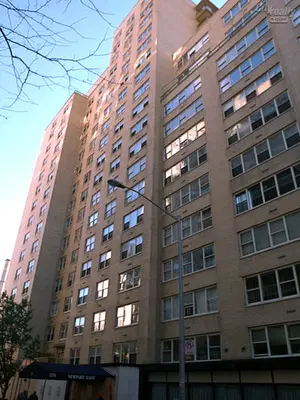
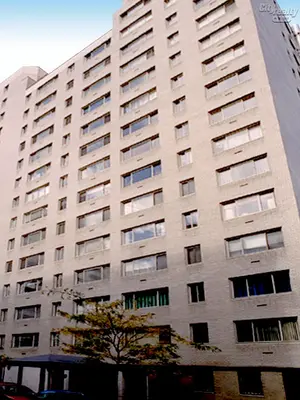
The Theso, 300 East 71st Street
Doorman Co-Op in Lenox Hill
- Apartments
- Overview & Photos
- Maps
- Floorplans
- Sales Data & Comps
- Similar Buildings
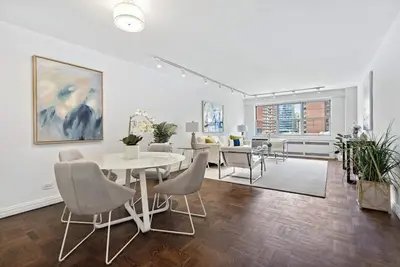
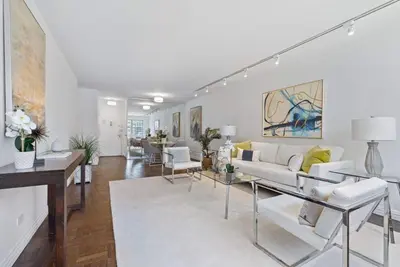
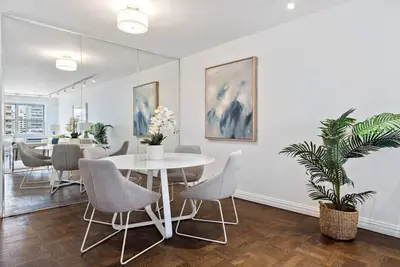
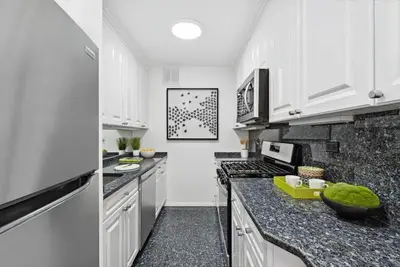
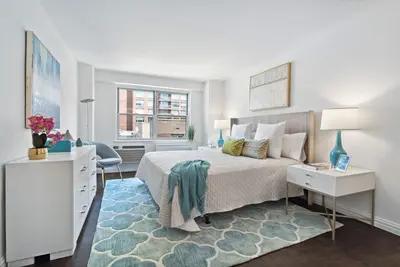
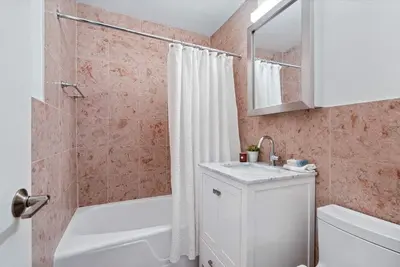
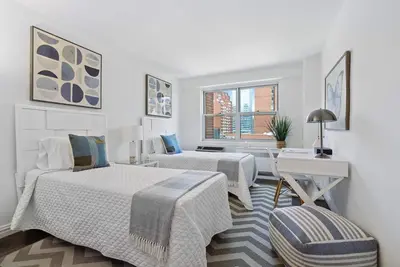
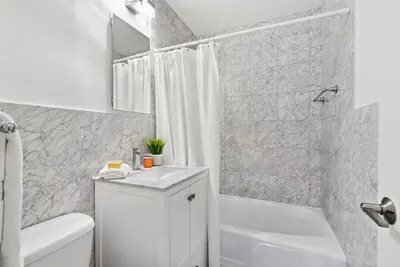
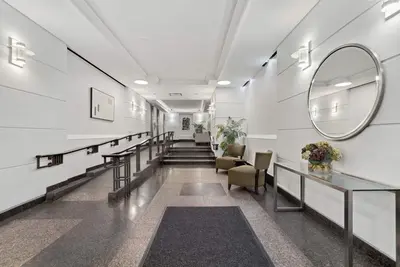
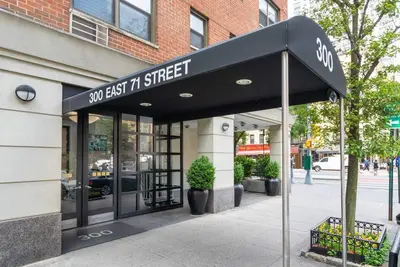
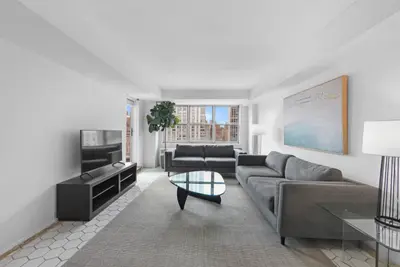
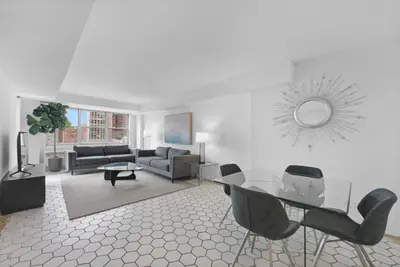
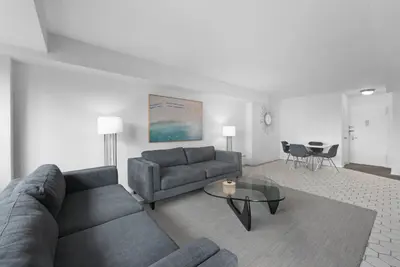
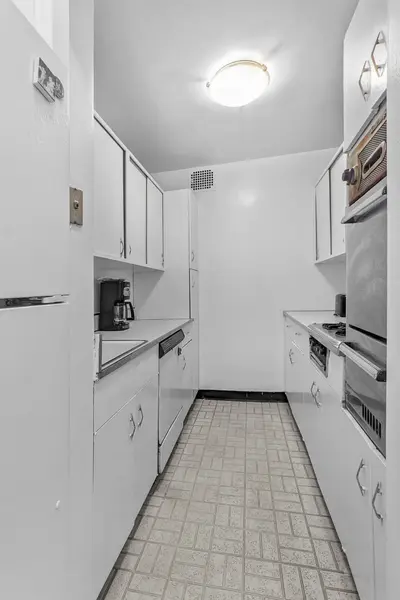
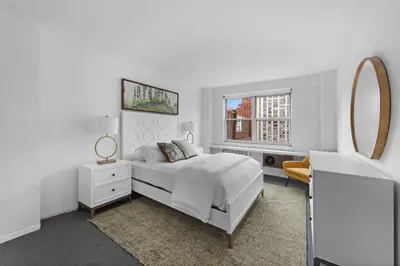
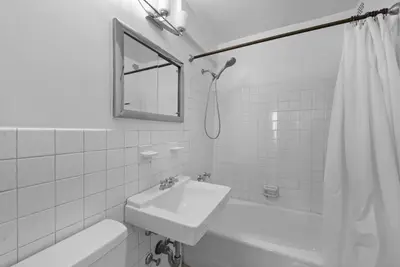
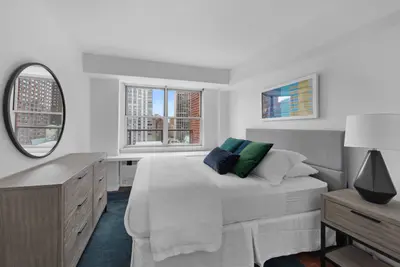
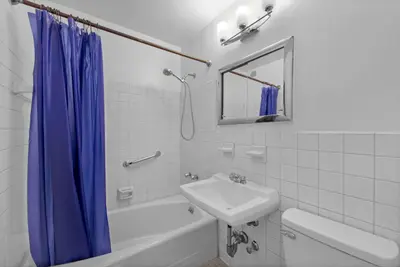
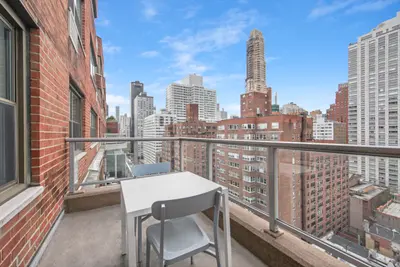
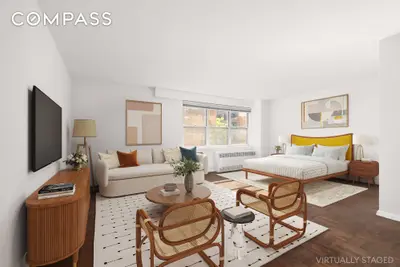
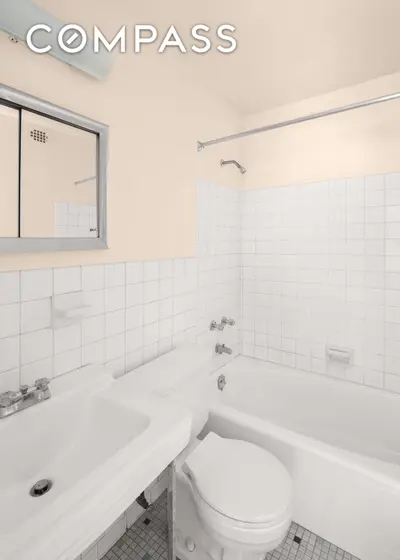
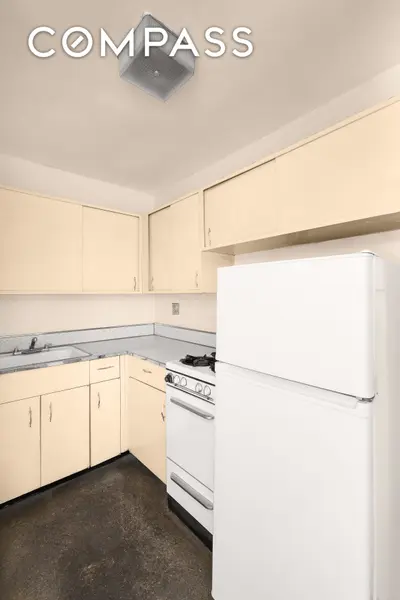
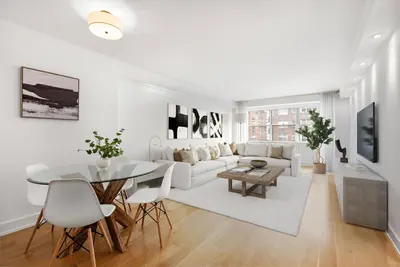
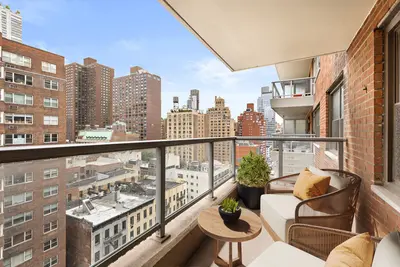
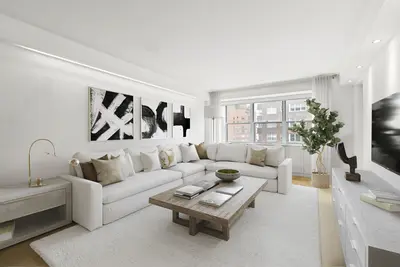
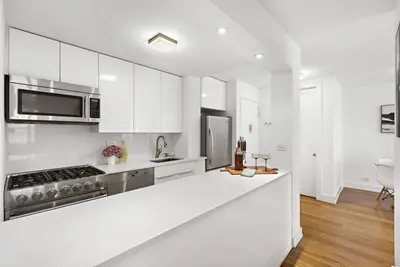
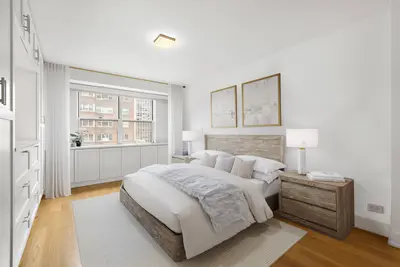
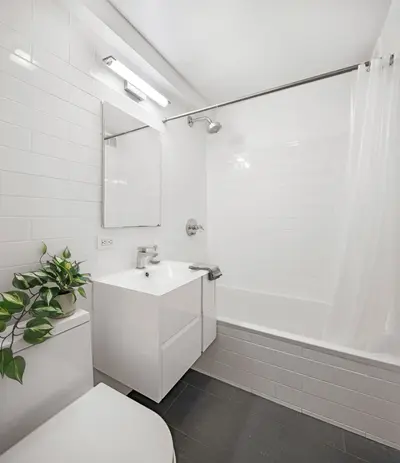
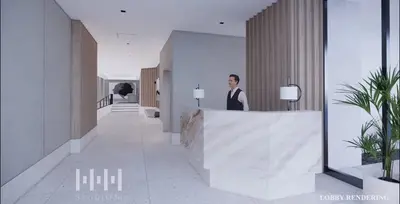
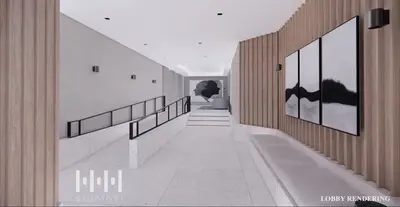
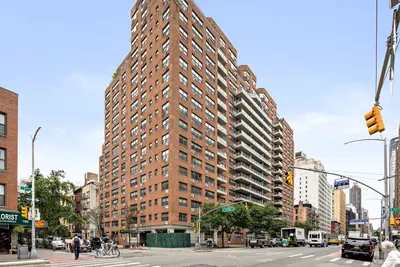
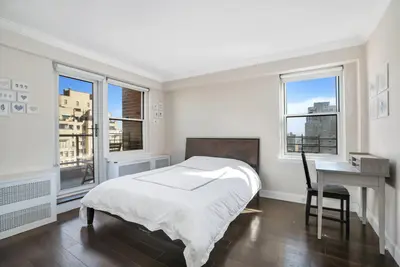
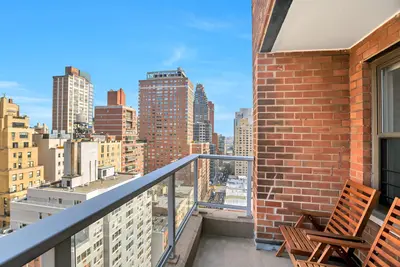
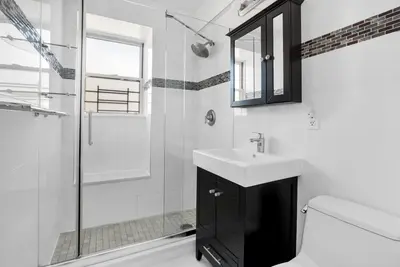
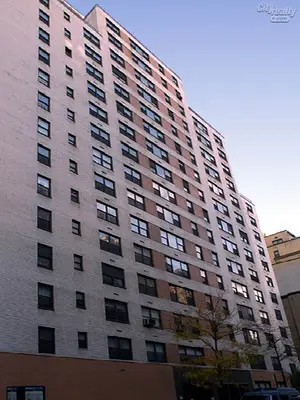
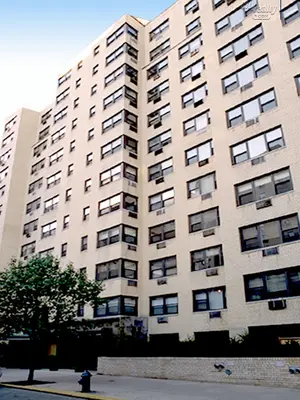
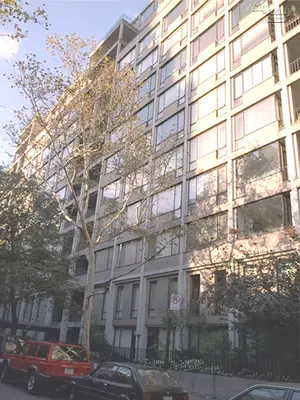
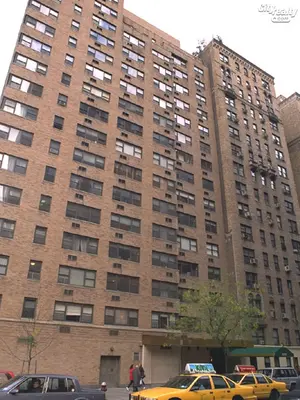
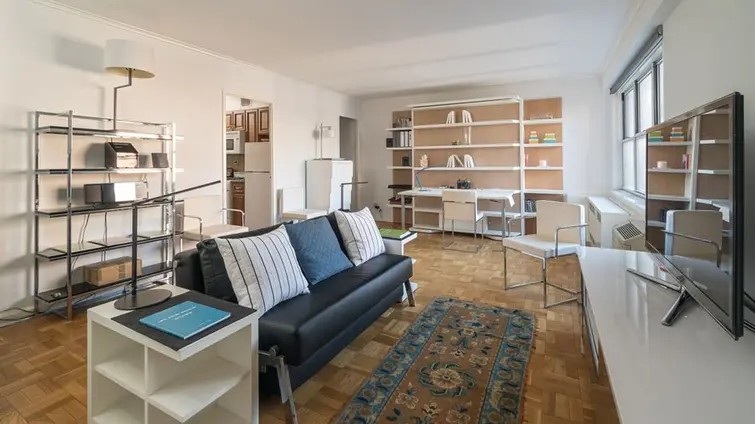
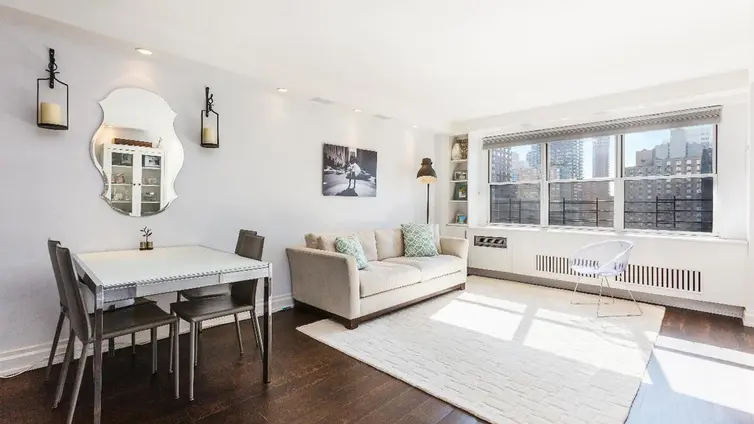
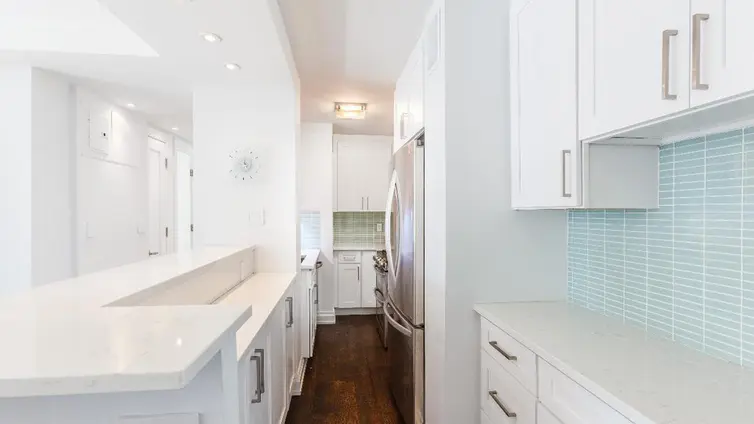
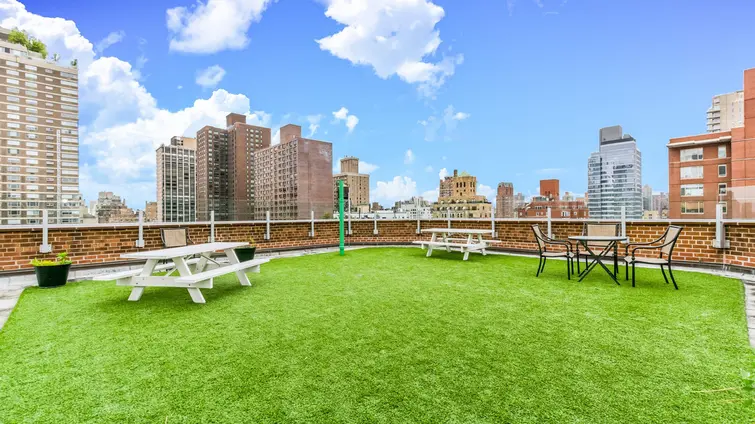
The Theso, located at 300 East 71st Street in the heart of Lenox Hill, is a luxury full-service cooperative offering the best of Upper East Side living. This 18-story red-brick building, with balconies along Second Avenue, was built in 1962 and converted to a cooperative in 1986. It features 283 apartments, some with terraces and bay windows on the upper floors.
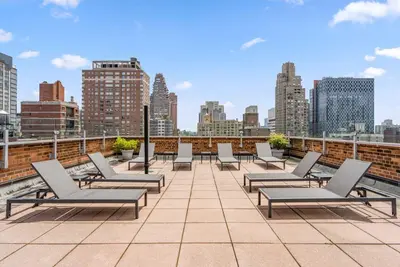
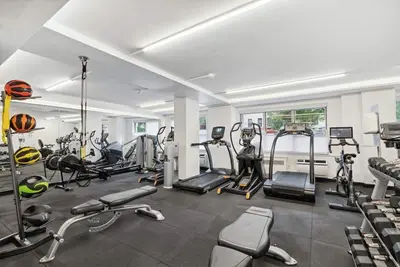
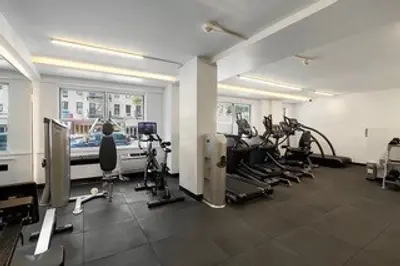
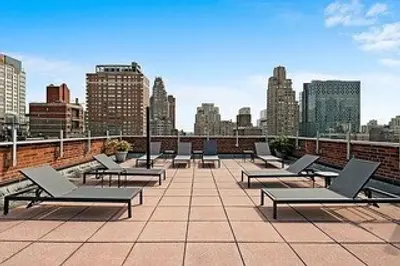
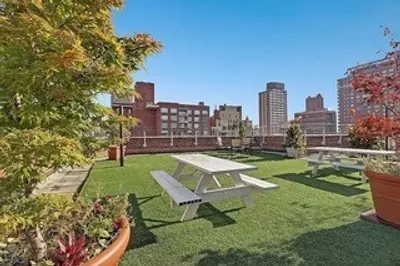
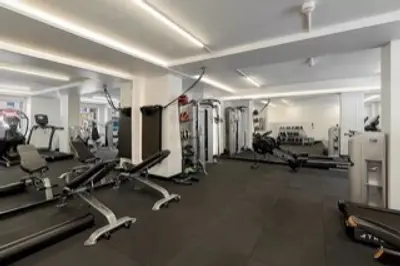
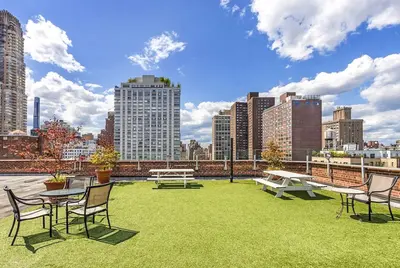
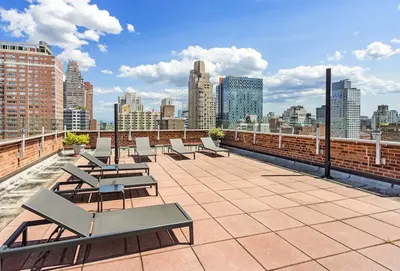
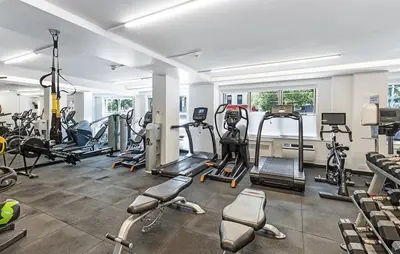
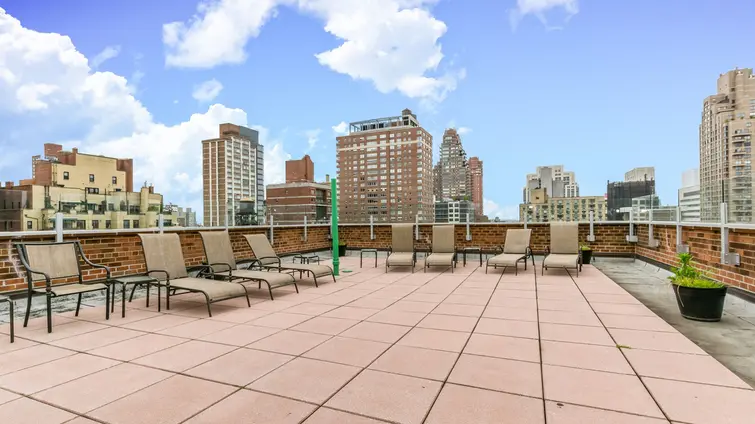
Amenities include a 24-hour doorman, concierge, live-in resident manager, state-of-the-art fitness center, bike storage, storage units for rent, and a beautifully landscaped roof garden with stunning city views. Pets, pieds-à-terre, co-purchasing, gifting, and guarantors are permitted with board approval, and 75% financing is allowed. Washer/dryers are also permitted with approval, and subletting is allowed for two out of every five years.
The Theso is conveniently located near gourmet markets like Citarella and Eli’s, trendy restaurants, and public transportation, including the Q train just one block away.

Learn more about off-market listings at The Theso!

View school info, local attractions, transportation options & more.
Experience amazing 3D aerial maps and fly throughs.
For some co-ops, instead of price per square foot, we use an estimate of the number of rooms for each sold apartment to chart price changes over time. This is because many co-op listings do not include square footage information, and this makes it challenging to calculate accurate square-foot averages.
By displaying the price per estimated room count, we are able to provide a more reliable and consistent metric for comparing sales in the building. While we hope that this gives you a clearer sense of price trends in the building, all data should be independently verified. All data provided are only estimates and should not be used to make any purchase or sale decision.
|
Year
Avg Price / Room (Est)
Avg. Actual Price
Med. Actual Price
Transactions
2025
$190,167
$532,500
2
2024
$216,740
$674,100
5
2023
$248,208
$995,833
12
2022
$240,295
$1,085,810
24
2021
$239,680
$974,870
23
2020
$229,868
$904,250
12
2019
$245,295
$794,405
8
2018
$248,267
$1,042,500
10
2017
$228,576
$739,395
11
2016
$264,433
$1,088,417
12
2015
$220,412
$776,471
17
2014
$197,287
$732,416
25
|
Year
Avg Price / Room (Est)
Avg. Actual Price
Med. Actual Price
Transactions
2013
$191,673
$671,487
17
2012
$160,499
$529,937
23
2011
$158,666
$579,846
14
2010
$169,698
$705,611
9
2009
$161,556
$710,000
7
2008
$194,579
$750,090
13
2007
$173,570
$746,500
16
2006
$195,556
$627,218
17
2005
$175,333
$499,069
17
2004
$114,950
$416,818
11
2003
$143,909
$510,167
31
|
the following is a slider of images. For screen reader users, all slides are visible at all time so you may ignore control buttons.
Sign-up and we'll email you new listings in this building!
Whether you’re a buyer, investor, or simply curious, this report is your key to unlocking in-depth insights and analysis on .
Please confirm your details: