Shh... Many units sell without being publicly listed.
Interested in off-market listings at 2 Columbus Avenue? Some previously listed residences might be available – contact us for insider details on potential opportunities!
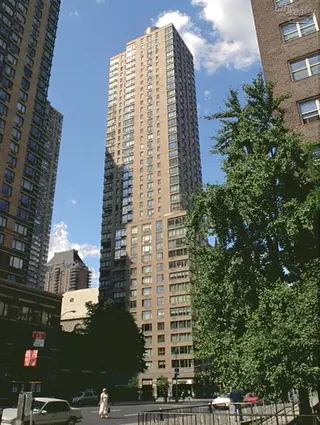


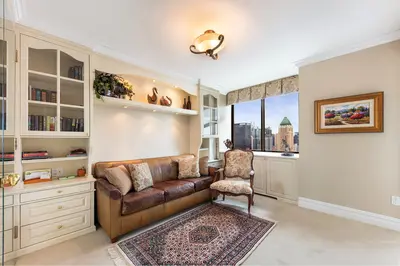


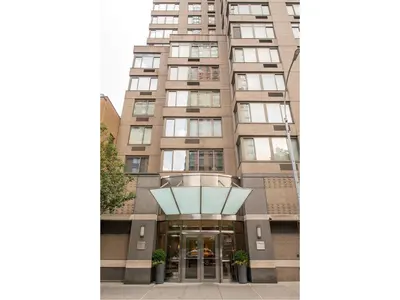

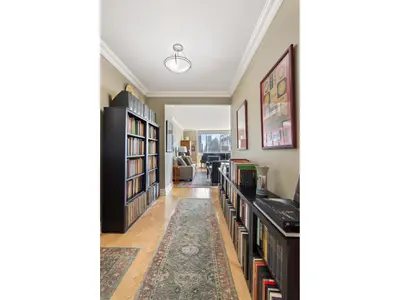

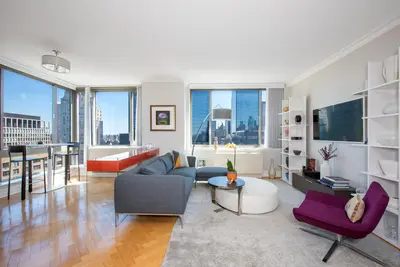


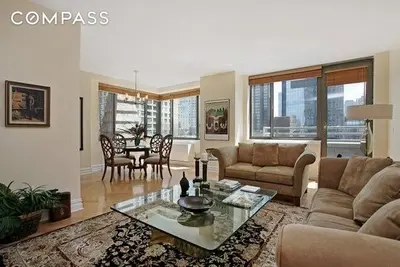
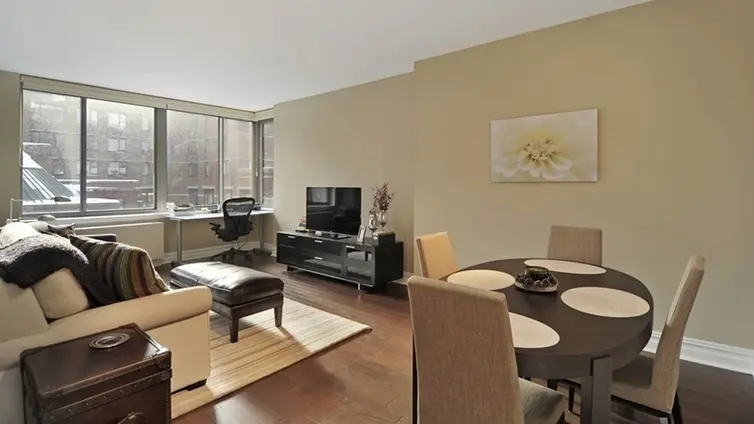
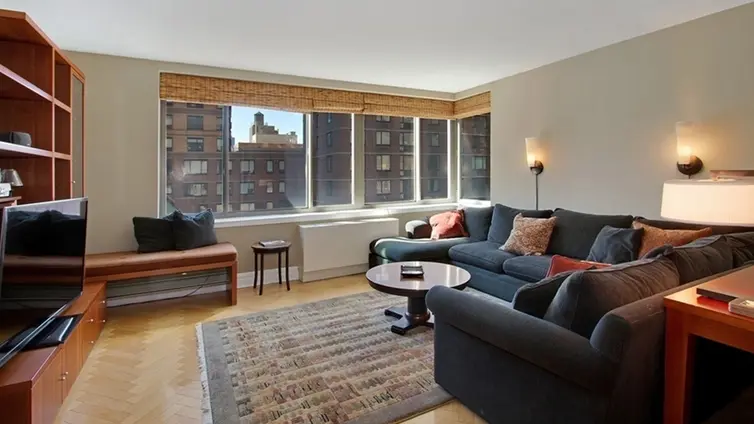
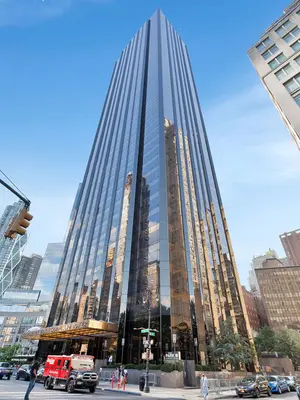
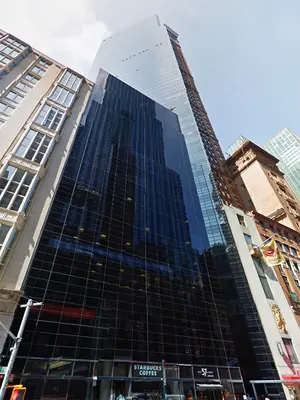
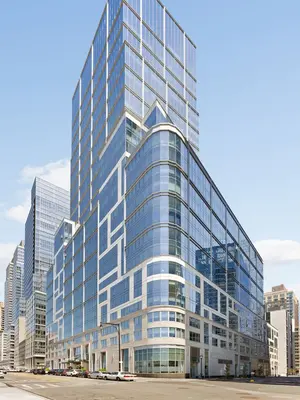
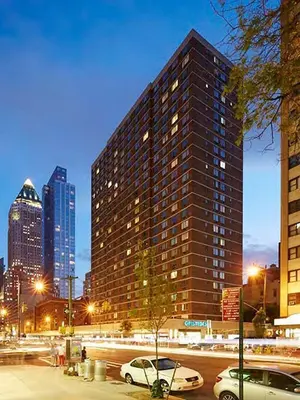
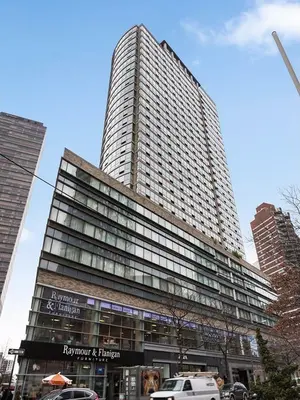
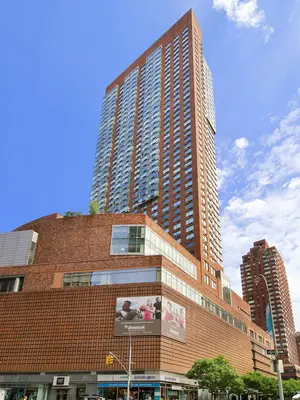
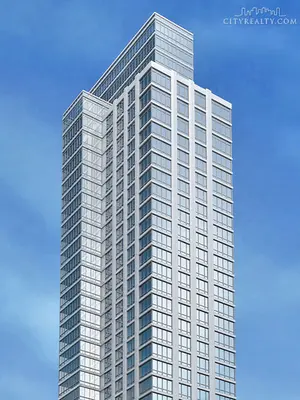
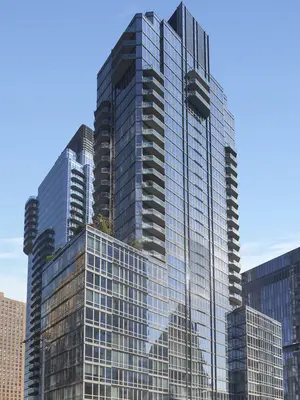
2 Columbus Avenue is a 41-story tower at 401 West 59th Street.
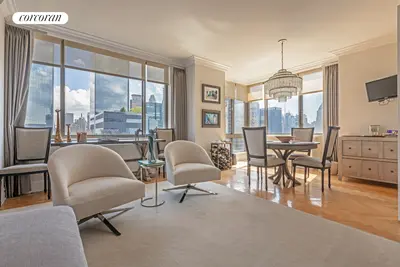
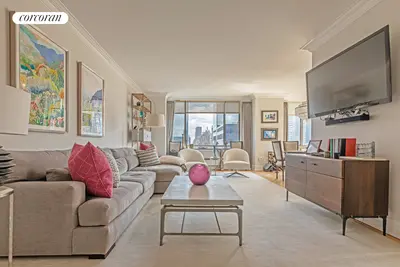
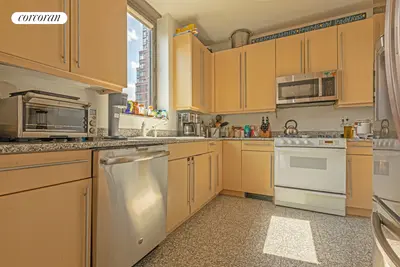
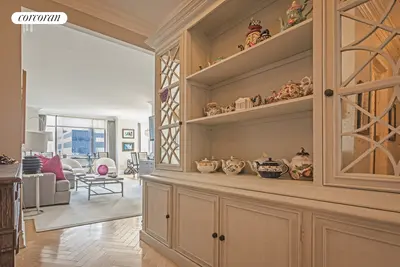
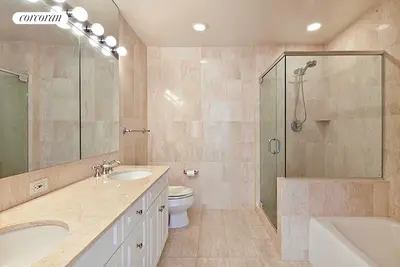
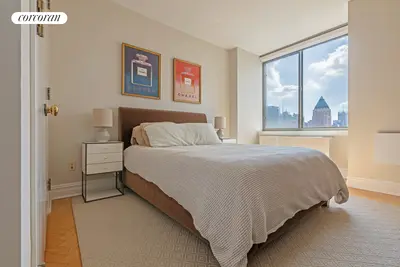
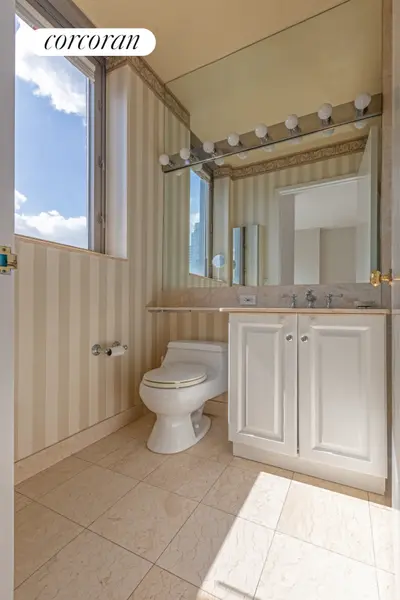
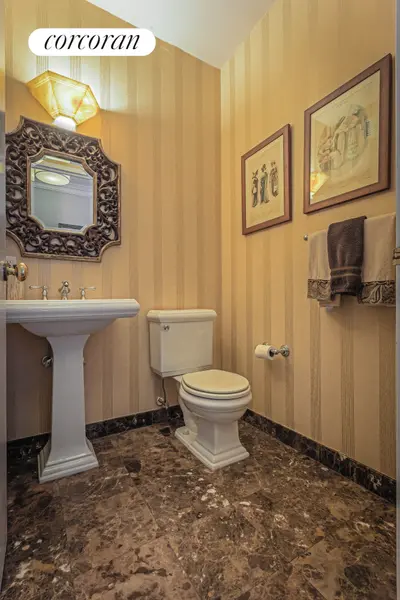
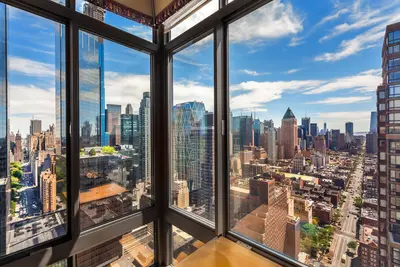
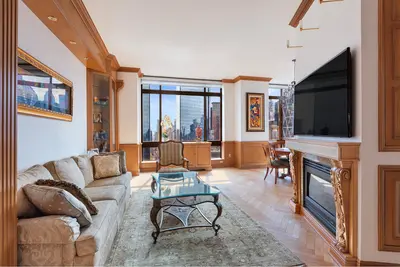
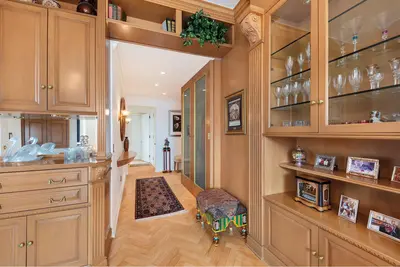
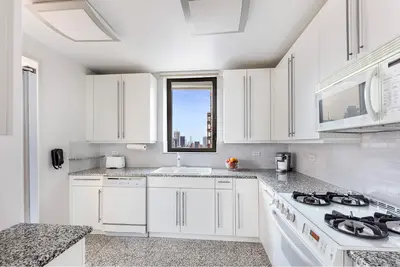
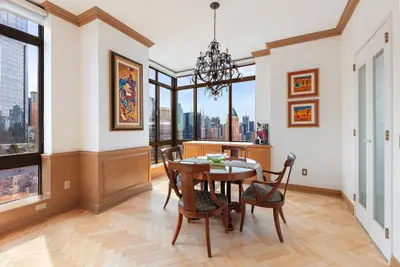
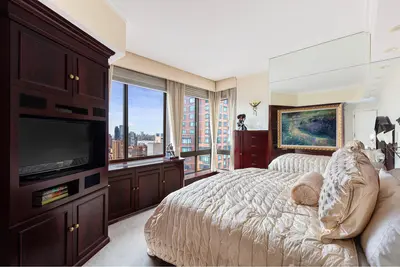
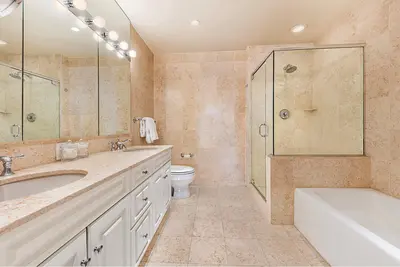
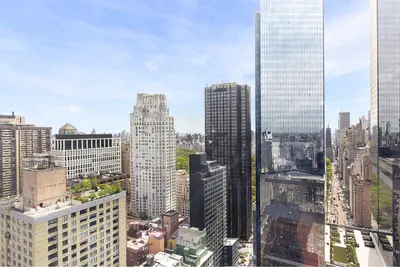
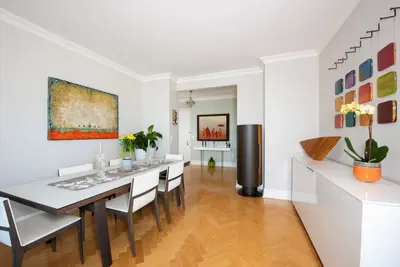
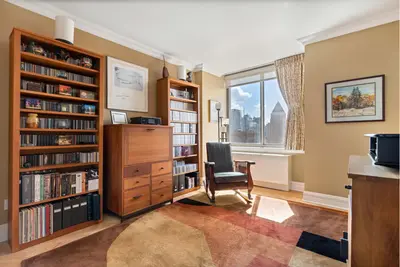
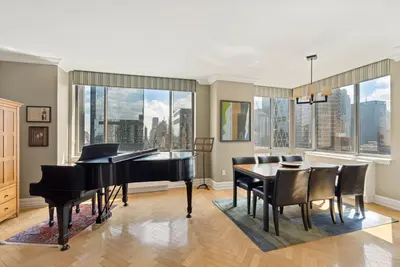
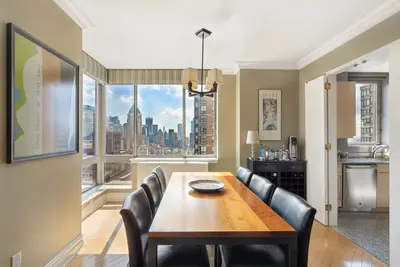
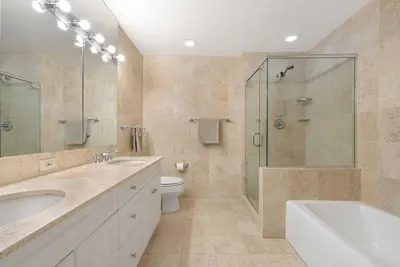
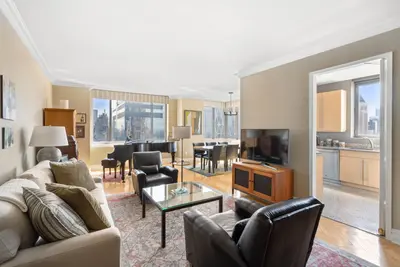
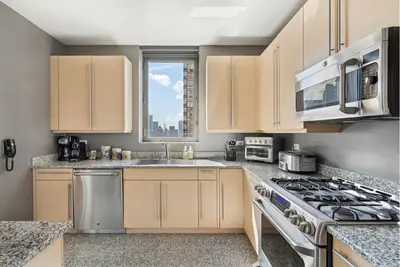
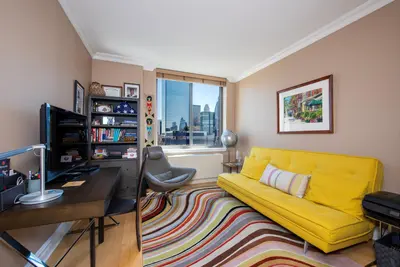
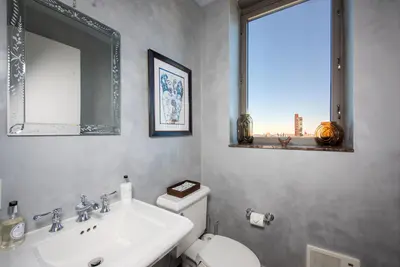
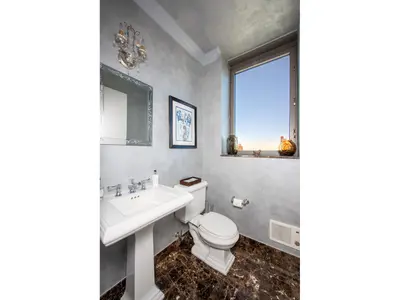
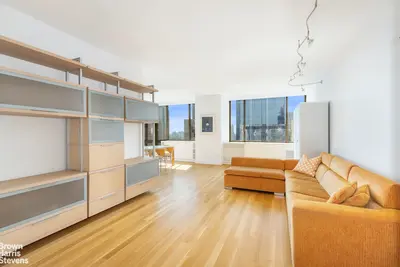
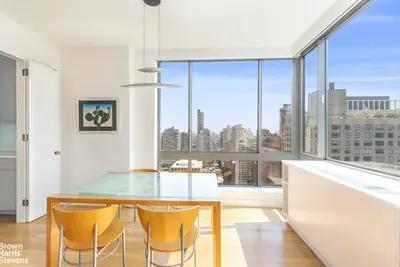
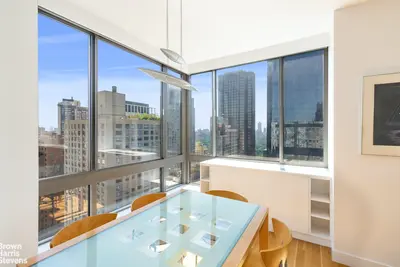
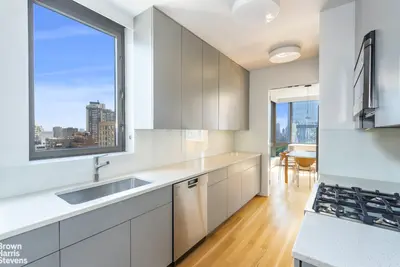
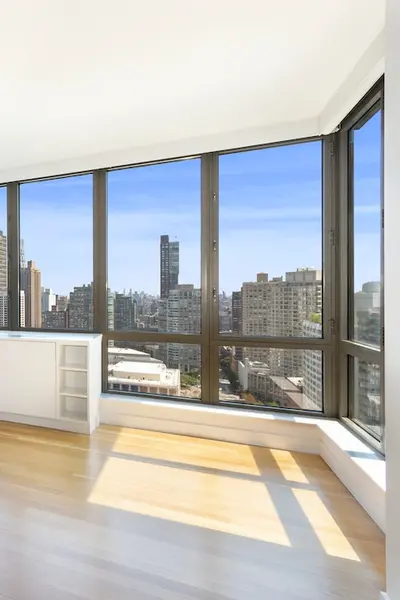
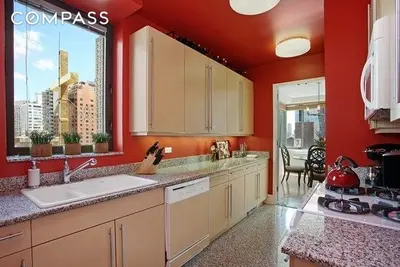
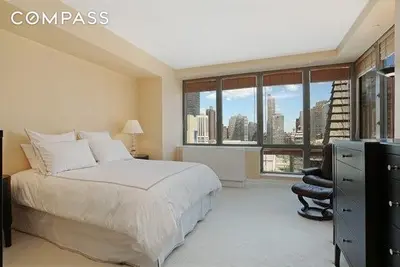
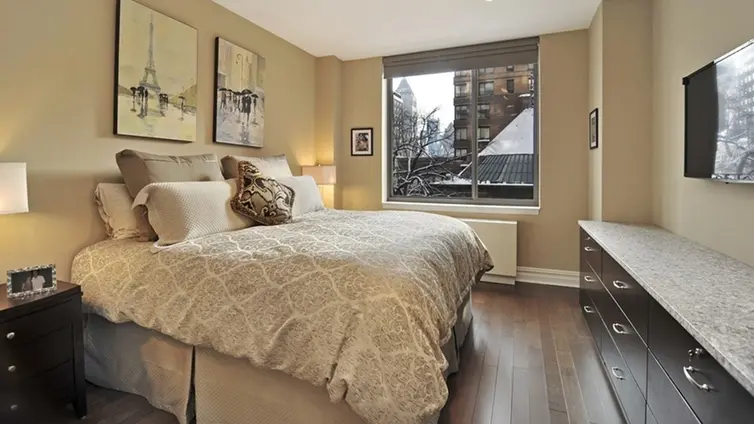
High ceilings and floor-to-ceiling windows adorn unobstructed, sunny views of the Hudson River and the New York City skyline. Windowed chef’s kitchens overlook the dining rooms and feature granite countertops and premium appliances. Marble bathrooms include designer fixtures, separate tubs and glass-enclosed showers. Apartments at 2 Columbus Avenue also feature the added conveniences of elegant entry foyers, ample closet space – including walk-in closets – and washers and dryers.
Amenities include a full-time doorman, a concierge, a bicycle and stroller storage room, a garage, and a fitness center. Central Park and Hudson River Park are both nearby, as are the shops and restaurants in Columbus Circle.


Interested in off-market listings at 2 Columbus Avenue? Some previously listed residences might be available – contact us for insider details on potential opportunities!

View school info, local attractions, transportation options & more.
Experience amazing 3D aerial maps and fly throughs.
|
Year
Avg Price / Ft2 (Est)
Median Price / Ft2 (Est)
Avg. Actual Price
Med. Actual Price
Transactions
2025
$1,432
$2,131,674
$1,444
$1,895,000
3
2024
$1,606
$2,247,000
$1,655
$2,395,000
5
2023
$1,581
$2,402,374
$1,609
$2,425,000
8
2022
$1,710
$2,149,000
$1,829
$2,547,500
6
2021
$1,485
$1,811,750
$1,423
$1,637,500
8
2020
$1,450
$2,018,750
$1,413
$1,780,000
4
2019
$1,545
$2,206,000
$1,520
$2,200,000
5
2018
$1,783
$2,530,000
$1,766
$2,532,500
4
2017
$1,568
$1,904,778
$1,501
$1,898,888
5
2016
$1,722
$2,410,800
$1,761
$2,720,000
5
2015
$1,743
$2,541,429
$1,643
$2,155,000
7
2014
$1,627
$2,102,143
$1,506
$1,700,000
7
|
Year
Avg Price / Ft2 (Est)
Median Price / Ft2 (Est)
Avg. Actual Price
Med. Actual Price
Transactions
2013
$1,602
$1,920,000
$1,602
$1,920,000
2
2012
$1,381
$2,102,273
$1,311
$1,950,000
11
2011
$1,462
$2,349,000
$1,427
$2,150,000
5
2010
$1,311
$1,638,500
$1,325
$1,837,500
6
2009
$1,156
$1,945,667
$1,244
$1,800,000
9
2008
$1,606
$2,571,250
$1,598
$2,360,000
6
2007
$1,380
$2,026,944
$1,431
$1,825,000
9
2006
$1,274
$1,977,281
$1,302
$1,972,500
16
2005
$1,297
$1,998,300
$1,261
$2,075,000
15
2004
$1,063
$1,502,750
$1,092
$1,612,500
12
2003
$814
$1,188,292
$843
$949,500
12
|
the following is a slider of images. For screen reader users, all slides are visible at all time so you may ignore control buttons.
Sign-up and we'll email you new listings in this building!
Whether you’re a buyer, investor, or simply curious, this report is your key to unlocking in-depth insights and analysis on .
Please confirm your details:


Broker & Buyer Comments