Shh... Many units sell without being publicly listed.
Looking for something special? Select off-market options at Convention Overlook may be available – connect with us for access.
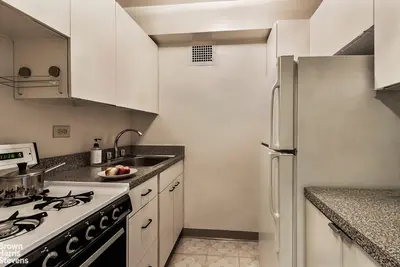
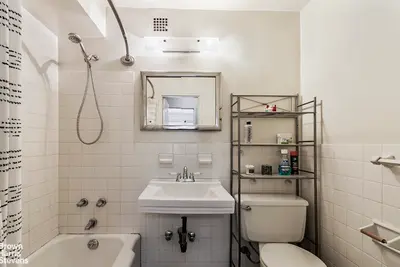
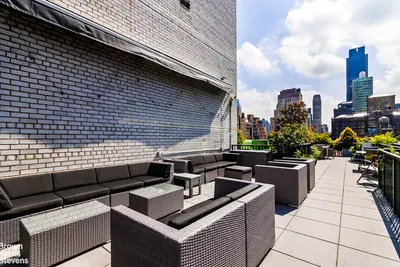
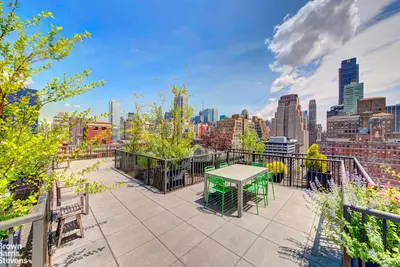
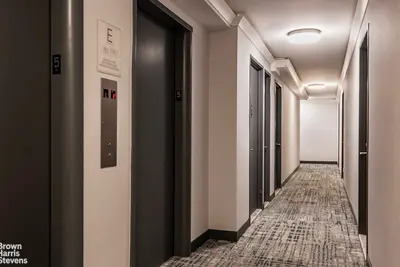
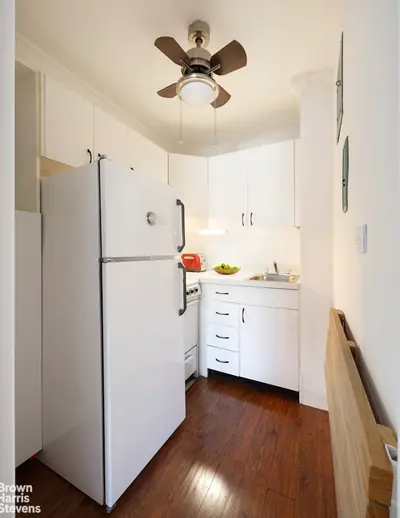
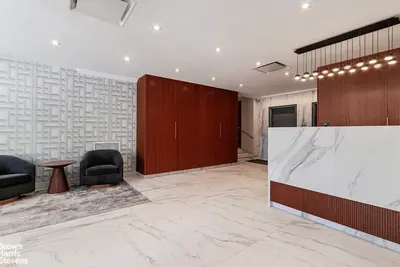
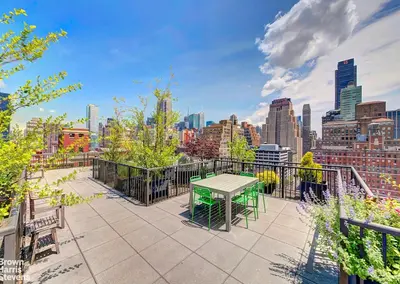
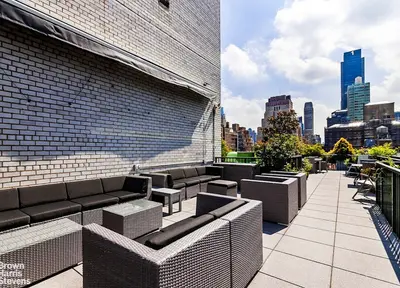
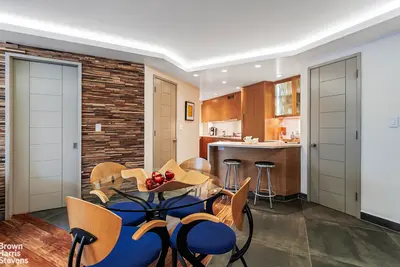
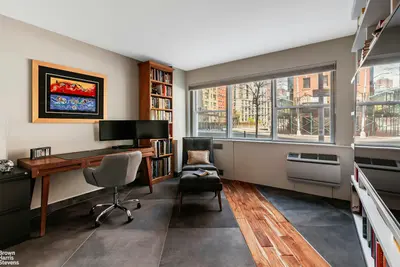
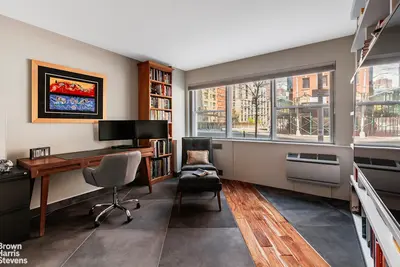
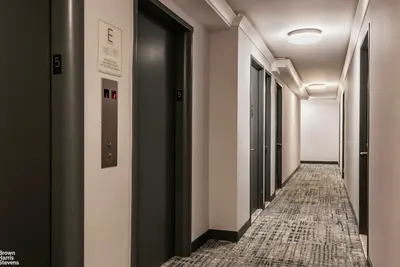
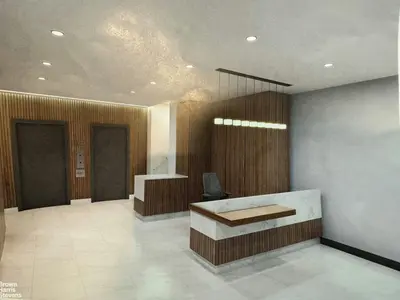
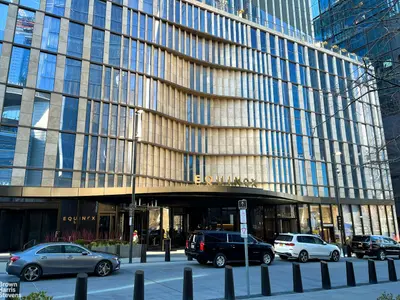
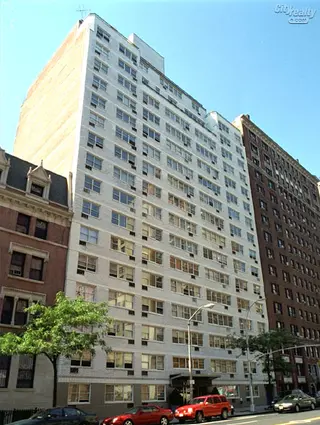
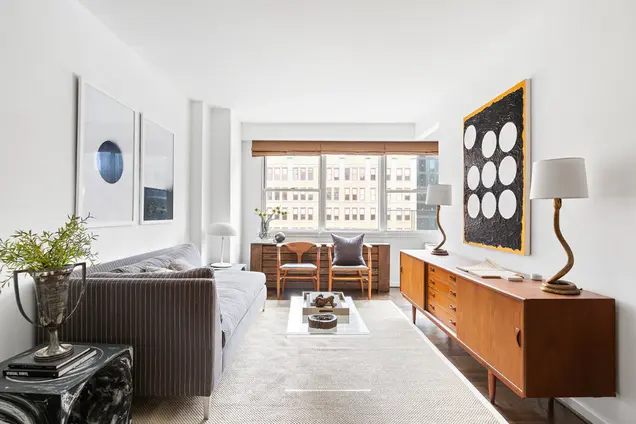
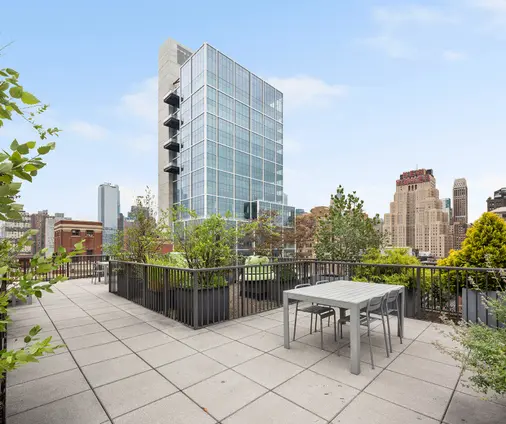
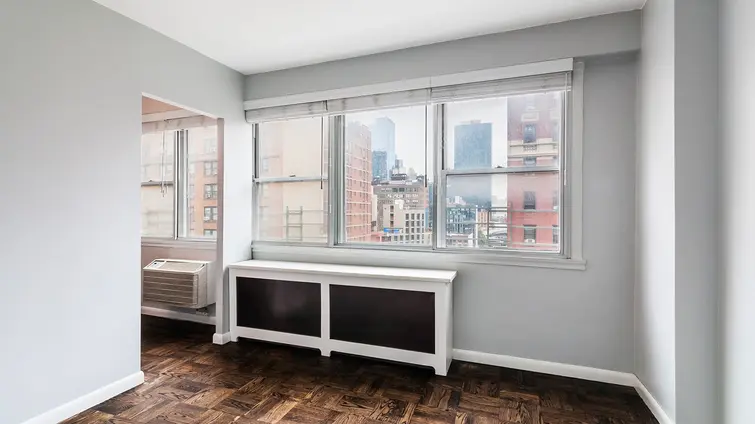
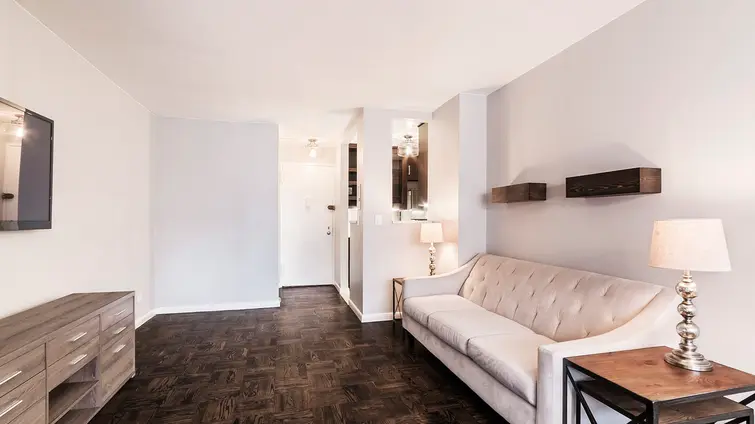
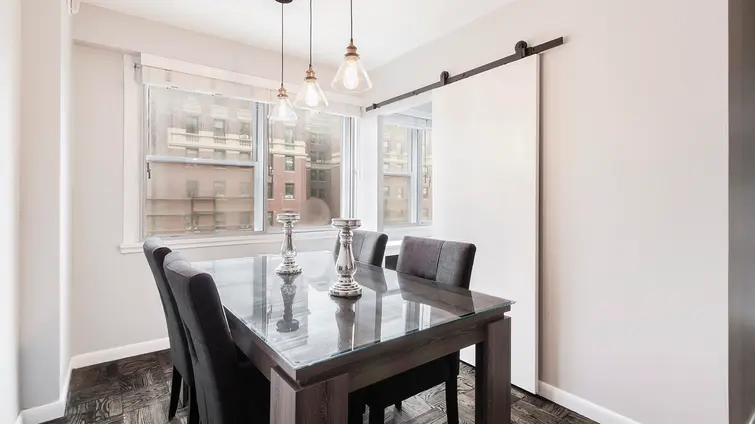
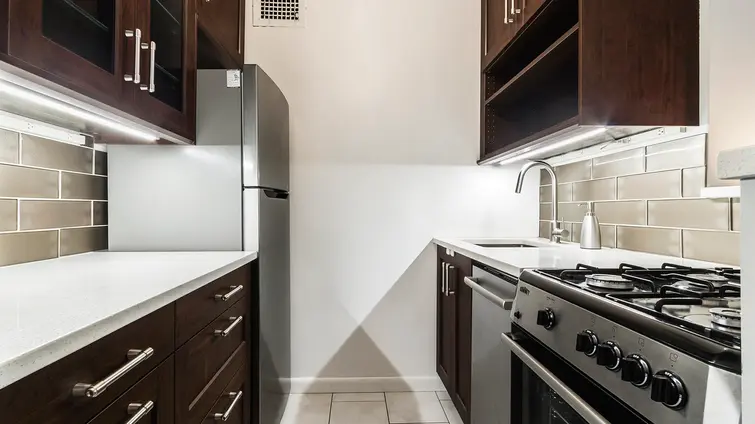
Convention Overlook is a full-service cooperative located at 430 West 34th Street. A 24-hour doorman and live-in superintendent are on staff, and amenities include a renovated lobby, a central laundry room, bike storage, and a planted and furnished roof deck with 360-degree views.
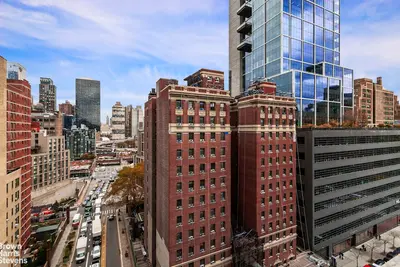
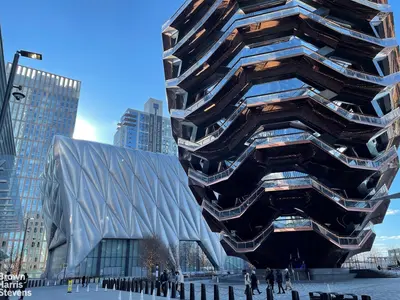
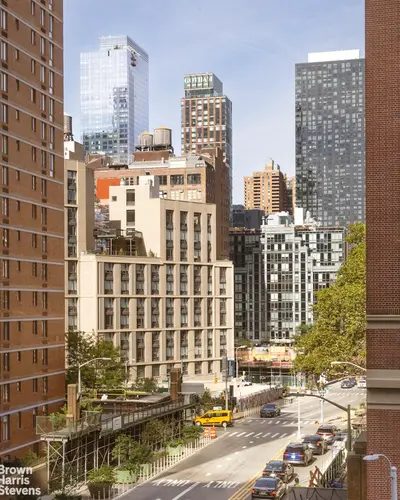
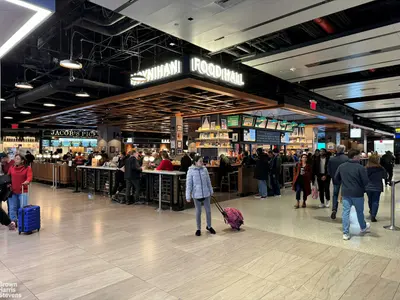
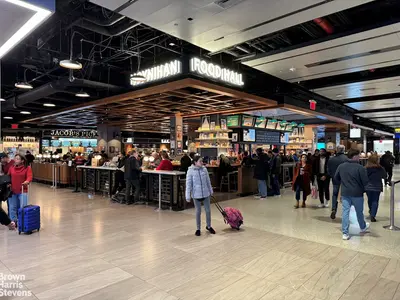
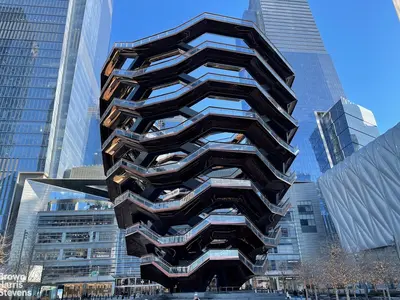
Convention Overlook is located near Hudson Yards, the Javits Center, Manhattan West, Moynihan Train Hall, and the 34th Street A/C/E trains. The building permits pets, pied-a-terres, parents buying with children, gifts, and guarantors. Residents must live in the building for two years before subletting, and then can sublet for four out of five years.
Looking for something special? Select off-market options at Convention Overlook may be available – connect with us for access.
View school info, local attractions, transportation options & more.
Experience amazing 3D aerial maps and fly throughs.
For some co-ops, instead of price per square foot, we use an estimate of the number of rooms for each sold apartment to chart price changes over time. This is because many co-op listings do not include square footage information, and this makes it challenging to calculate accurate square-foot averages.
By displaying the price per estimated room count, we are able to provide a more reliable and consistent metric for comparing sales in the building. While we hope that this gives you a clearer sense of price trends in the building, all data should be independently verified. All data provided are only estimates and should not be used to make any purchase or sale decision.
Year
Avg Price / Ft2 (Est)
Median Price / Ft2 (Est)
Avg. Actual Price
Med. Actual Price
Transactions
2025
-
-
-
-
0
2024
$1,109
$569,100
$1,109
$499,450
4
2023
$1,001
$490,750
$1,050
$453,500
6
2022
$998
$696,600
$1,007
$755,000
5
2021
$1,024
$473,600
$958
$415,000
15
2020
$1,057
$483,688
$1,023
$425,000
8
2019
$989
$629,500
$983
$490,000
5
2018
$1,073
$535,200
$1,036
$490,000
5
2017
$933
$602,000
$905
$639,000
7
2016
$936
$455,000
$936
$455,000
2
2015
$880
$544,750
$864
$435,500
10
2014
$796
$402,458
$782
$393,000
12
|
Year
Avg Price / Ft2 (Est)
Median Price / Ft2 (Est)
Avg. Actual Price
Med. Actual Price
Transactions
2013
$796
$417,383
$798
$400,000
10
2012
$638
$314,525
$645
$307,000
10
2011
$643
$285,808
$622
$285,000
13
2010
$603
$359,418
$599
$358,753
6
2009
$644
$309,143
$634
$279,000
7
2008
$732
$351,500
$754
$327,500
12
2007
$778
$399,333
$714
$327,500
18
2006
$708
$408,056
$701
$320,000
9
2005
$633
$320,558
$612
$310,000
19
2004
$406
$198,969
$417
$194,125
8
2003
$497
$262,292
$376
$245,000
23
Please note that price/ft2 calculations is from only 86% of total transactions during the period
|
Sign-up and we'll email you new listings in this building!
Whether you’re a buyer, investor, or simply curious, this report is your key to unlocking in-depth insights and analysis on .
Please confirm your details: