Murray Hill Terrace, 201 East 36th Street, NYC - Condo Apartments
- Apartments
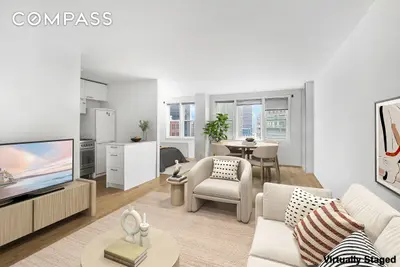
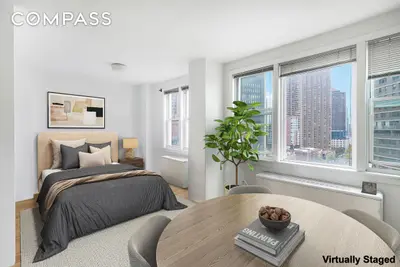
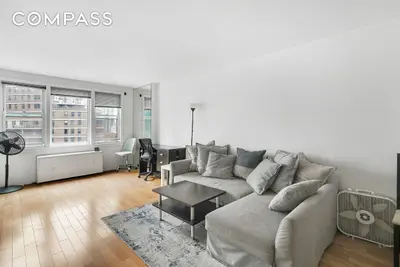
- Overview & Photos
- Maps
- Floorplans
- Sales Data & Comps
- Similar Buildings
- All Units


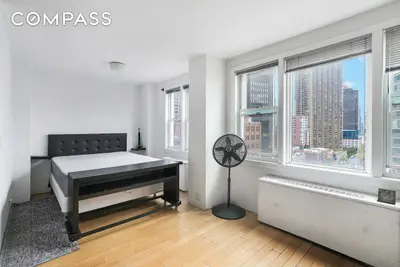
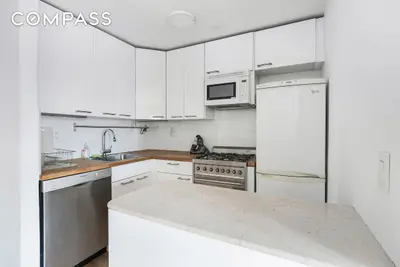


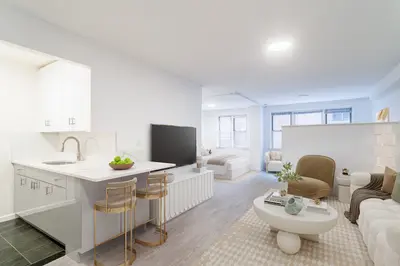


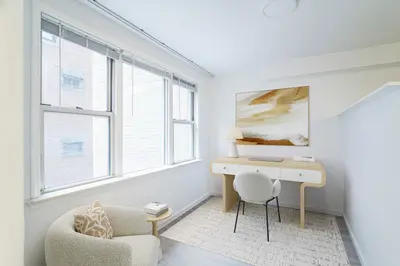
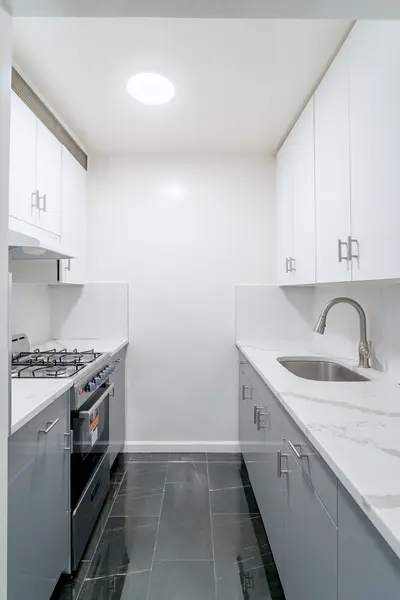
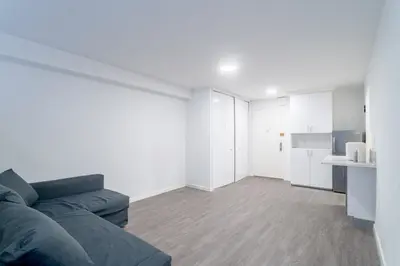
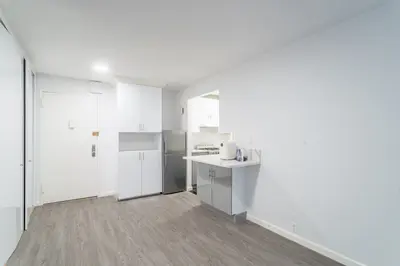
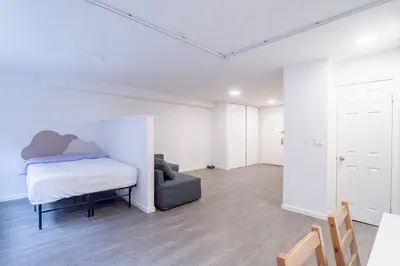

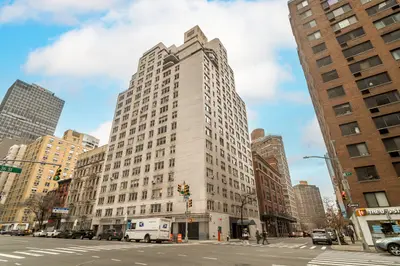
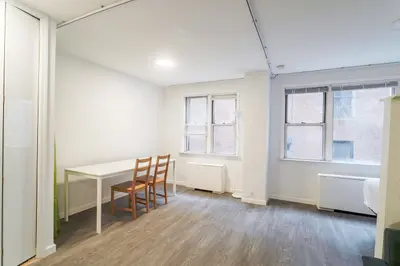
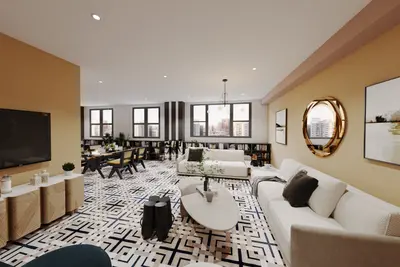

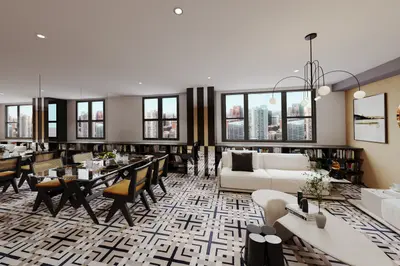

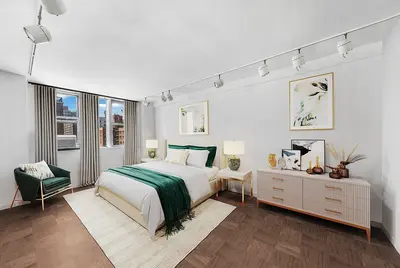
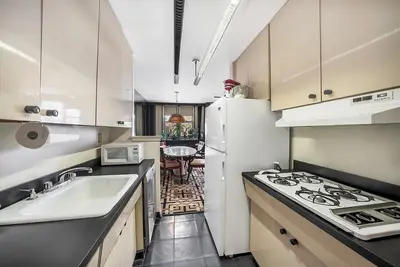


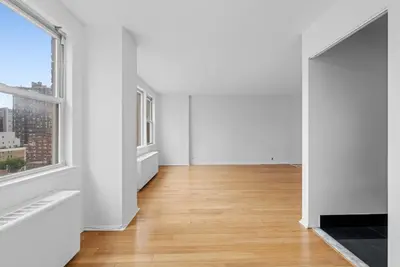

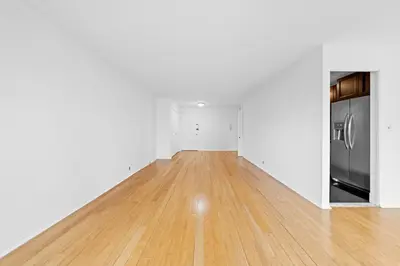
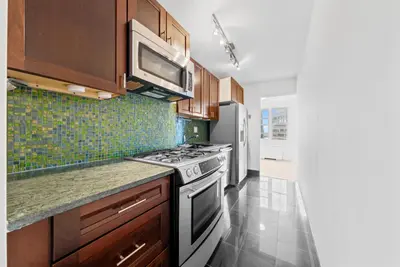
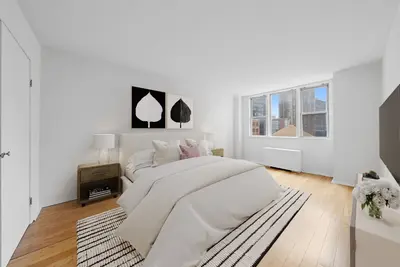
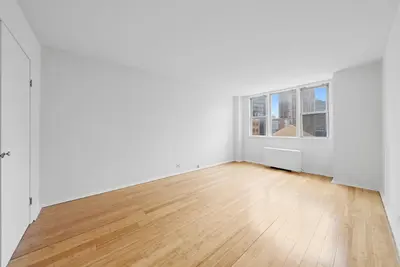


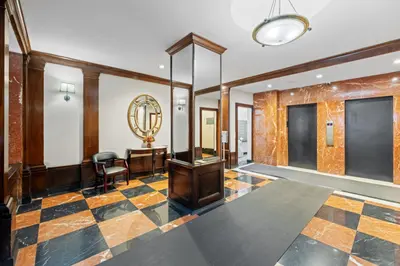
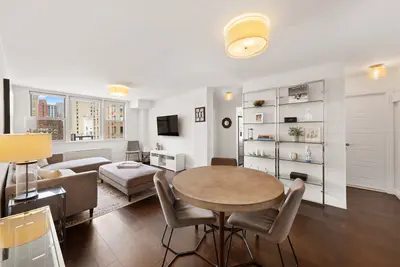
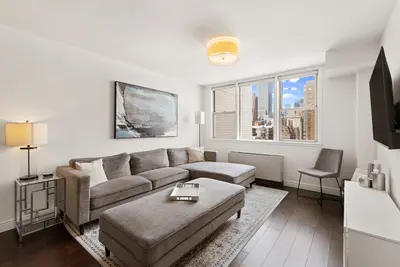

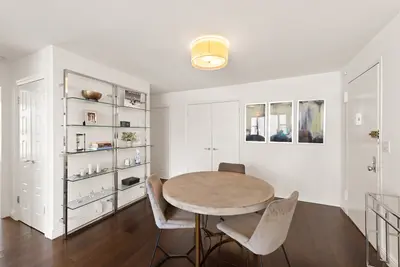
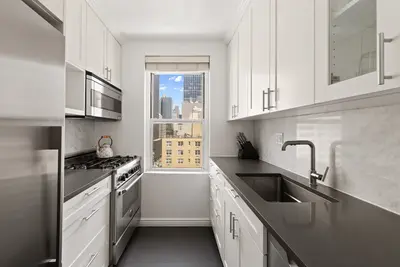
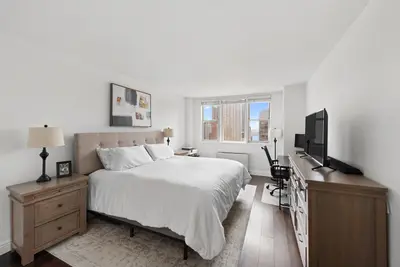
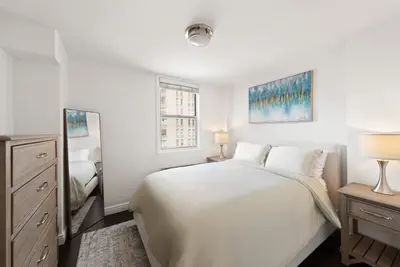
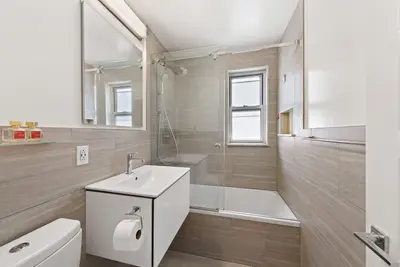
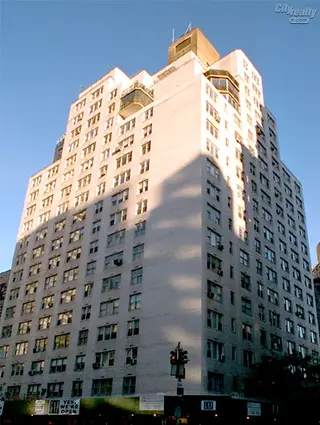
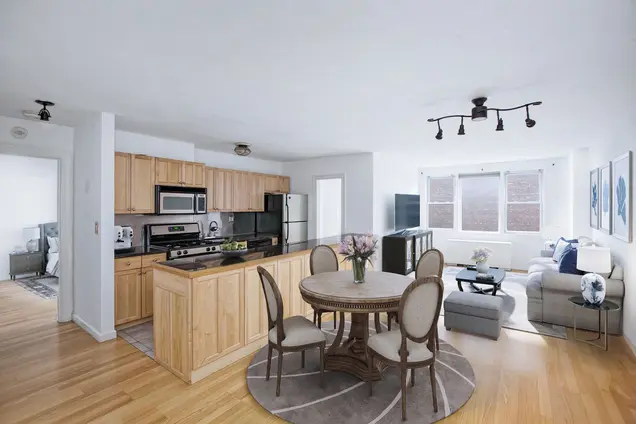
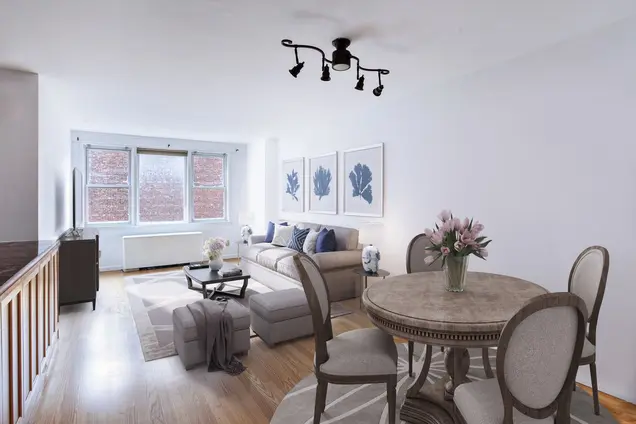
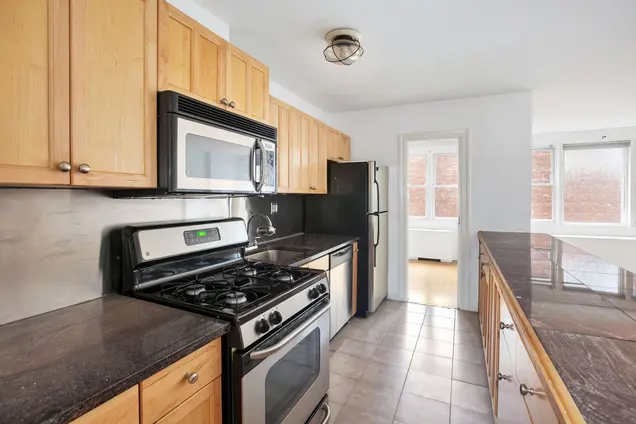
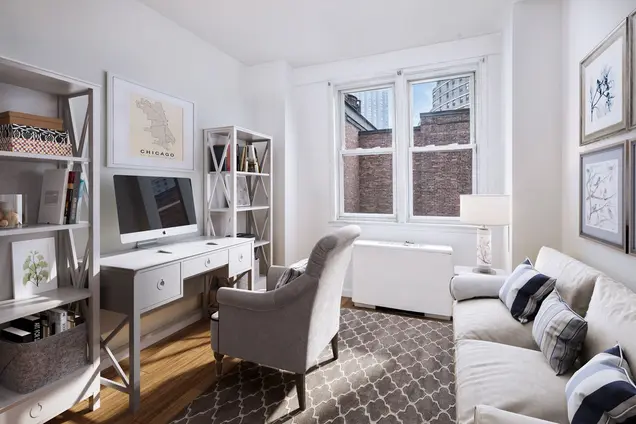
Murray Hill Terrace is a 19-story, 118-unit condominium located at 201 East 36th Street. Originally built in 1963, the building was converted to a condominium in 1985 and features a recently renovated lobby.
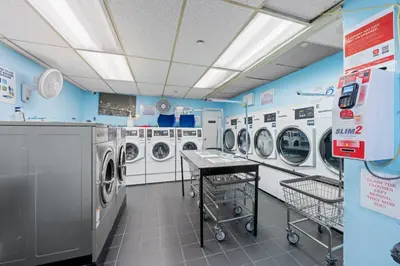
This full-service, white-brick building offers 24-hour doorman service, a live-in resident manager, handymen, and porters. Amenities include a bike room, central laundry facilities, and air conditioning included in monthly common charges. The pet-friendly policy welcomes dogs under 40 pounds.
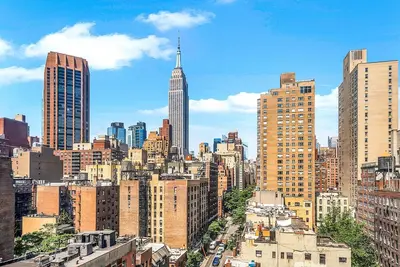
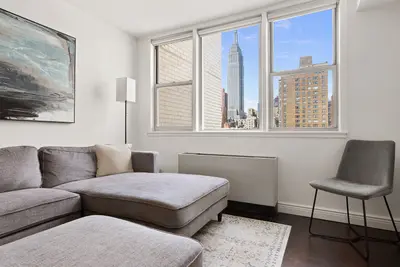
Ideally situated in Murray Hill, residents enjoy proximity to Grand Central Terminal, the East River Ferry, Trader Joe’s, Fairway, and a vibrant array of parks and restaurants. The location also provides easy access to nearby neighborhoods like Kips Bay, NoMad, and Midtown, with excellent public transit options, including subway lines (4/5/6/7).


View school info, local attractions, transportation options & more.
Experience amazing 3D aerial maps and fly throughs.
Broker & Buyer Comments