Shh... Many units sell without being publicly listed.
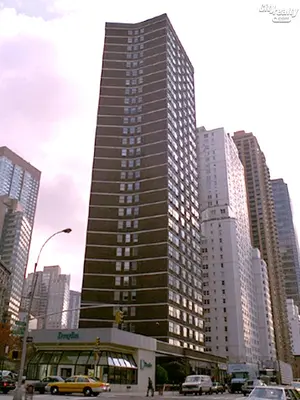
Explore off-market possibilities at Coliseum Plaza – inquire to find out about residences with owners open to private offers!
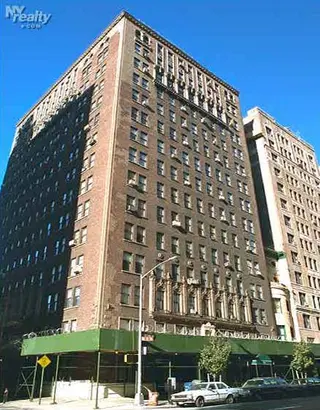
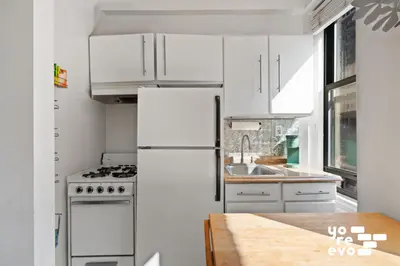
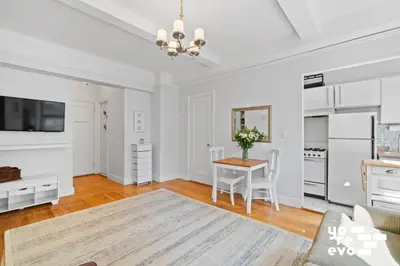
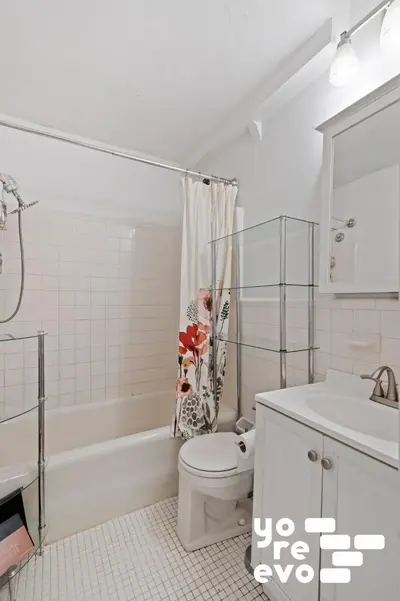
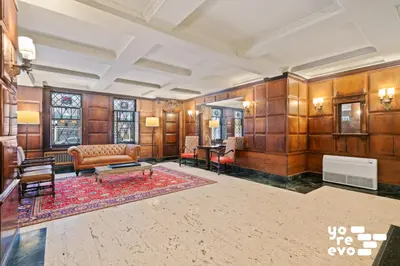
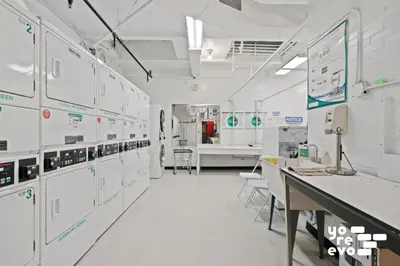
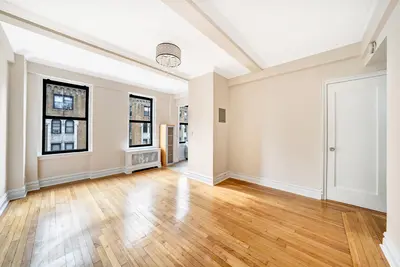
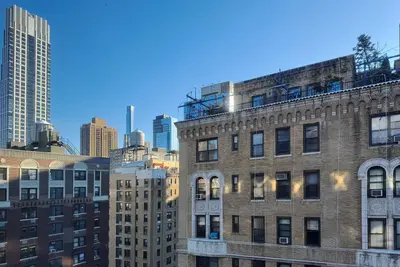
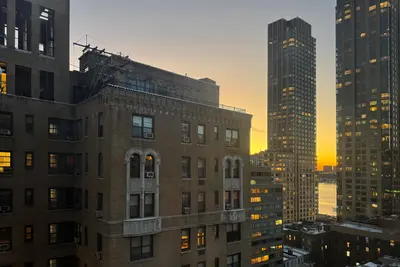
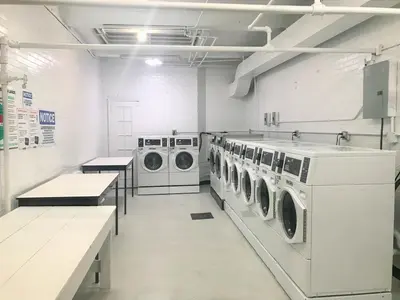
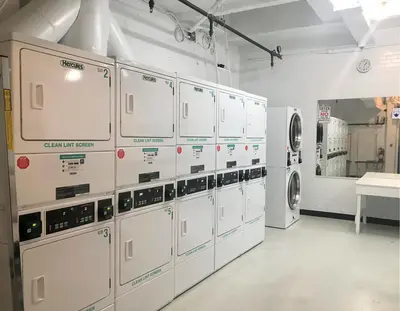
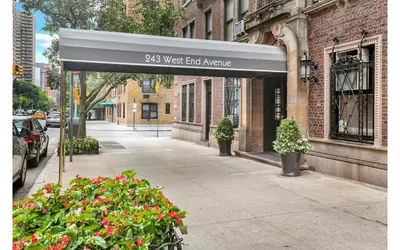
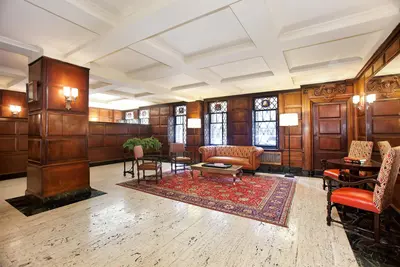
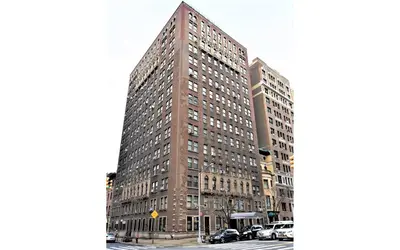
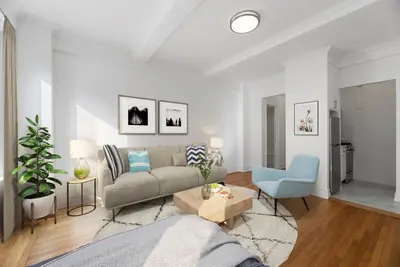
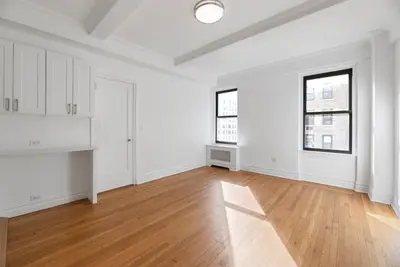
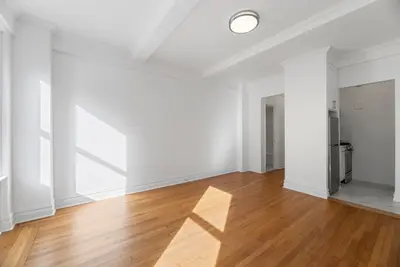
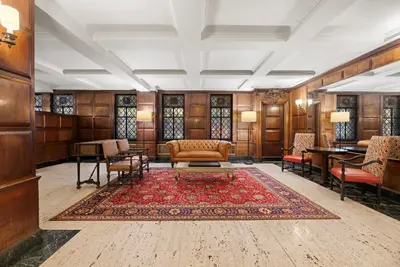
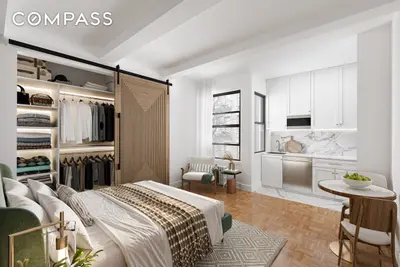
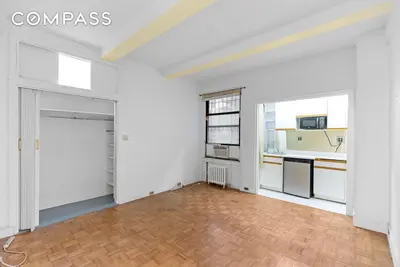
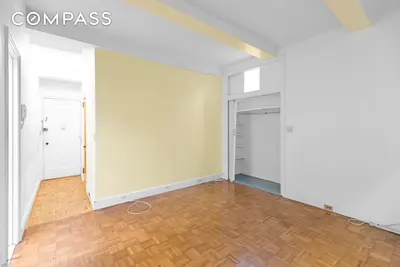
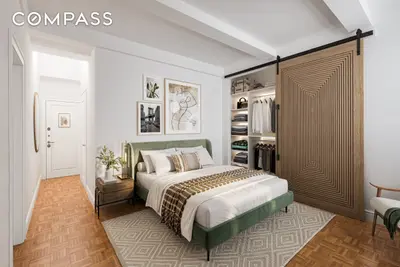
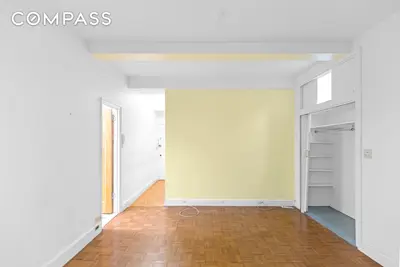
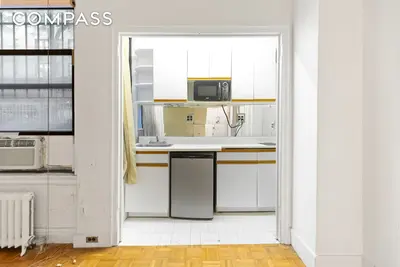
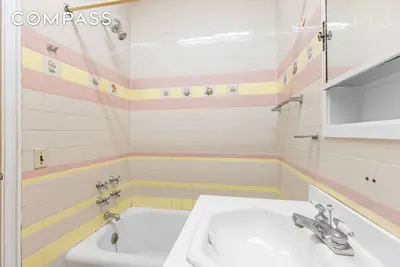
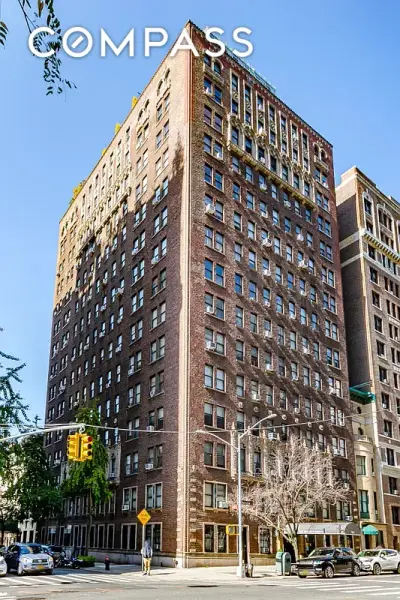
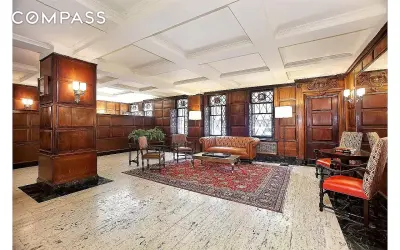
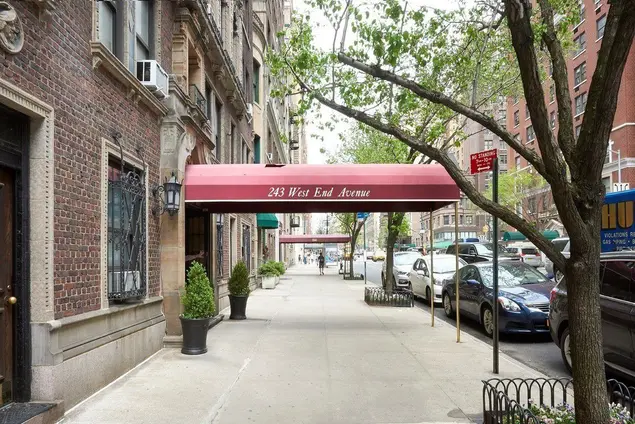
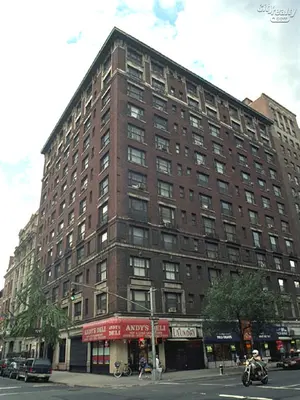
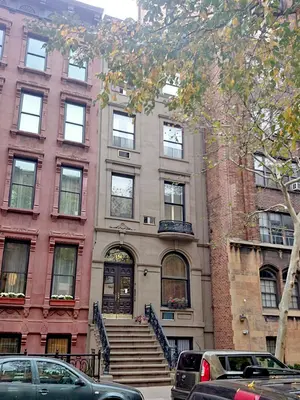
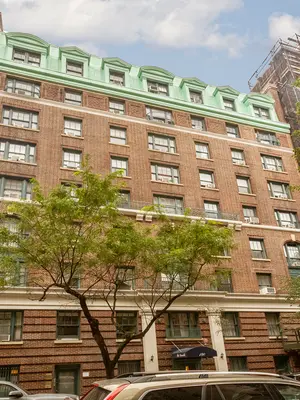
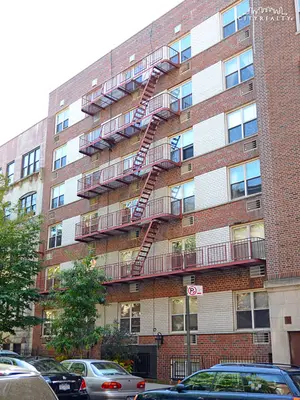
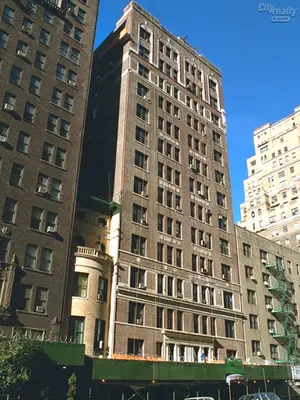
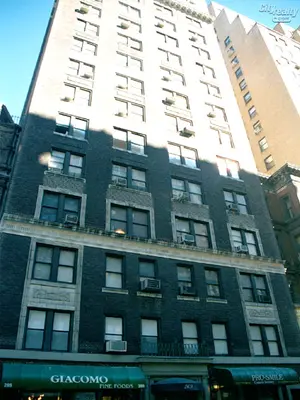
Designed by Emery Roth, 243 West End Avenue is a full-service coop with a 24-hour doorman, live-in super, porters, huge laundry facility, storage lockers and bike storage. The 1,2,3 subway stop, Trader Joe's and Riverside Park are a block away, to say nothing of all the best shops the West Side has to offer. The coop has a very friendly sublet policy and allows gifting and co-purchase. Cats only.
Explore off-market possibilities at Coliseum Plaza – inquire to find out about residences with owners open to private offers!

View school info, local attractions, transportation options & more.
Experience amazing 3D aerial maps and fly throughs.
For some co-ops, instead of price per square foot, we use an estimate of the number of rooms for each sold apartment to chart price changes over time. This is because many co-op listings do not include square footage information, and this makes it challenging to calculate accurate square-foot averages.
By displaying the price per estimated room count, we are able to provide a more reliable and consistent metric for comparing sales in the building. While we hope that this gives you a clearer sense of price trends in the building, all data should be independently verified. All data provided are only estimates and should not be used to make any purchase or sale decision.
|
Year
Avg Price / Room (Est)
Avg. Actual Price
Med. Actual Price
Transactions
2025
$240,667
$601,667
3
2024
$164,285
$415,078
9
2023
$140,050
$350,125
4
2022
$148,680
$371,700
5
2021
$148,511
$384,000
15
2020
$164,000
$590,000
2
2019
$164,240
$410,600
5
2018
$180,763
$451,907
6
2017
$150,200
$375,500
2
2016
$175,699
$645,125
8
2015
$157,129
$408,388
8
2014
$133,378
$333,444
9
|
Year
Avg Price / Room (Est)
Avg. Actual Price
Med. Actual Price
Transactions
2013
$132,400
$331,000
5
2012
$123,943
$334,125
8
2011
$128,829
$322,071
7
2010
$149,305
$487,667
6
2009
$115,667
$289,167
3
2008
$148,125
$389,231
13
2007
$146,800
$387,833
6
2006
$116,120
$380,500
7
2005
$139,107
$372,600
10
2004
$131,983
$398,667
6
2003
$76,800
$193,375
8
|
the following is a slider of images. For screen reader users, all slides are visible at all time so you may ignore control buttons.
Sign-up and we'll email you new listings in this building!
Whether you’re a buyer, investor, or simply curious, this report is your key to unlocking in-depth insights and analysis on .
Please confirm your details:


Broker & Buyer Comments