👀 Your NYC apartment tour is just a click away!
My Inquiries
Turn Favorites
into Tours!
Found a listing you love?
Submit a “Book a Tour” inquiry!
Our team will arrange a private tour for any apartment or building in New York City.
Perfectly tailored to your schedule.
- Apartments
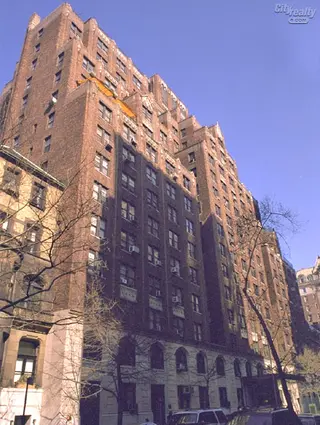
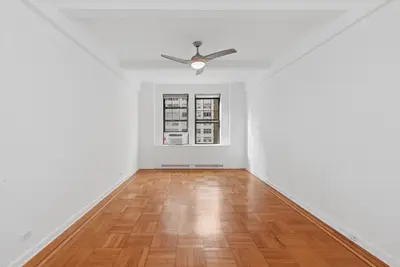
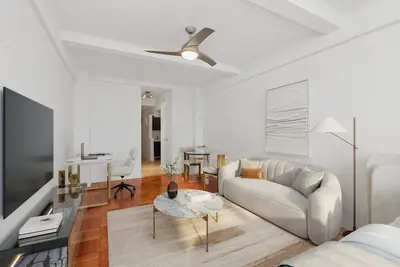
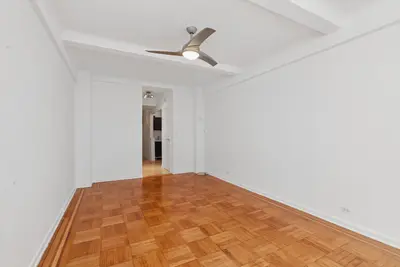
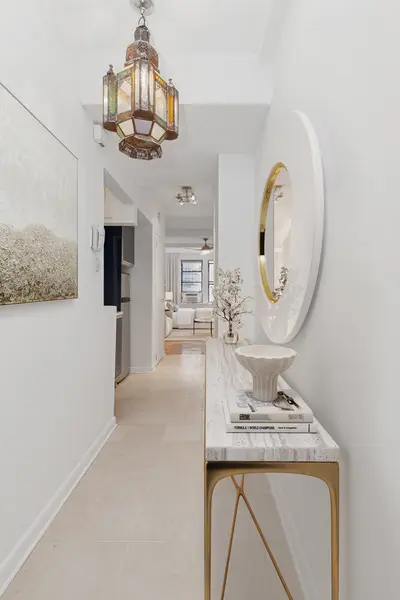
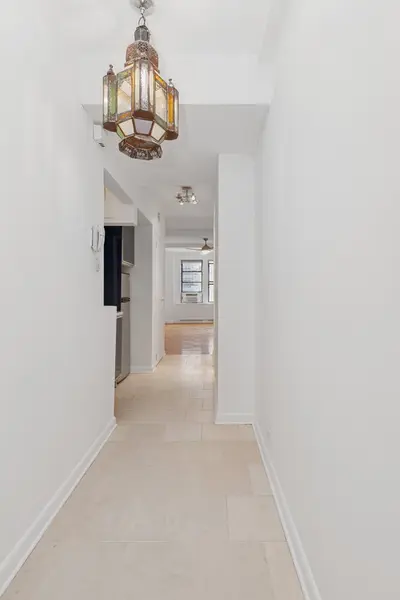
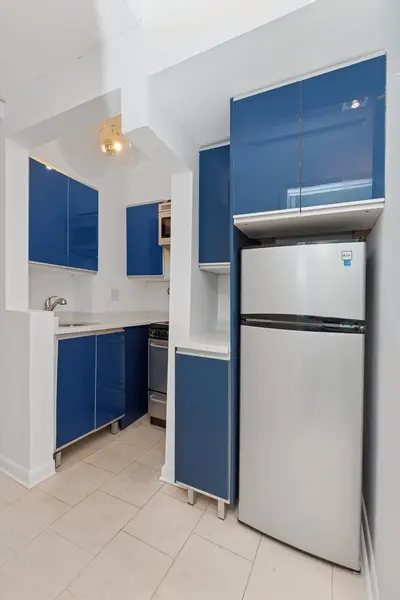
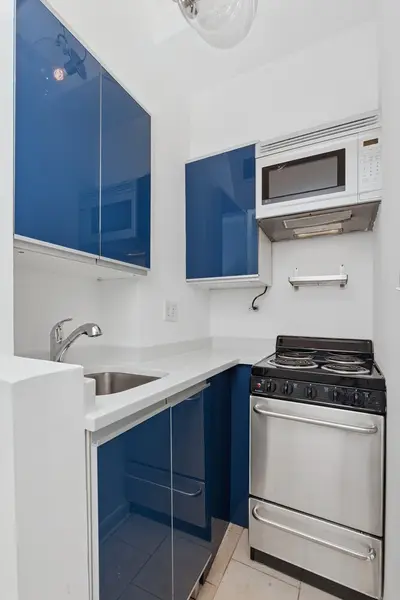
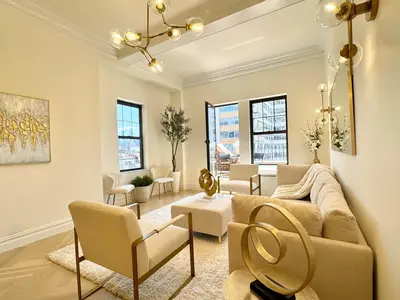
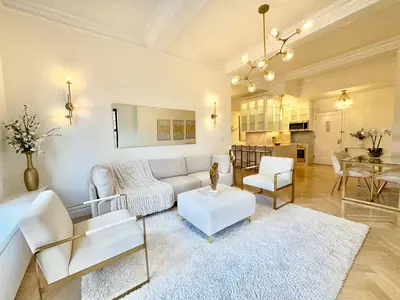
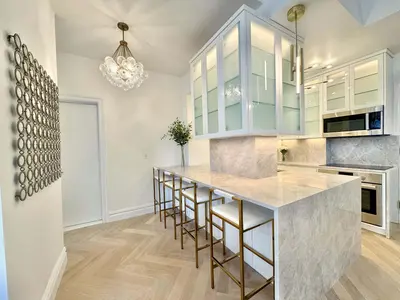
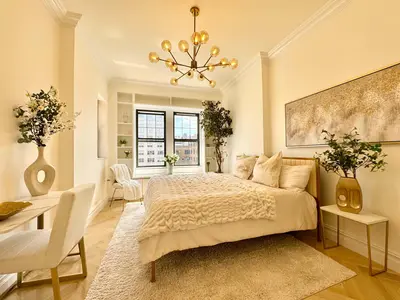
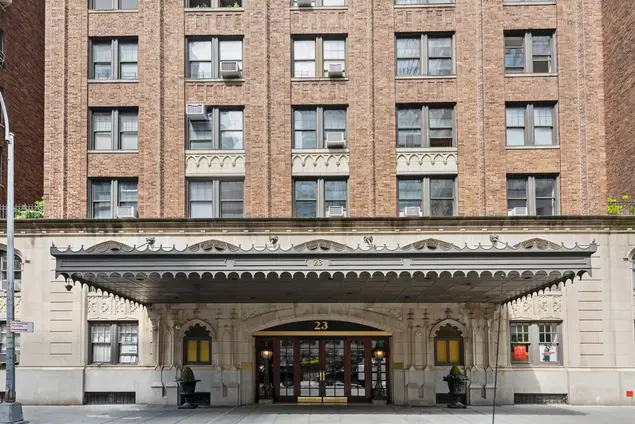
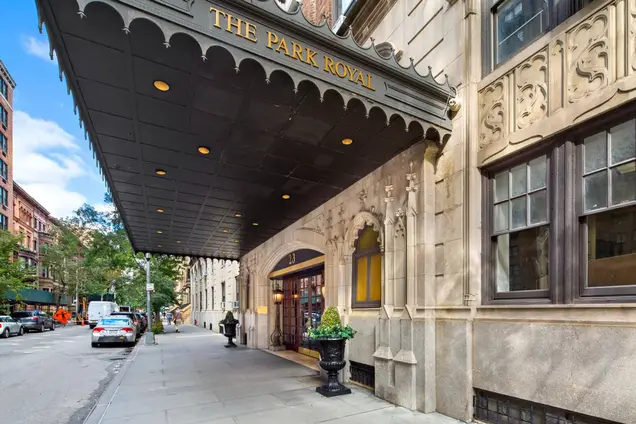
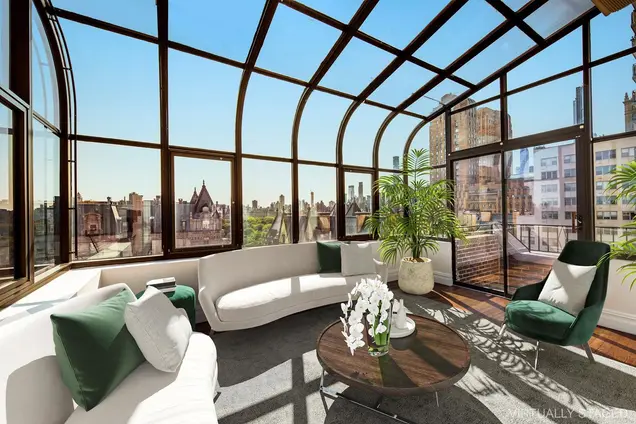
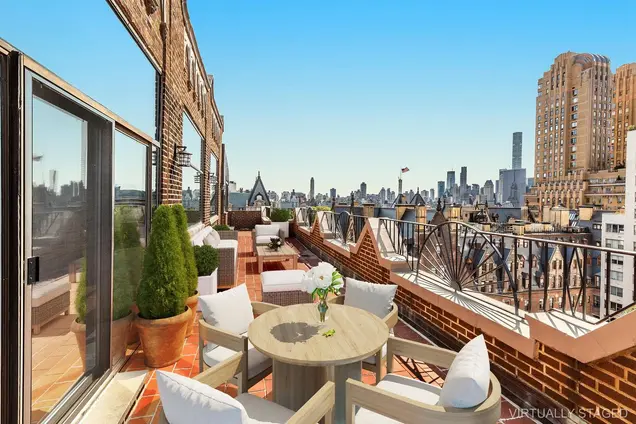
- Overview & Photos
- Maps
- Building Specialists
- Floorplans
- Sales Data & Comps
- Similar Buildings


Broker & Buyer Comments