Skip to Content
57 Thompson Street - SoHo
57 Thompson Street
Co-Op in SoHo
  • Apartments
  • Overview & Photos
  • Maps
  • Floorplans
  • Sales Data & Comps
  • Similar Buildings
Get alerts with new listings in this building!
57 Thompson Street

57 Thompson Street

Co-op located in SoHo, between Broome Street & Spring Street  Map

  • Apartments For Sale (1)
  • For Rent (1)
  • Recent Sales (6)
  • All Units in Building (32)
Unit #
Beds
Baths
Size
Price / Ft2
Price
Listed on
Days on Market
Unit #
Beds
Baths
Size
Price / Ft2
Price
Listed on
Days on Market
Unit #
Beds
Baths
Size
Closing Price
Price / Ft2
Asking Price
Sold on
View Full Sales History

Overview of 57 Thompson Street

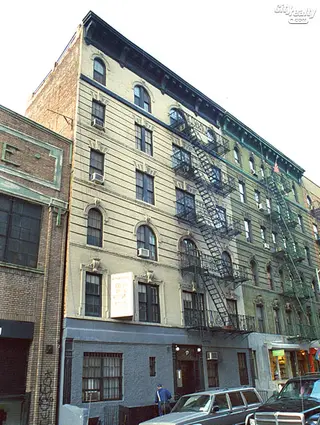
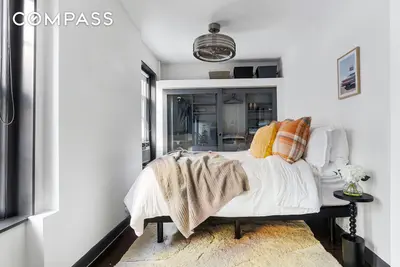
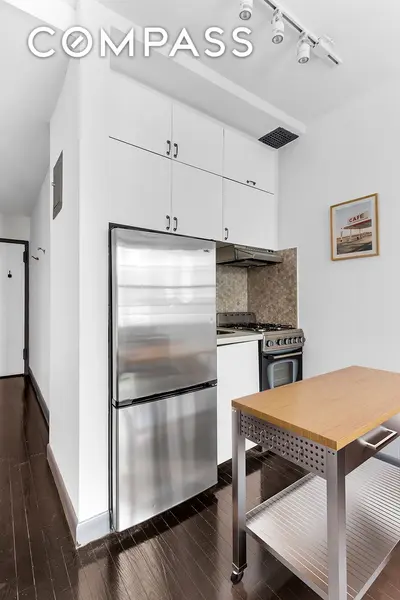
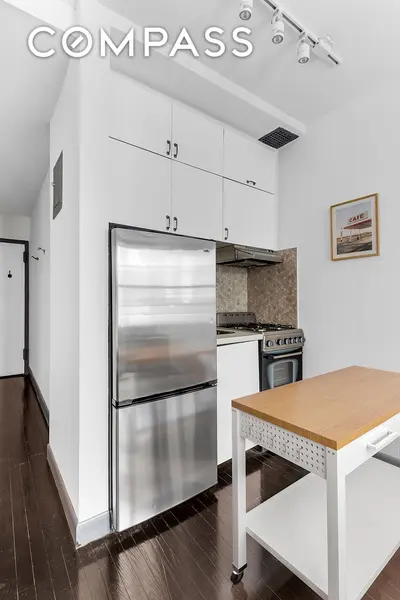
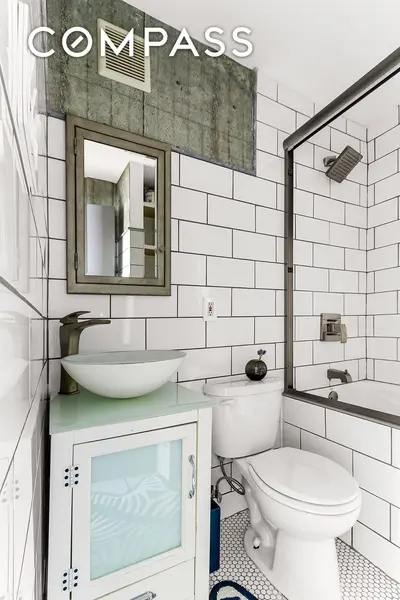
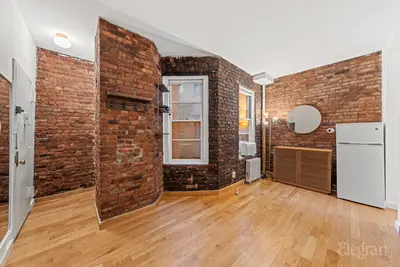
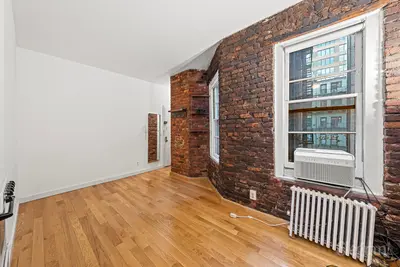
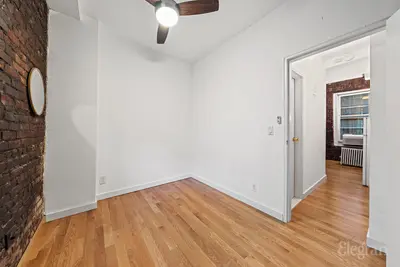
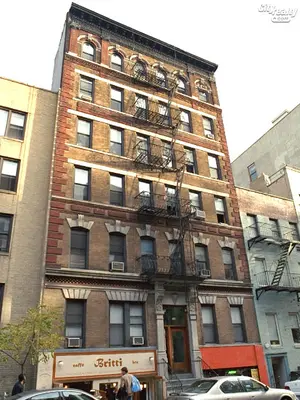
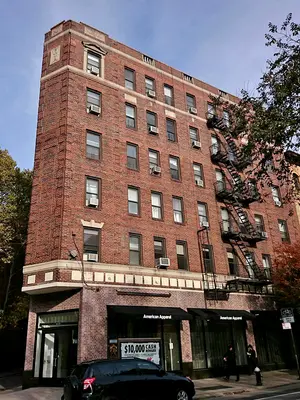
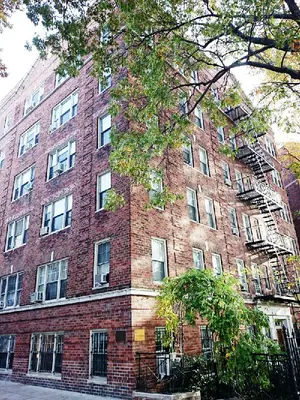
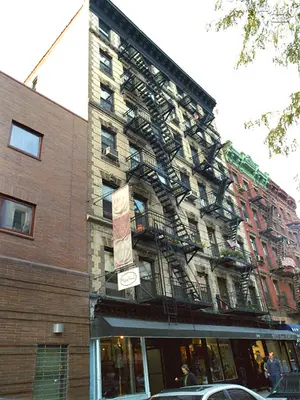
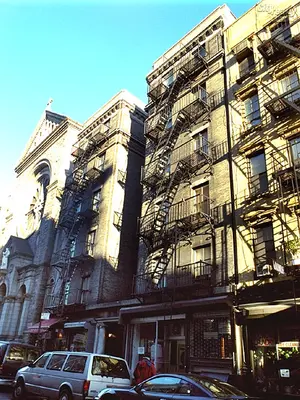
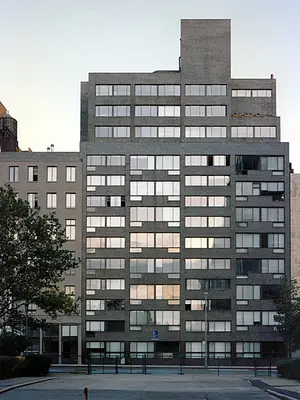
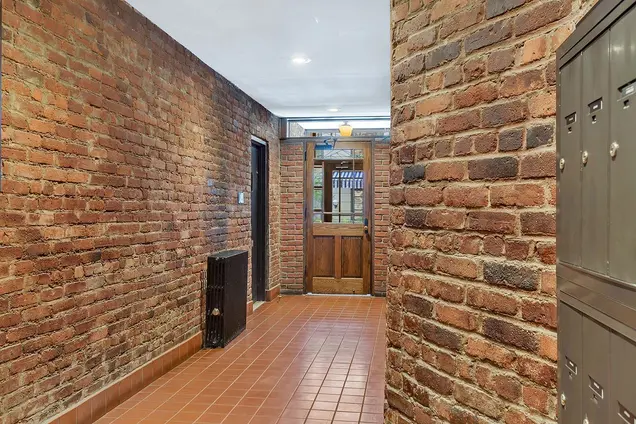
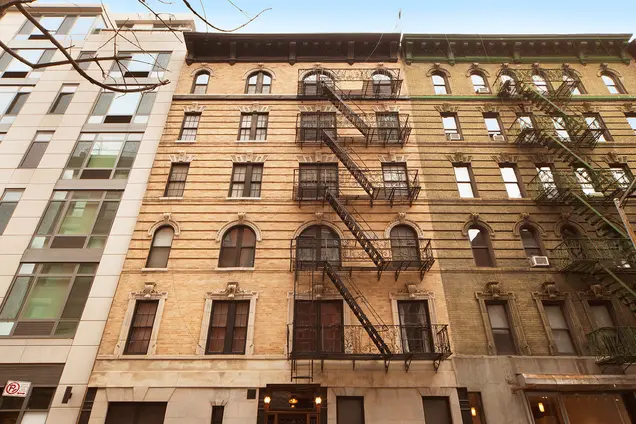
57 Thompson Street is a pre-war 6-story, 32-unit cooperative in downtown Manhattan's SoHo neighborhood finished in 1920 and featuring exposed brick hallways. Pets will be considered, and a part-time super lives across the street. Situated between Broome and Spring Streets, it is in a quaint section of Soho amid small cafes, fine dining, trendy hotels and boutiques. The quiet, tree-lined street is convenient to all subway lines and Trader Joe's is around the corner.

Year Built
1920
Apartments
32
Floors
6
Pets: Small pets only
Neighborhood
Min Down
20%
32Apartments
View All Past
Sales & Rentals
in Building

Schedule a Visit

Select when you would like to view apartments.
Fri
18
Sat
19
Sun
20
Mon
21
Tue
22
Wed
23
Thu
24
Fri
25
Sat
26
Sun
27

What Time?

9am-noon
Noon-3pm
3pm-6pm
Any time
You can also call us anytime at
☎️ (212) 755-5544

Amenities

  • Pre War
  • Walk Up
  • Intercom
  • Elevator
  • Outdoor Entertainment Space
  • Live-In Superintendent
  • Terraces / Balconies

Shh... Many units sell without being publicly listed.

Explore off-market possibilities at 57 Thompson Street – inquire to find out about residences with owners open to private offers!

{ "key" : "AIzaSyDquABdSLhathmwfnoTcYwA1BY6coZZyZk", "lat": 40.72412, "lng": -74.00357, "marker": { "icon": "https://img3.cityrealty.com/neo/i/w/amenities/base.png" } }

Nearby Subways

  1. C
  2. E
at 6th Ave and Vandam 0.15 miles
  1. 1
at Varick 0.17 miles
  1. A
at Thompson 0.24 miles
  1. N
  2. R
at Broadway 0.31 miles
  1. J
  2. Z
  3. Q
  4. 6
at Broadway 0.33 miles
  1. M
  2. B
  3. D
  4. F
at Houston 0.39 miles

Nearby Schools

  1. Chelsea Career And Technical Education High School
    Grades: 9,10,11,12
  2. NYC iSchool
    Grades: 9,10,11,12
  3. High School 560 City As School
    Grades: 9,10,11,12
  4. Ps 721 Manhattan Occupational Training Center
    Grades: 6,7,8,9,10,11,12,UG
  5. Ps 130 Hernando De Soto
    Grades: PK,KG,1,2,3,4,5
Data courtesy of GreatSchools.org
  1. Elisabeth Irwin High School
    Grades: PK,TK,KG,1,2,3,4,5,6,7,8,9,10,11,12
  2. St. Anthonys School
    Grades: UG
  3. Portfolio School
    Grades: KG,1,2,3,4,5,6,7
  4. LREI Lower and Middle School
    Grades: PK,TK,KG,1,2,3,4,5,6,7,8,9,10,11,12
  5. Our Lady of Pompeii School
    Grades: PK,TK,KG,1,2,3,4,5,6,7,8
Data courtesy of GreatSchools.org
Loading...

57 Thompson Street Floorplans

Apt 2B
1 bed, 1 bath, Approx. ft2
Apt 3A
1 bed, 1 bath, Approx. -1 ft2
Apt 1A
Studio, 1 bath, Approx. ft2
Last sold for $592,500
on Sep 7, 2023
View Unit History
Apt 5B
1 bed, 1 bath, Approx. 500 ft2
Last sold for $695,000
on Apr 15, 2016
View Unit History
Apt 3F
Last listed for $2,800
Taken off market Nov 13, 2024
View Unit History
Apt 2C
Last listed for $3,995
Taken off market Mar 12, 2021
View Unit History
View All Floorplans

Sales History

Price/Room (Est)

Why are we displaying the estimated price per room?

For some co-ops, instead of price per square foot, we use an estimate of the number of rooms for each sold apartment to chart price changes over time. This is because many co-op listings do not include square footage information, and this makes it challenging to calculate accurate square-foot averages.

By displaying the price per estimated room count, we are able to provide a more reliable and consistent metric for comparing sales in the building. While we hope that this gives you a clearer sense of price trends in the building, all data should be independently verified. All data provided are only estimates and should not be used to make any purchase or sale decision.

Price/Ft2 (Est)
View Full Closing History
Created with Highstock 5.0.0SalesPrice per Room (Estimated)200320042005200620072008200920102011201220132014201520162017201820192020202120222023202420250246810$50,000$100,000$150,000$200,000$250,000$300,000
Year
Avg Price / Ft2 (Est) Median Price / Ft2 (Est) Avg. Actual Price Med. Actual Price
Transactions
2025
-
-
-
-
0
2024
-
-
-
-
0
2023
-
$592,500
-
$592,500
1
2022
-
$556,667
-
$610,000
3
2021
$1,800
$757,500
$1,800
$757,500
2
2020
-
$622,500
-
$622,500
2
2019
-
-
-
-
0
2018
$1,539
$938,275
$1,539
$938,275
2
2017
-
$759,800
-
$615,000
5
2016
$1,530
$647,500
$1,530
$652,500
4
2015
$1,072
$611,500
$1,072
$611,500
2
2014
-
-
-
-
0
Year
Avg Price / Ft2 (Est) Median Price / Ft2 (Est) Avg. Actual Price Med. Actual Price
Transactions
2013
-
-
-
-
0
2012
-
$330,000
$330,000
2
2011
-
$450,650
$450,650
1
2010
-
-
-
-
0
2009
$951
$383,125
$951
$371,750
4
2008
$1,125
$427,460
$1,125
$427,460
2
2007
-
$360,000
$360,000
2
2006
$764
$352,500
$764
$352,500
2
2005
-
$328,750
$342,500
4
2004
$686
$334,000
$710
$347,500
6
2003
$563
$186,500
$563
$186,500
2
Please note that price/ft2 calculations is from only 30% of total transactions during the period
Year
Avg Price / Room (Est) Avg. Actual Price Med. Actual Price
Transactions
2025
-
-
0
2024
-
-
0
2023
$237,000
$592,500
1
2022
$194,889
$556,667
3
2021
$252,500
$757,500
2
2020
$207,500
$622,500
2
2019
-
-
0
2018
$273,527
$938,275
2
2017
$222,027
$759,800
5
2016
$215,833
$647,500
4
2015
$181,863
$611,500
2
2014
-
-
0
Year
Avg Price / Room (Est) Avg. Actual Price Med. Actual Price
Transactions
2013
-
-
0
2012
$118,567
$330,000
2
2011
$150,217
$450,650
1
2010
-
-
0
2009
$127,708
$383,125
4
2008
$152,239
$427,460
2
2007
$130,000
$360,000
2
2006
$107,000
$352,500
2
2005
$113,917
$328,750
4
2004
$110,183
$334,000
6
2003
$75,000
$186,500
2

Sales History by Apartment Size

View Full Closing History
Show:
Created with Highstock 5.0.0Price/Room20042005200620072008200920102011201220132014201520162017201820192020202120222023$50,000$100,000$150,000$200,000$250,000$300,000

Pricing Comparison of Similar Buildings

View Detailed Comparison
Average Price per Sq. Ft.
$724,500
-
$652,050
-
$579,600
-
$507,150
-
$434,700
-
$362,250
-
$289,800
-
$217,350
-
$144,900
-
$72,450
-
$0
-
Bleecker Court
25 Minetta Lane
22 Leroy Street
211 Thompson Street
185 West Houston Street
88 Bleecker Street
64 MacDougal Street
149 Sullivan Street
110 Thompson Street
 
|||


Similar Buildings

The Henry
between Amsterdam Avenue & Broadway
Broadway Corridor
Exquisite and Inviting Upper West Side condos. A remarkable blend of elegance and modern luxury by Robert A.M. Stern Architects. Sumptuous amenities for socializing, entertainment, wellness, and pure joy.
Learn More

the following is a slider of images. For screen reader users, all slides are visible at all time so you may ignore control buttons.


Before you move on from this page

Sign-up and we'll email you new listings in this building!

or
Save Building with Email
By continuing you accept the Terms & Privacy Policy