Marlo Towers, 301 East 48th Street - Turtle Bay/United Nations
- Apartments
- Overview & Photos
- Maps
- Floorplans
- Sales Data & Comps
- Similar Buildings
- All Units
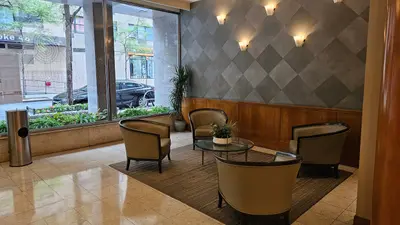
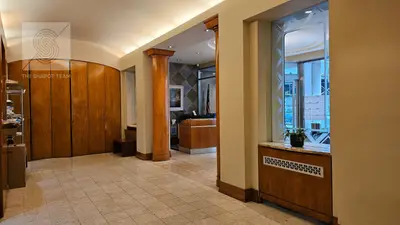


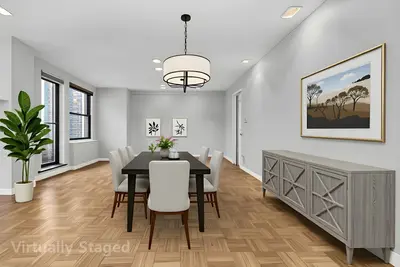
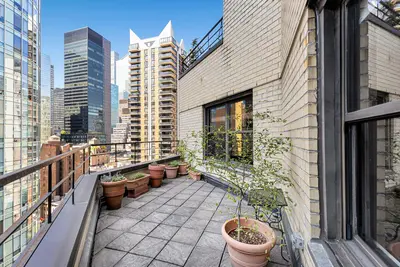
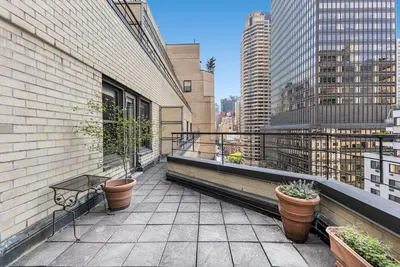
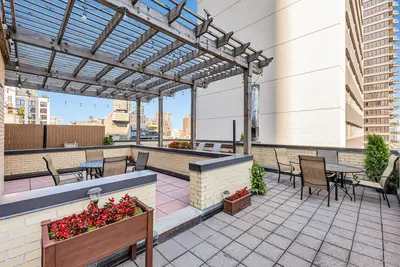

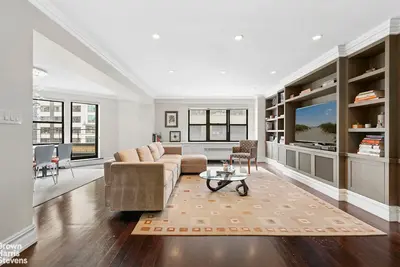

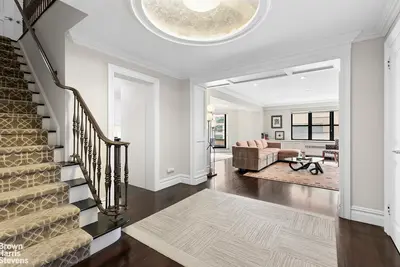

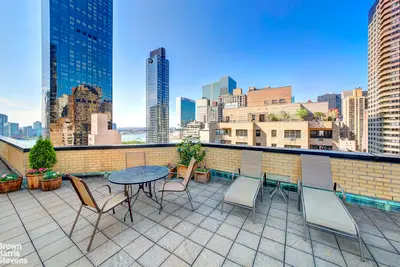


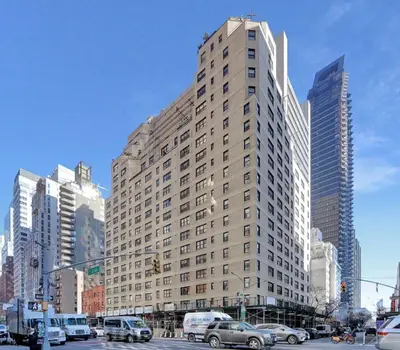
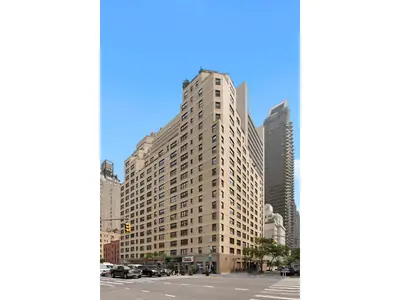


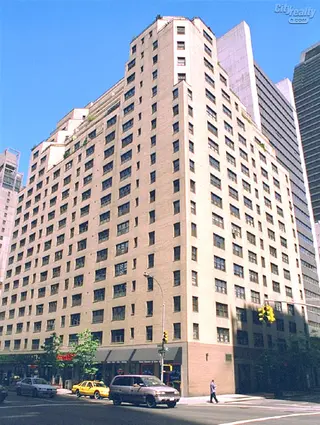
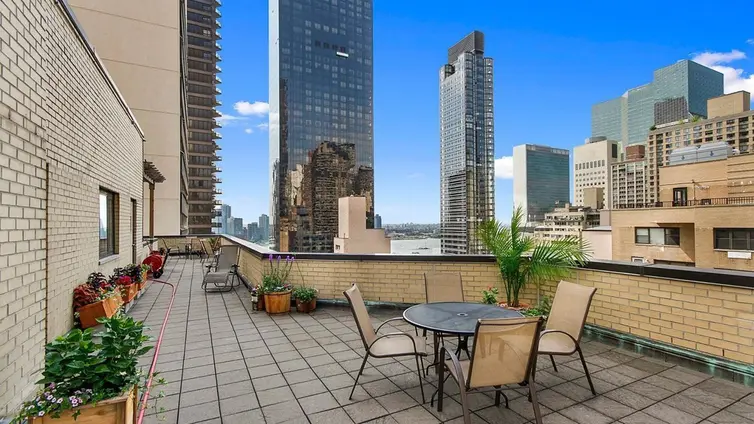
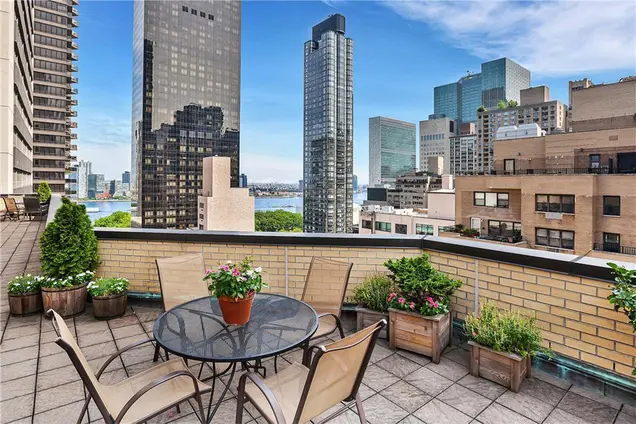
Marlo Towers, completed in 1961 and converted to a cooperative in 1981, is a 19-story gray brick building located at 301 East 48th Street in Manhattan's Turtle Bay neighborhood. The full-service building contains 196 units and is distinguished by its thoughtful amenities, including a furnished roof deck offering panoramic East River and city skyline views.
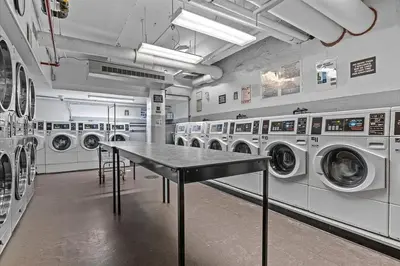
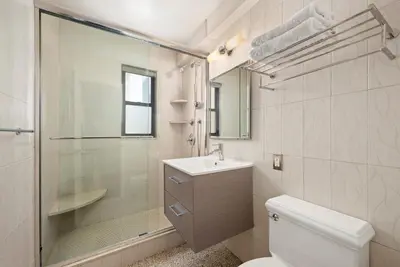
The building provides comprehensive services with a 24-hour doorman and live-in superintendent. Residents benefit from convenient features including a common laundry room, bike storage, complimentary luggage storage on each floor (two pieces per resident), and an indoor-accessible parking garage. A Morton Williams supermarket occupies the building's retail space at street level.
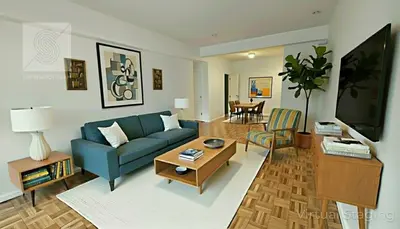
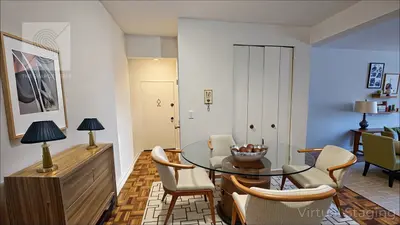
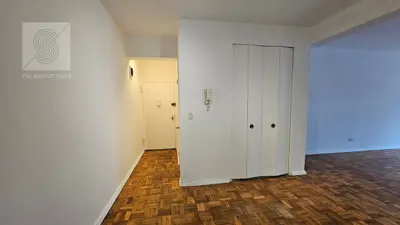
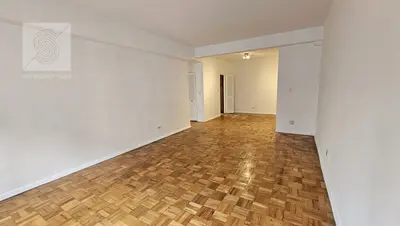
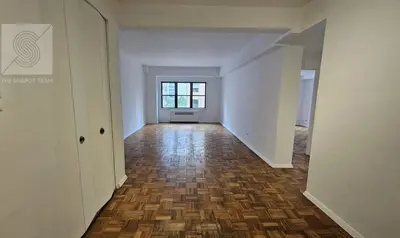
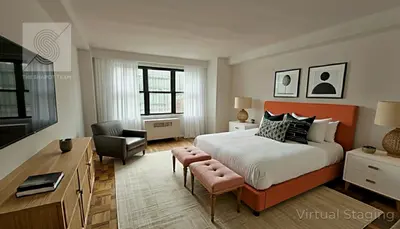
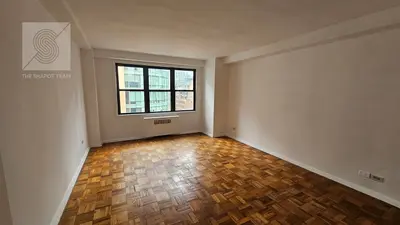
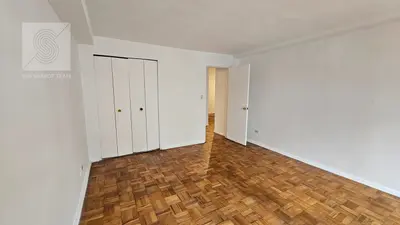
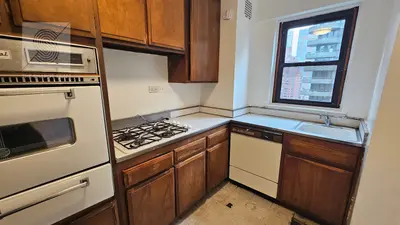
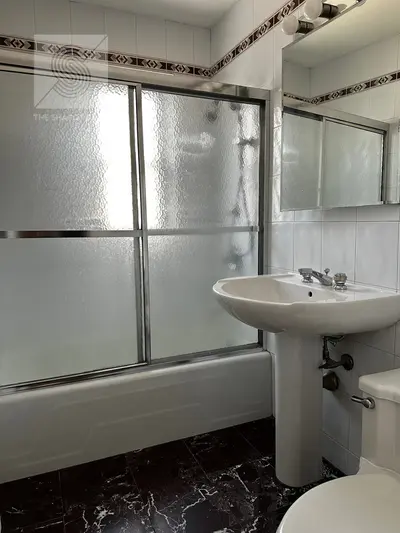
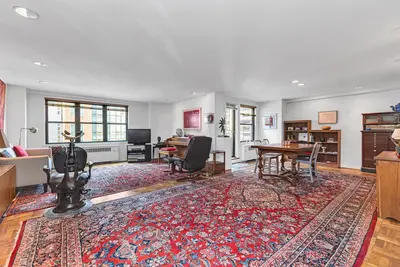
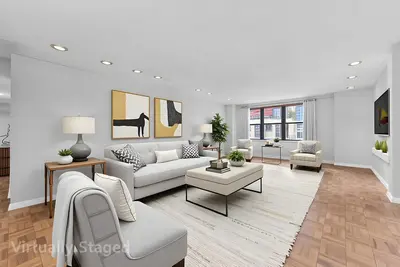
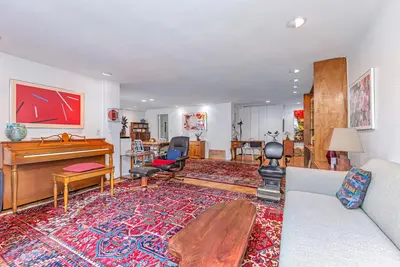
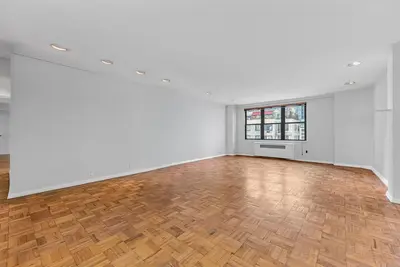
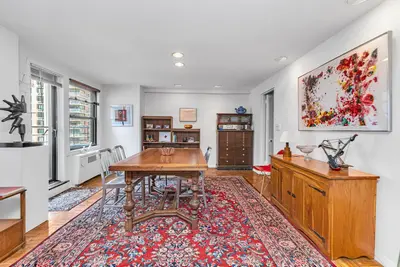
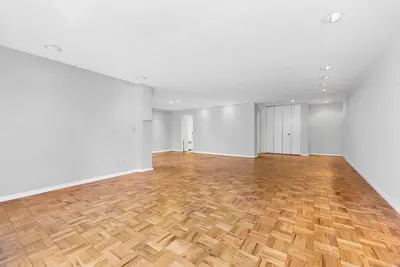
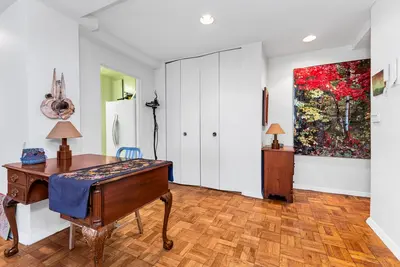
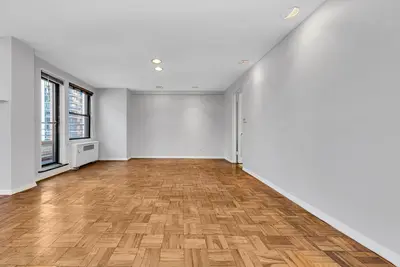
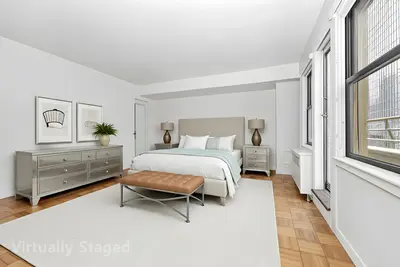
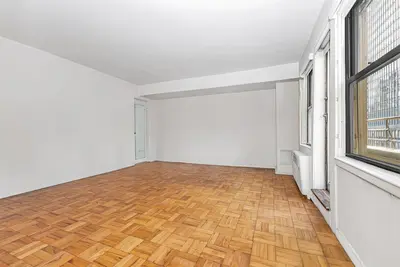
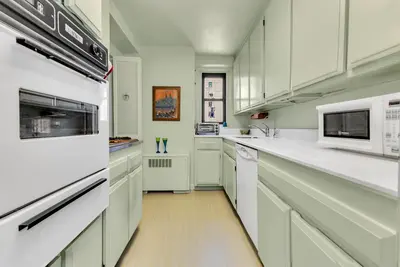
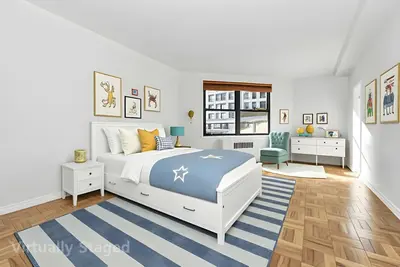
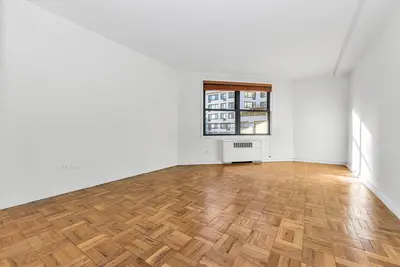
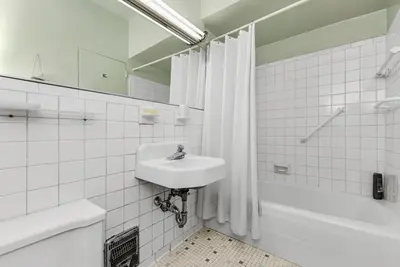
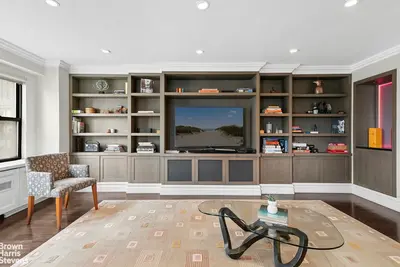
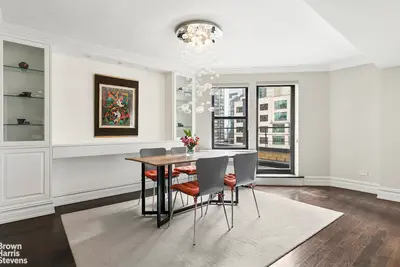
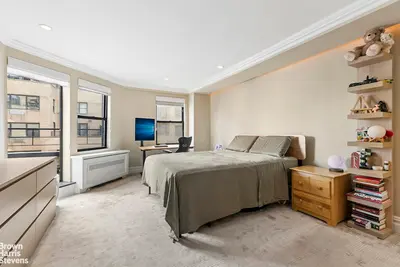
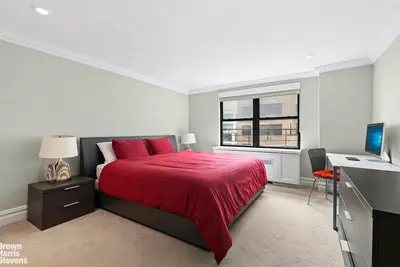
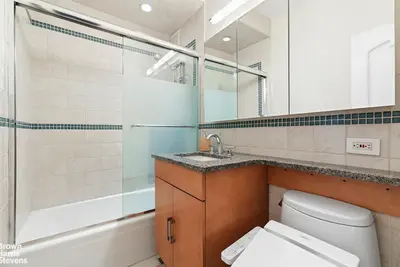
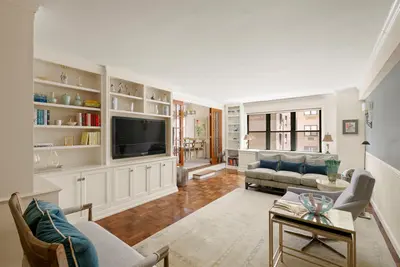
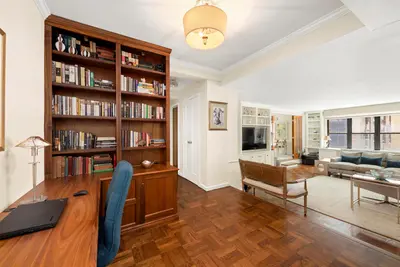
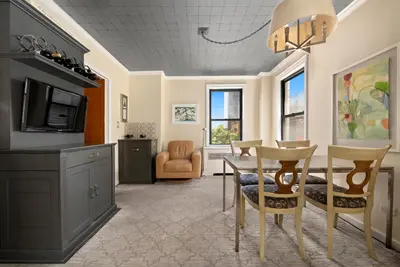
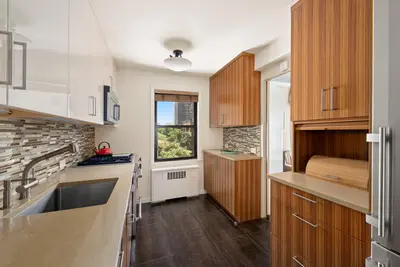
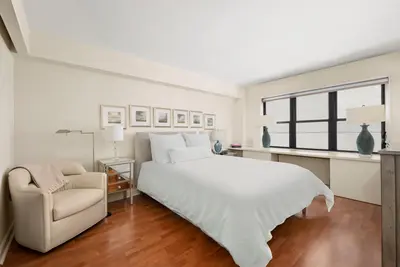
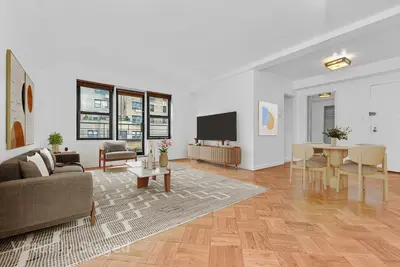
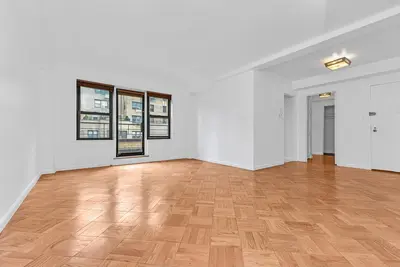
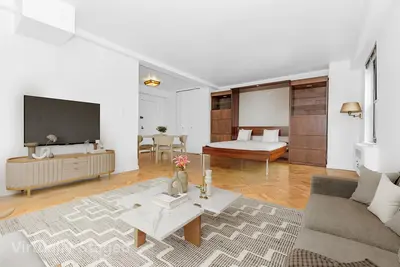
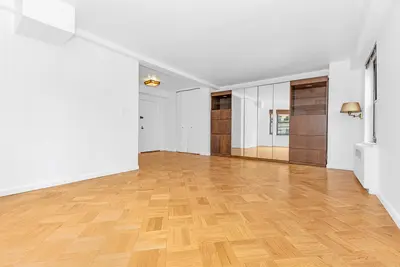
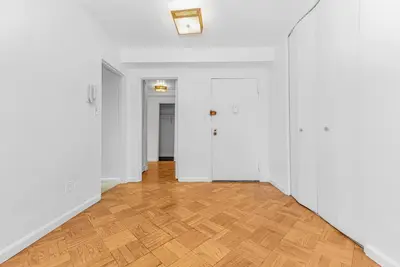
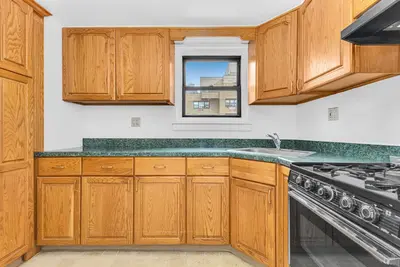
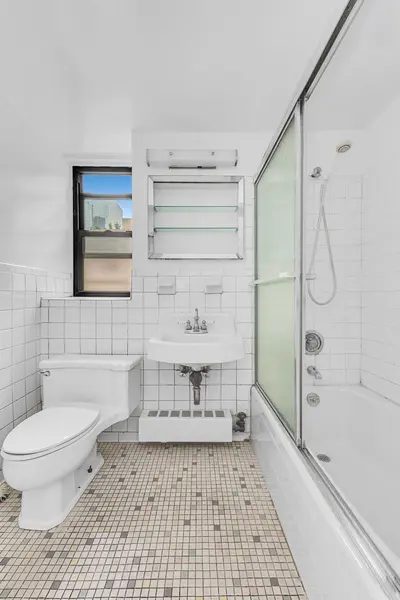
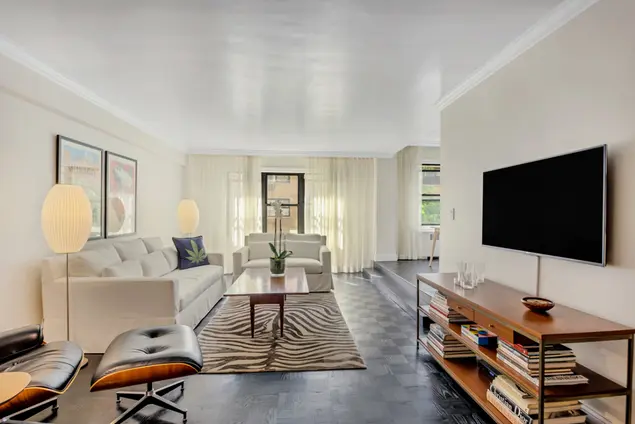
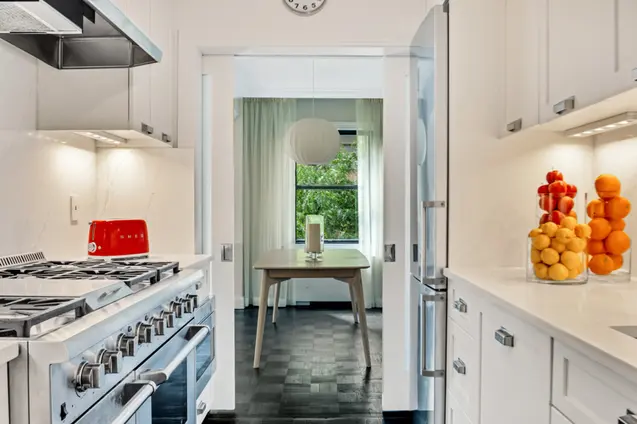
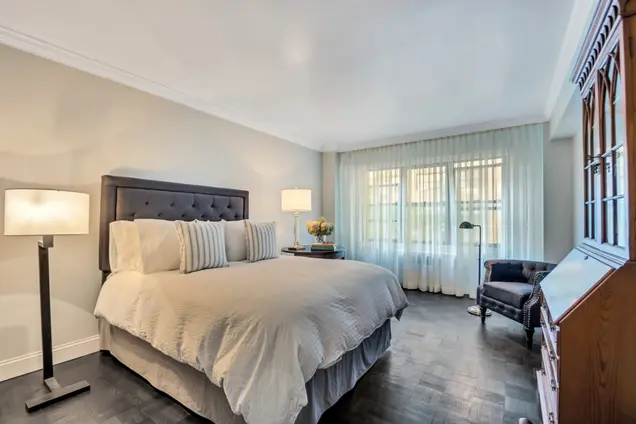
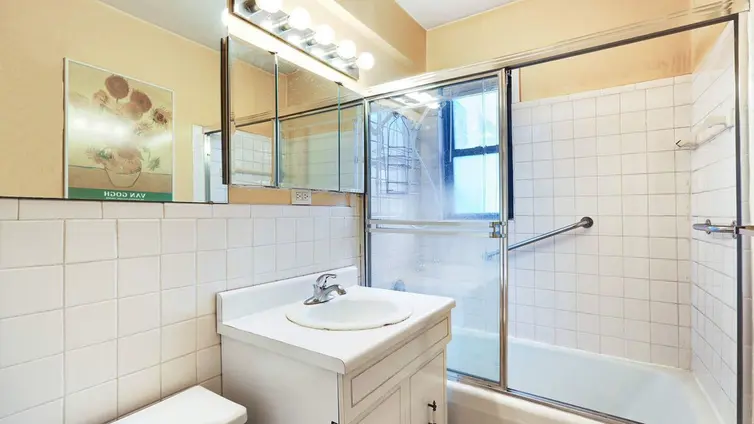
Apartments in Marlo Towers are known for their generous proportions, with many featuring sunken living rooms, ample storage space, and some offering private terraces. The building's layouts range from one-bedroom units to larger convertible spaces, many enjoying good natural light and city views.
The location offers exceptional convenience, situated near the United Nations, Beekman Place, and Grand Central Terminal. The neighborhood provides easy access to multiple subway lines (4,5,6,E,M), the weekly Dag Hammarskjold Plaza farmer's market, and various grocery options including Whole Foods and Trader Joe's.
Marlo Towers maintains flexible ownership policies, welcoming pied-a-terres, co-purchasing arrangements, and parents buying for children. The pet-friendly building allows subletting with board approval, and accepts guarantors, making it an accommodating choice for various living situations.

View school info, local attractions, transportation options & more.
Experience amazing 3D aerial maps and fly throughs.
For some co-ops, instead of price per square foot, we use an estimate of the number of rooms for each sold apartment to chart price changes over time. This is because many co-op listings do not include square footage information, and this makes it challenging to calculate accurate square-foot averages.
By displaying the price per estimated room count, we are able to provide a more reliable and consistent metric for comparing sales in the building. While we hope that this gives you a clearer sense of price trends in the building, all data should be independently verified. All data provided are only estimates and should not be used to make any purchase or sale decision.