Shh... Many units sell without being publicly listed.
Interested in off-market listings at 156 East 79th Street? Some previously listed residences might be available – contact us for insider details on potential opportunities!
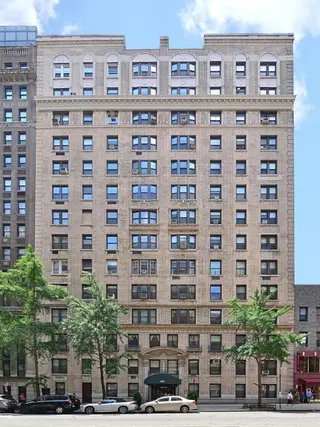
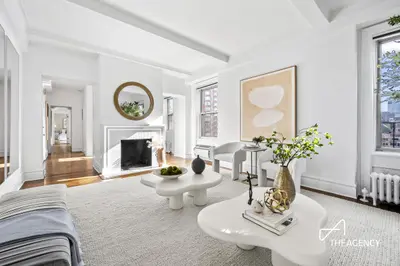

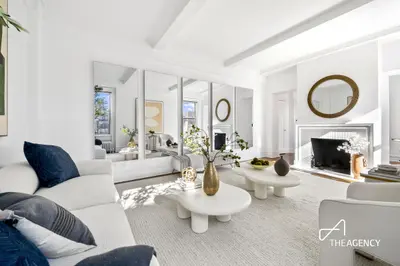
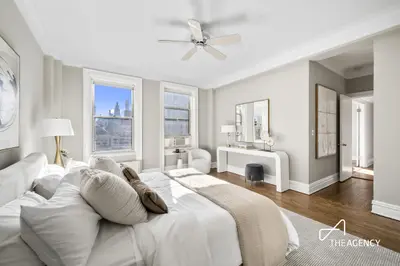
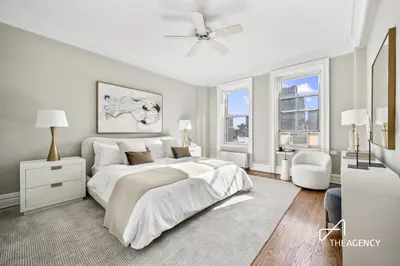
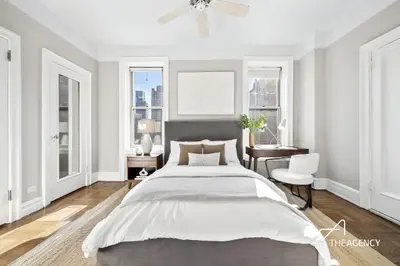
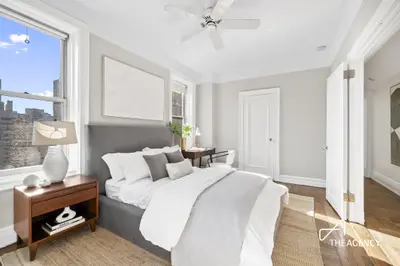
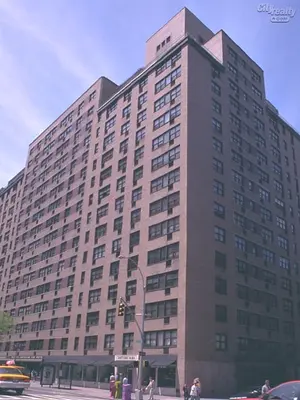
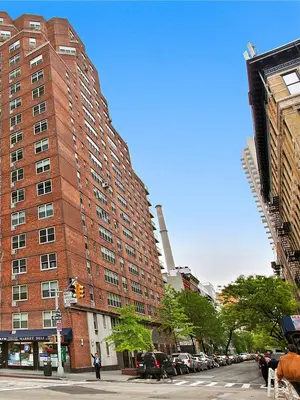
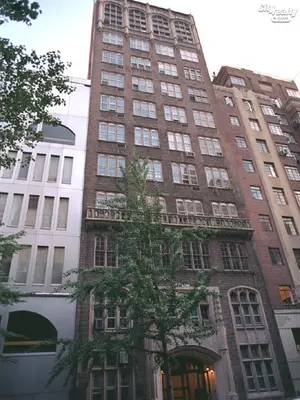
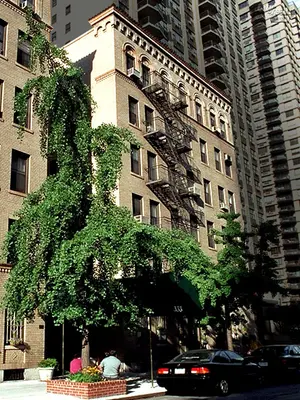
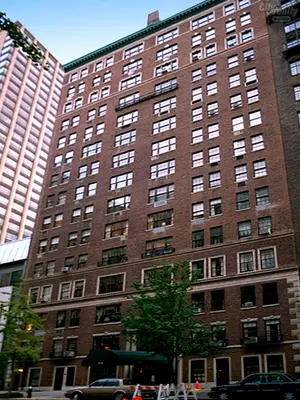
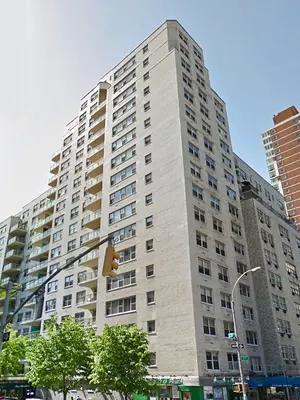
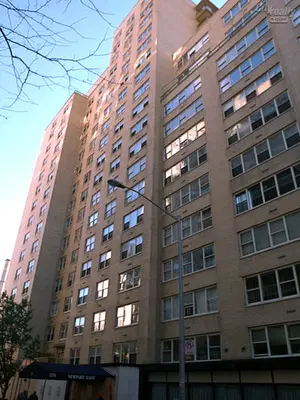
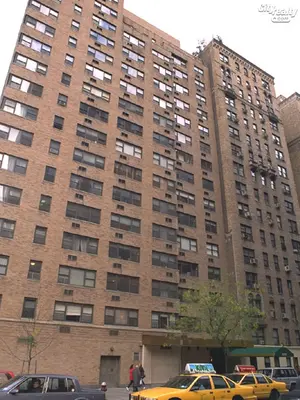
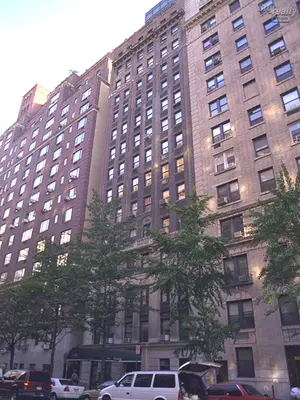
156 East 79th Street is a prewar building in the heart of the Upper East Side, completed in 1915 and converted to a full-service cooperative in 1967. The attentive staff includes 24-hour doormen, service elevator operators, and a live-in resident manager. Amenities include a bike room, central laundry room, and large storage cages. The building has just replaced the elevators, and the lobby was recently renovated with fresh paint, new floors, new furniture, new lighting, and new art. Pets and pied-a-terres are welcome.
Interested in off-market listings at 156 East 79th Street? Some previously listed residences might be available – contact us for insider details on potential opportunities!

View school info, local attractions, transportation options & more.
Experience amazing 3D aerial maps and fly throughs.
For some co-ops, instead of price per square foot, we use an estimate of the number of rooms for each sold apartment to chart price changes over time. This is because many co-op listings do not include square footage information, and this makes it challenging to calculate accurate square-foot averages.
By displaying the price per estimated room count, we are able to provide a more reliable and consistent metric for comparing sales in the building. While we hope that this gives you a clearer sense of price trends in the building, all data should be independently verified. All data provided are only estimates and should not be used to make any purchase or sale decision.
|
Year
Avg Price / Room (Est)
Avg. Actual Price
Med. Actual Price
Transactions
2025
-
-
0
2024
$264,193
$1,968,333
3
2023
$242,949
$1,512,500
2
2022
$328,036
$2,296,250
2
2021
$270,625
$1,262,500
2
2020
$360,714
$2,525,000
1
2019
$326,786
$2,287,500
2
2018
$228,333
$685,000
1
2017
-
-
0
2016
$374,524
$2,208,333
3
2015
$276,788
$1,611,000
2
2014
$325,104
$2,155,000
2
|
Year
Avg Price / Room (Est)
Avg. Actual Price
Med. Actual Price
Transactions
2013
$318,571
$1,490,000
2
2012
-
-
0
2011
$314,286
$2,200,000
1
2010
-
-
0
2009
$191,000
$955,000
1
2008
$186,000
$465,000
1
2007
$376,667
$3,055,000
2
2006
-
-
0
2005
$499,167
$2,995,000
1
2004
$142,917
$428,750
2
2003
-
-
0
|
the following is a slider of images. For screen reader users, all slides are visible at all time so you may ignore control buttons.
Sign-up and we'll email you new listings in this building!
Whether you’re a buyer, investor, or simply curious, this report is your key to unlocking in-depth insights and analysis on .
Please confirm your details: