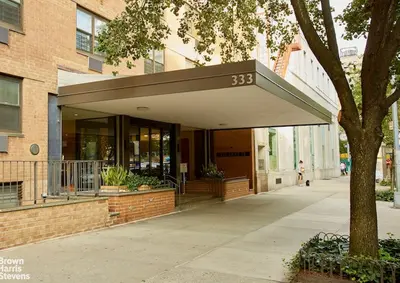
333 East 79th Street - Yorkville
- Apartments
- Overview & Photos
- Maps
- Floorplans
- Sales Data & Comps
- Similar Buildings
- All Units


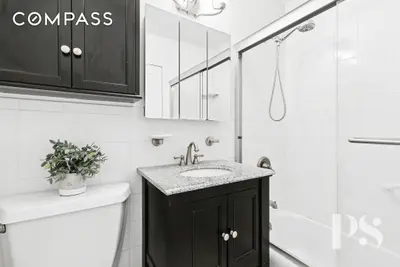
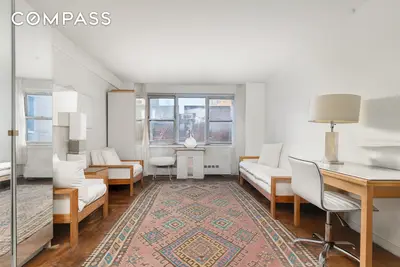

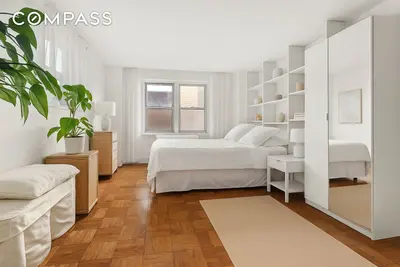
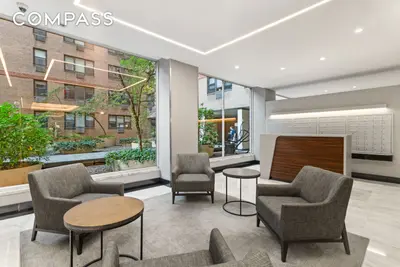
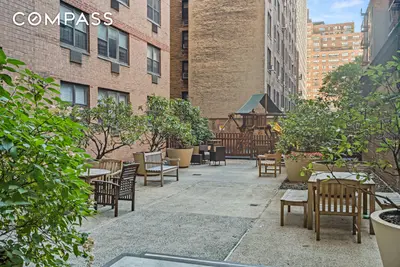
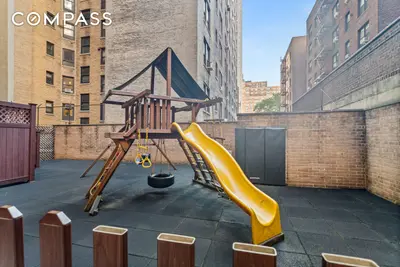
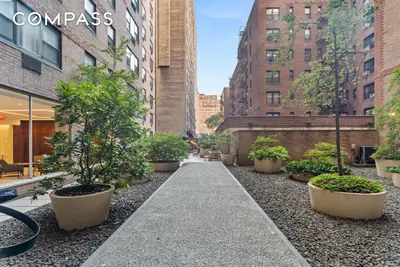
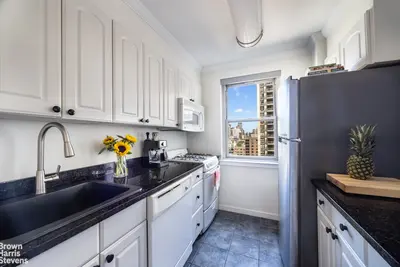

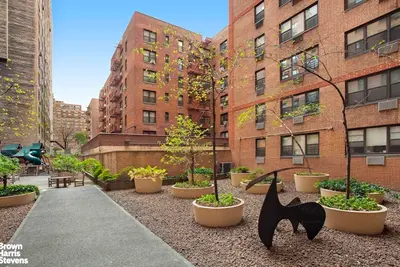

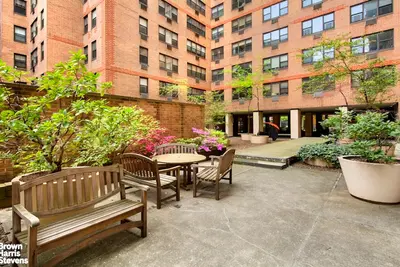
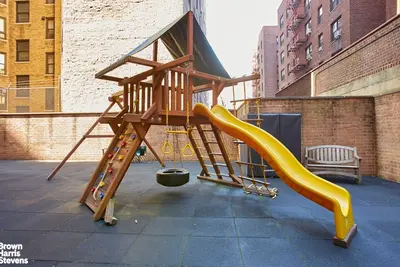

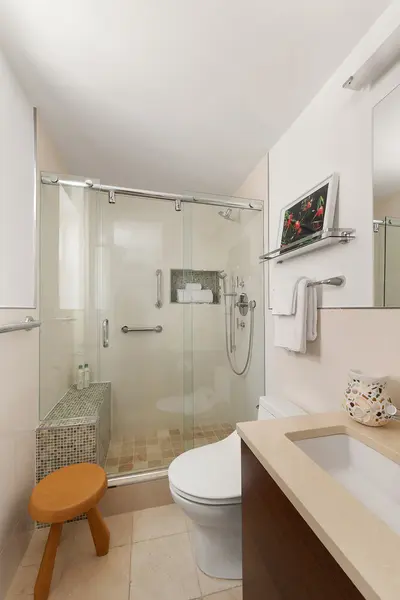
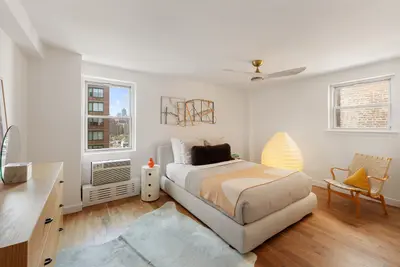

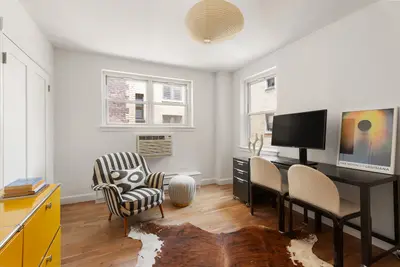
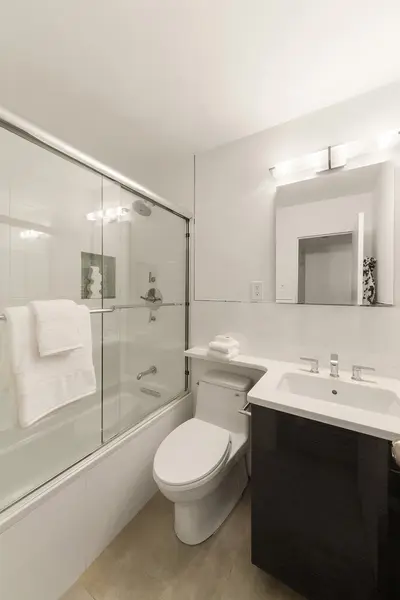

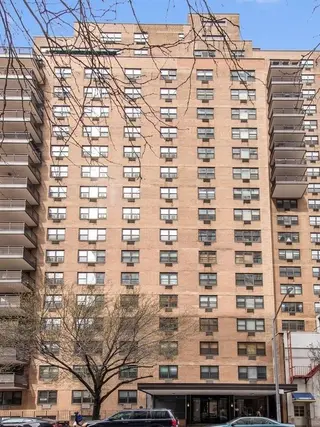
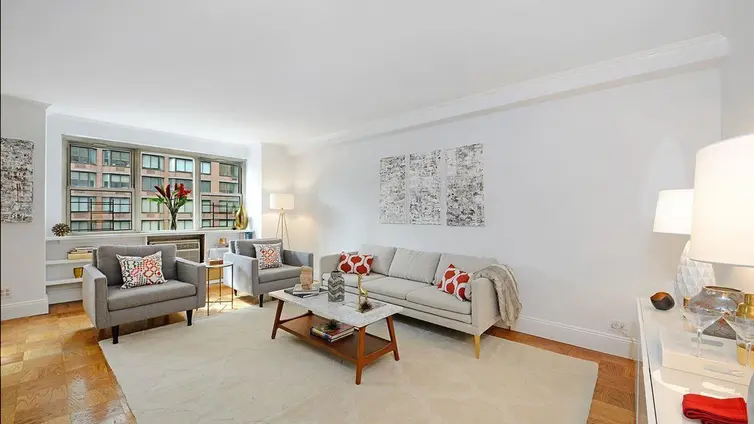
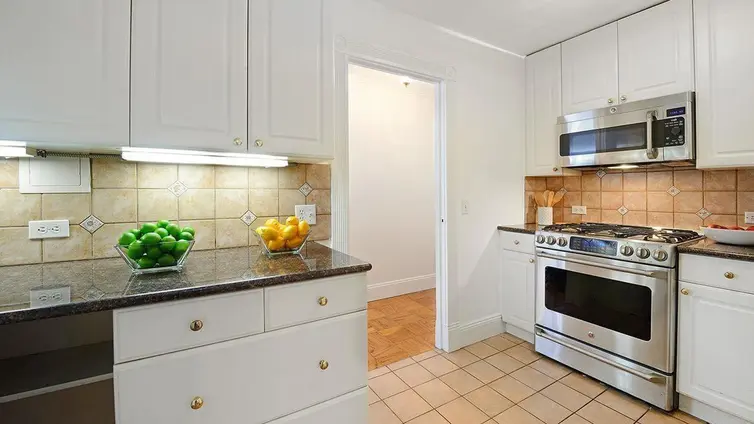
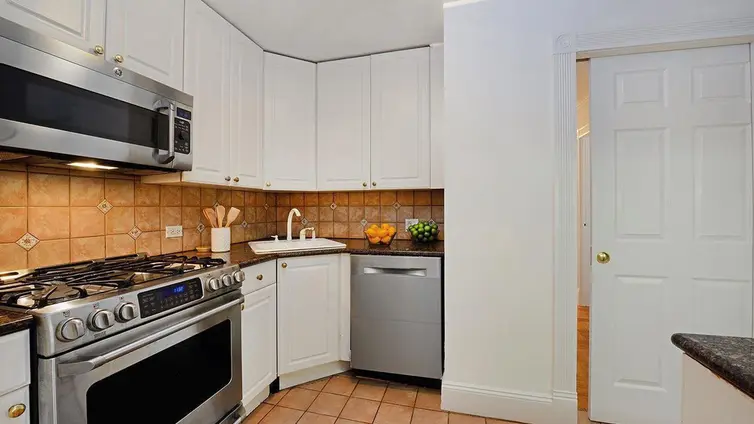
333 East 79th Street is a full-service cooperative with a full-time doorman and live-in superintendent among the attentive staff. Its luxurious suite of amenities includes a children's playroom, a conference center, a fitness center, a central laundry room, a bike room, a private garage, on-site storage space, and an outdoor courtyard.
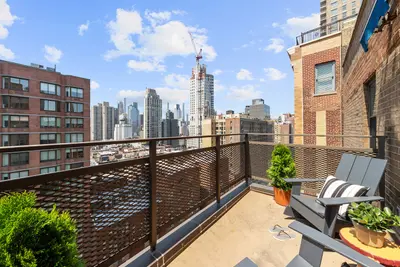
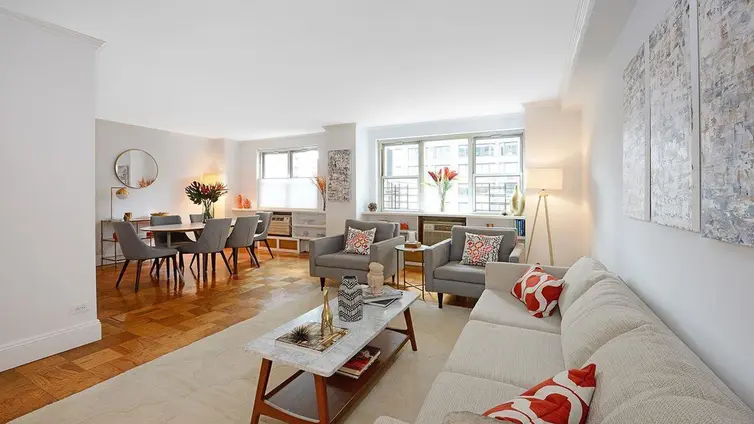
333 East 79th Street is in a prime Upper East Side location near Central Park, the East River Promenade, public transportation, and FDR Drive. Pied-a-terres are allowed on a case-by-case basis, and pets up to 50 pounds are permited with board approval. Guarantors and co-purchasers are permitted, as is 80% financing.

View school info, local attractions, transportation options & more.
Experience amazing 3D aerial maps and fly throughs.
For some co-ops, instead of price per square foot, we use an estimate of the number of rooms for each sold apartment to chart price changes over time. This is because many co-op listings do not include square footage information, and this makes it challenging to calculate accurate square-foot averages.
By displaying the price per estimated room count, we are able to provide a more reliable and consistent metric for comparing sales in the building. While we hope that this gives you a clearer sense of price trends in the building, all data should be independently verified. All data provided are only estimates and should not be used to make any purchase or sale decision.
Broker & Buyer Comments