Shh... Many units sell without being publicly listed.
Interested in off-market listings at 340 East 80th Street? Some previously listed residences might be available – contact us for insider details on potential opportunities!
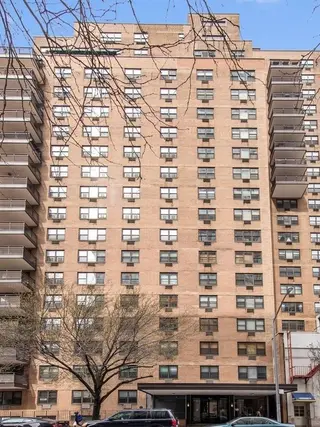
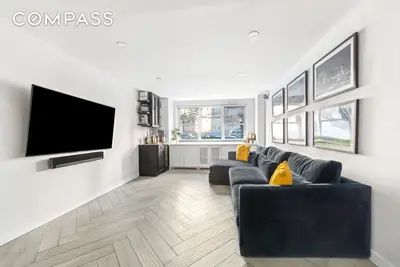
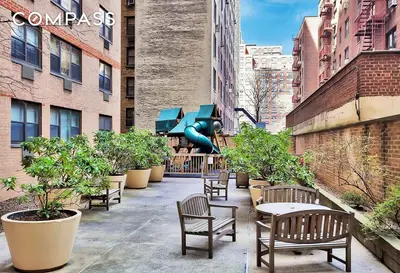
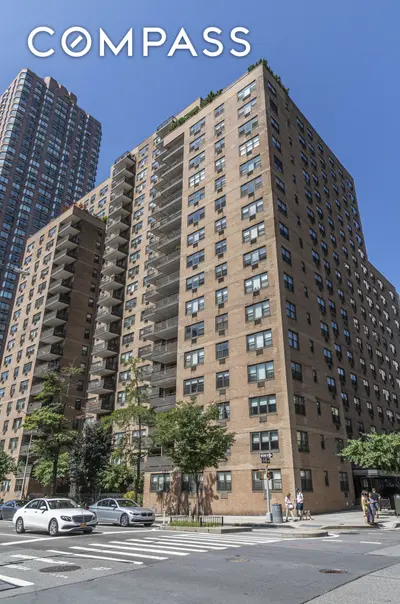
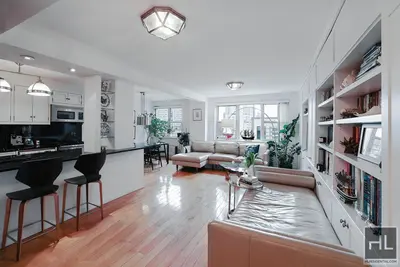
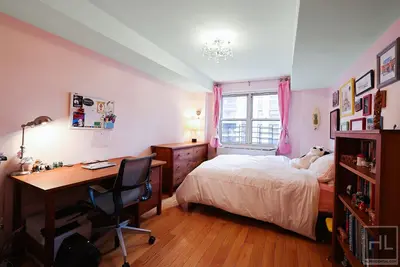
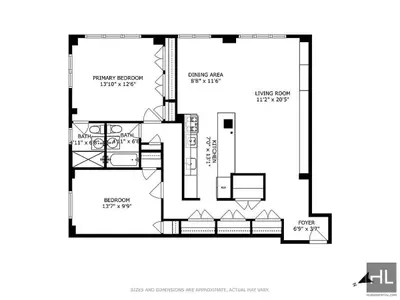
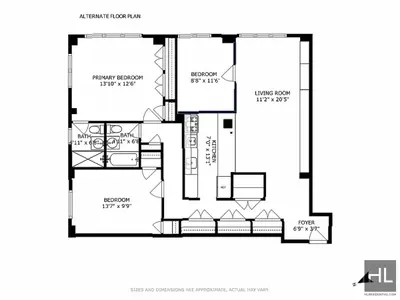
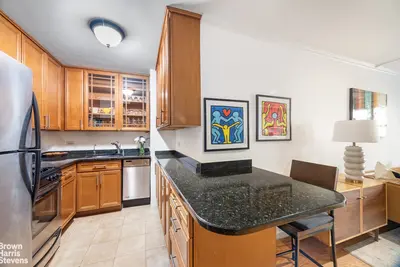
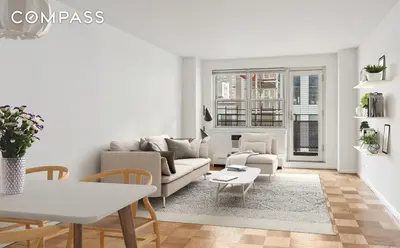
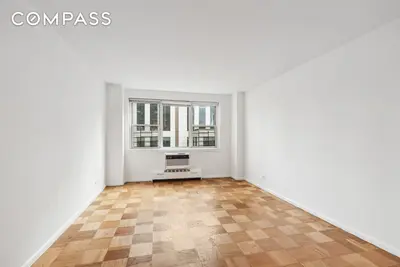
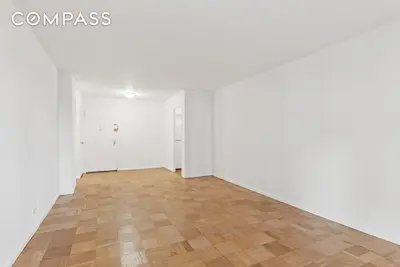
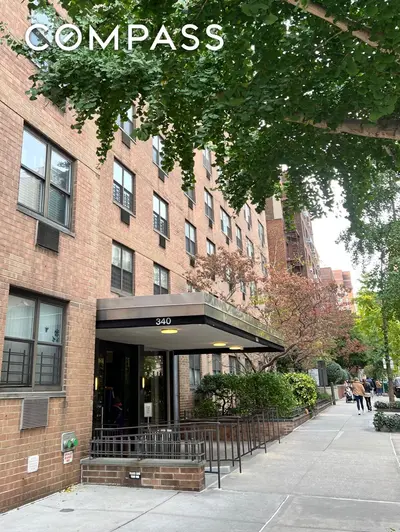

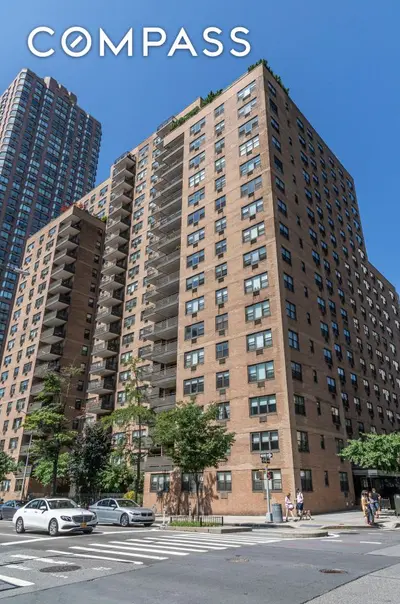
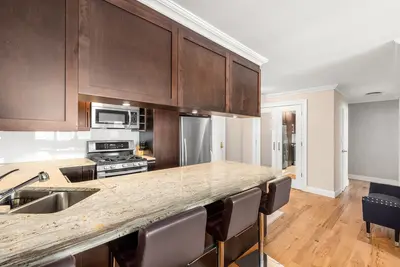
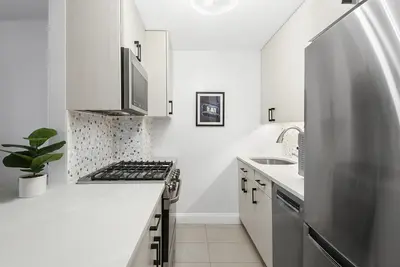
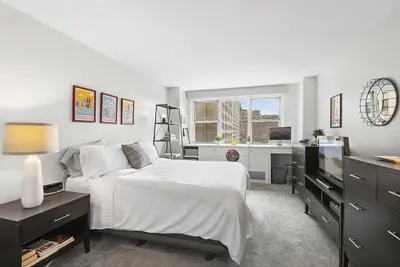
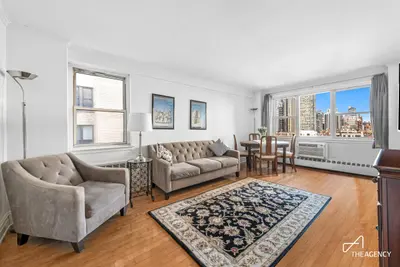
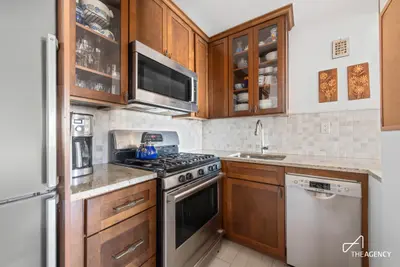
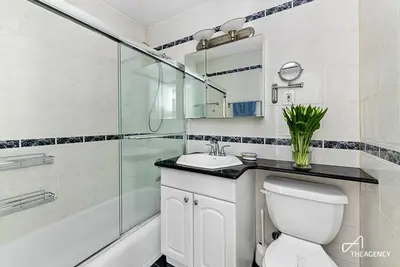
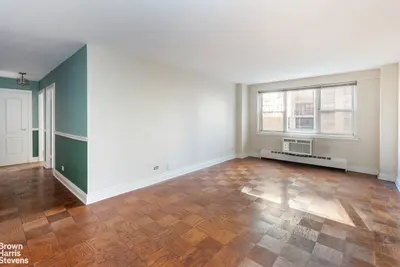
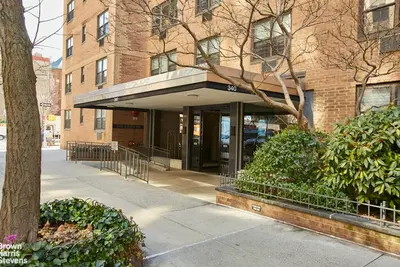
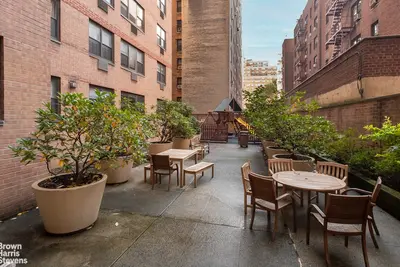
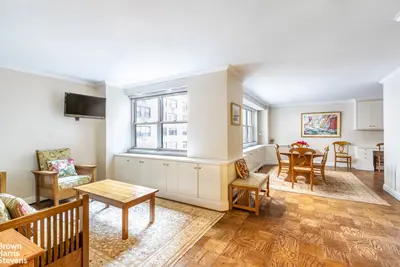
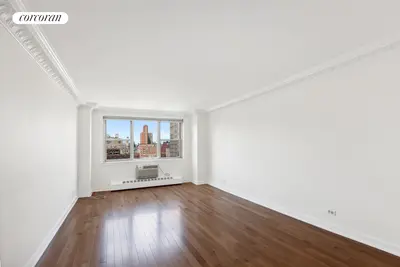
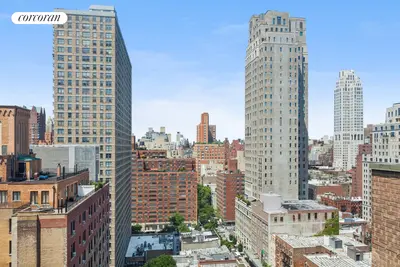
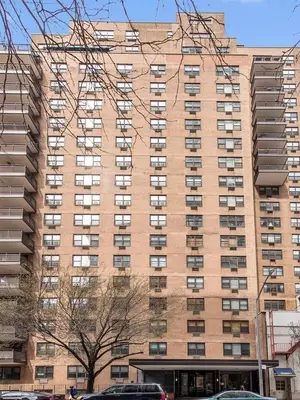
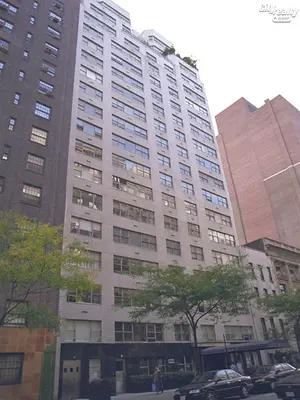
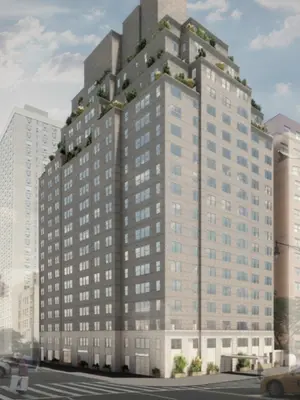
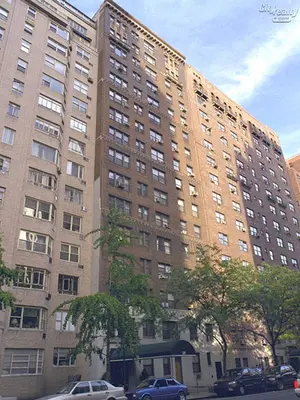
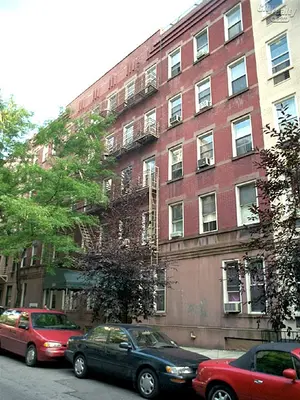
340 East 80th Street is a red-brick cooperative standing 20 stories high and completed in 1961. It is connected to 333 East 79th Street by a gorgeous landscaped courtyard with modern sculptures, generous seating areas, and a children's playground.
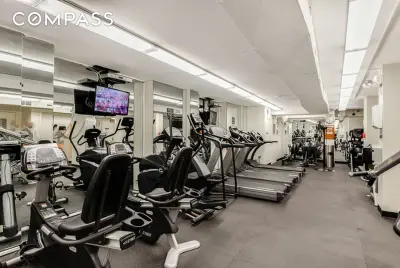
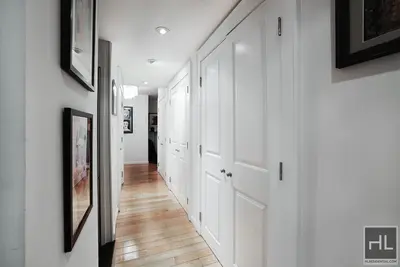
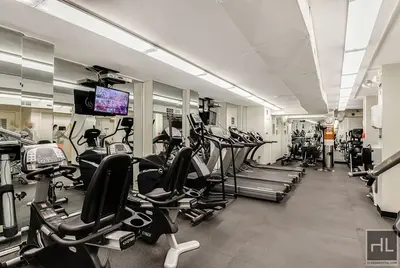
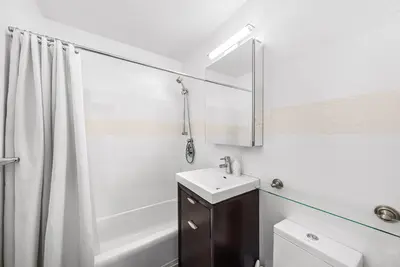
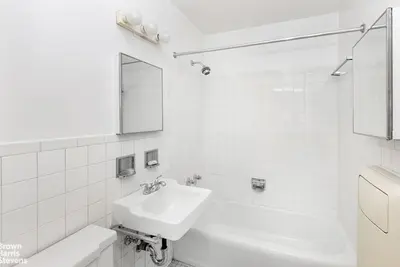
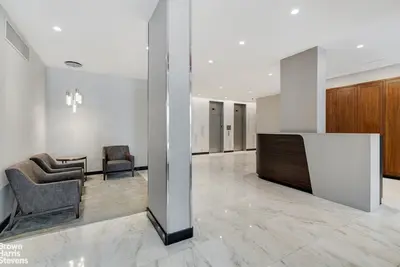
The lobby and hallways have recently been renovated, and amenities and staff include 24-hour doorman, live-in superintendent, indoor fitness center, and party room. There is also a central laundry room, but washer/dryers are permitted with board approval. Between the building's garage and close proximity to subways and bus stops, there is no shortage of ways to get around.
The building allows 80 percent financing, and there is no flip tax. Co-purchasing, pied-a-terres, and pets up to 50 pounds are allowed.
Interested in off-market listings at 340 East 80th Street? Some previously listed residences might be available – contact us for insider details on potential opportunities!

View school info, local attractions, transportation options & more.
Experience amazing 3D aerial maps and fly throughs.
For some co-ops, instead of price per square foot, we use an estimate of the number of rooms for each sold apartment to chart price changes over time. This is because many co-op listings do not include square footage information, and this makes it challenging to calculate accurate square-foot averages.
By displaying the price per estimated room count, we are able to provide a more reliable and consistent metric for comparing sales in the building. While we hope that this gives you a clearer sense of price trends in the building, all data should be independently verified. All data provided are only estimates and should not be used to make any purchase or sale decision.
|
Year
Avg Price / Room (Est)
Avg. Actual Price
Med. Actual Price
Transactions
2025
$203,067
$729,333
3
2024
$211,286
$804,286
7
2023
$215,500
$837,500
8
2022
$280,411
$1,320,364
11
2021
$248,958
$987,000
12
2020
$228,148
$873,571
7
2019
$226,452
$907,813
8
2018
$252,352
$1,111,000
10
2017
$216,437
$757,520
15
2016
$238,410
$911,857
7
2015
$209,917
$736,750
4
2014
$209,213
$984,563
12
|
Year
Avg Price / Room (Est)
Avg. Actual Price
Med. Actual Price
Transactions
2013
$172,900
$591,375
4
2012
$179,729
$710,688
4
2011
$206,946
$961,667
9
2010
$146,241
$451,208
12
2009
$201,095
$710,000
8
2008
$200,962
$697,429
7
2007
$180,163
$664,972
18
2006
$176,189
$814,917
6
2005
$150,144
$474,667
12
2004
$138,900
$641,813
16
2003
$119,958
$359,875
4
|
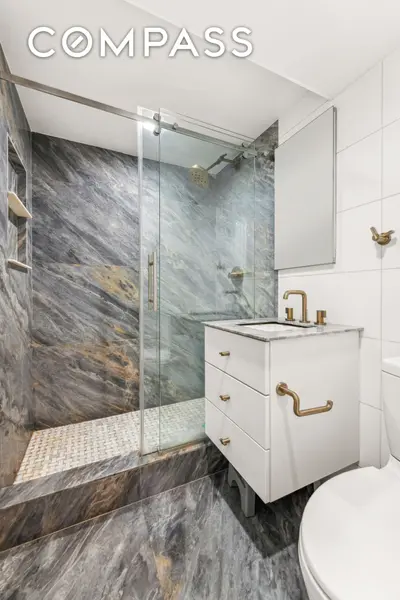
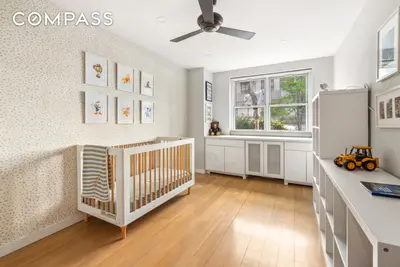
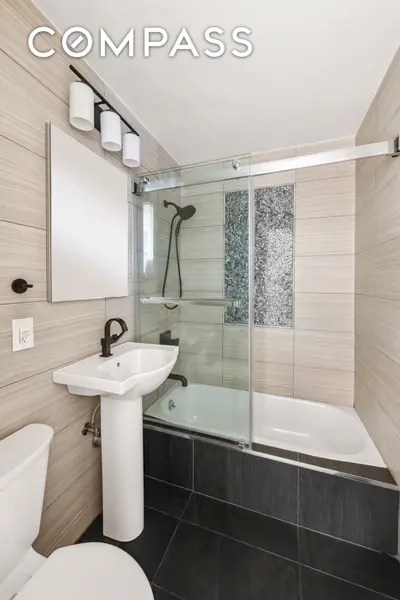
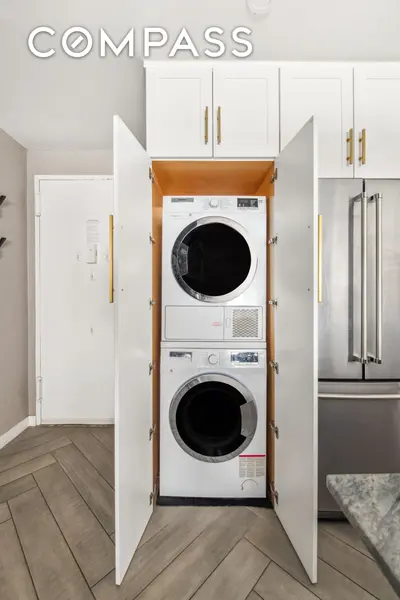
the following is a slider of images. For screen reader users, all slides are visible at all time so you may ignore control buttons.
Sign-up and we'll email you new listings in this building!
Whether you’re a buyer, investor, or simply curious, this report is your key to unlocking in-depth insights and analysis on .
Please confirm your details:


Broker & Buyer Comments