Shh... Many units sell without being publicly listed.
Looking for something special? Select off-market options at 24 Fifth Avenue may be available – connect with us for access.
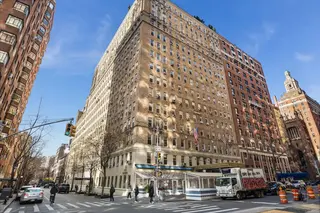
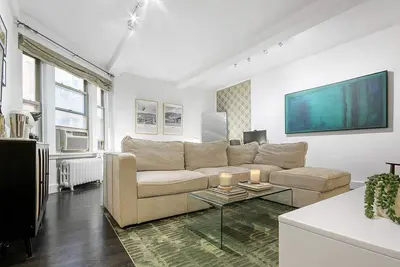
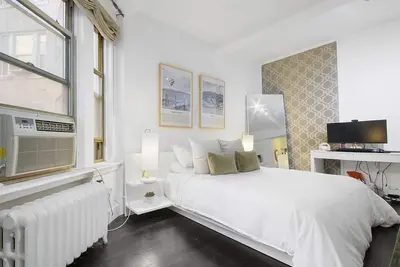

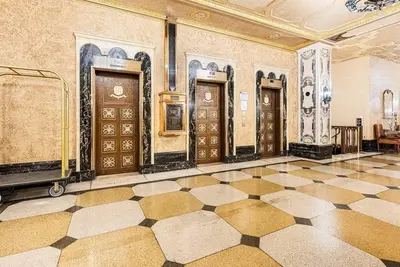
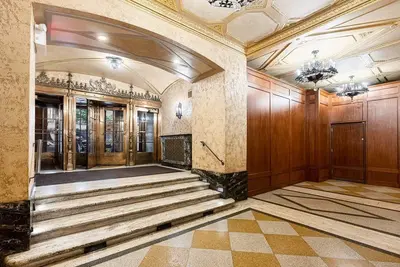
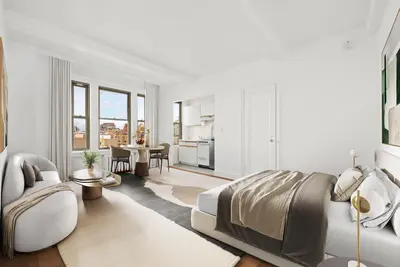

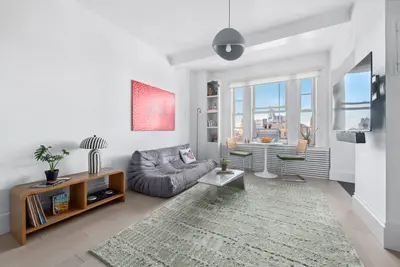


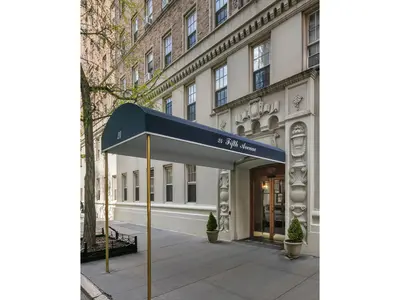
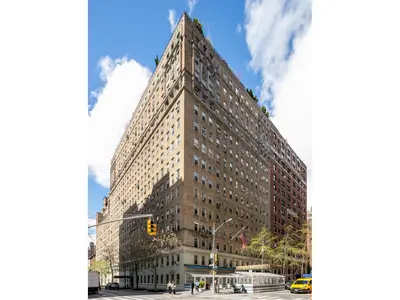

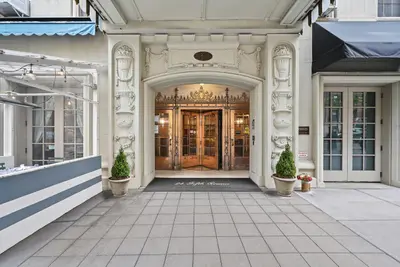
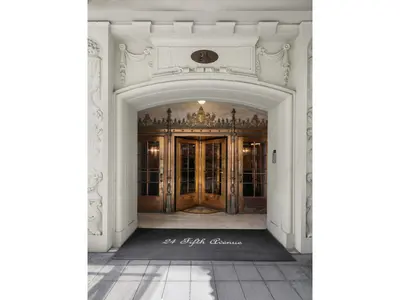
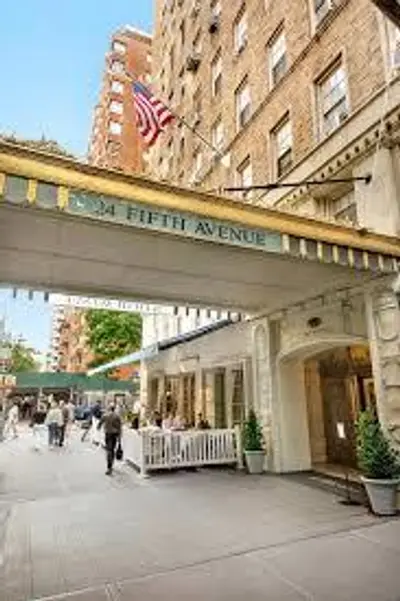
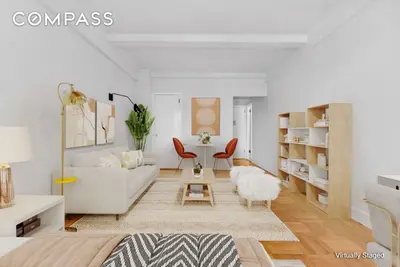
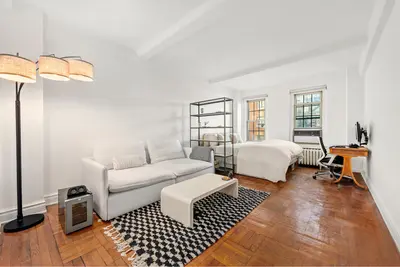
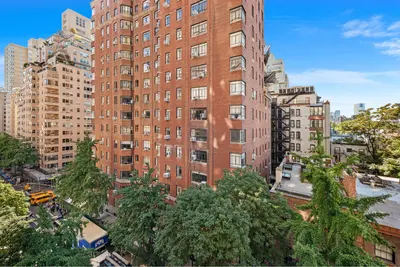
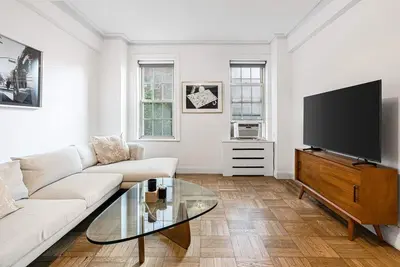
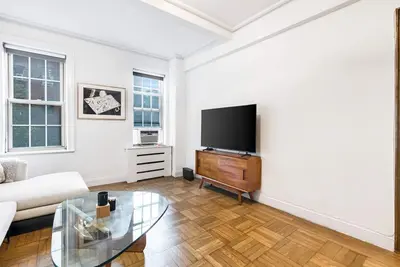
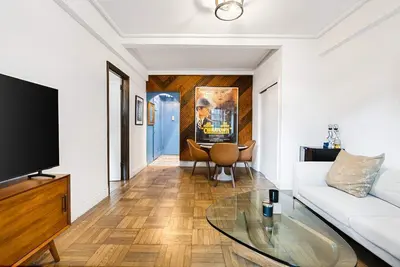
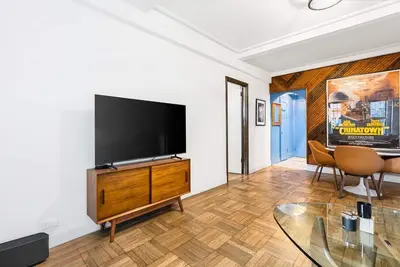
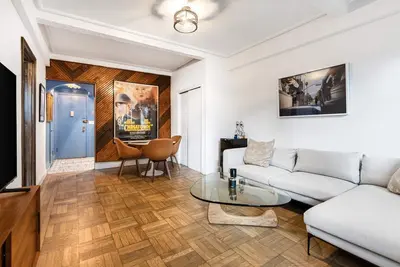
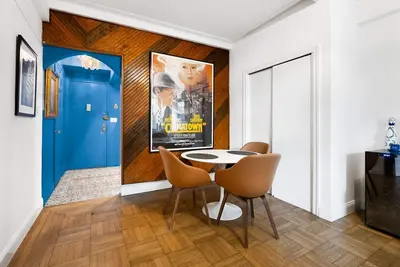
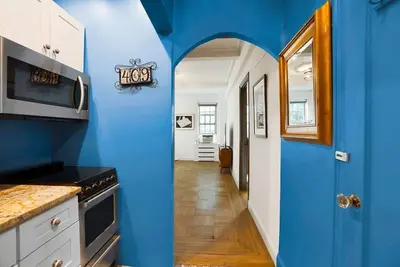
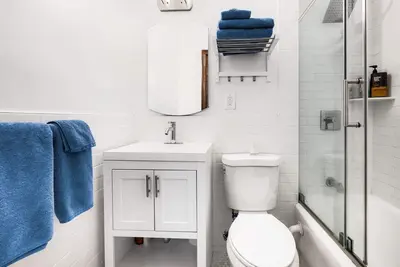


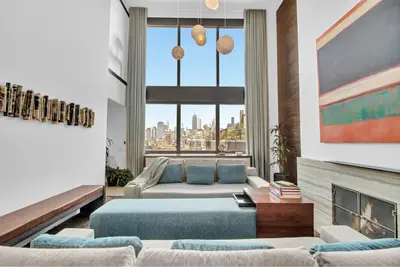
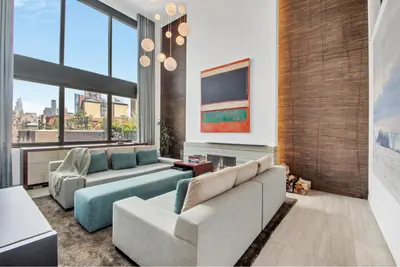
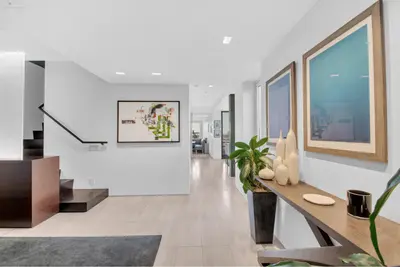
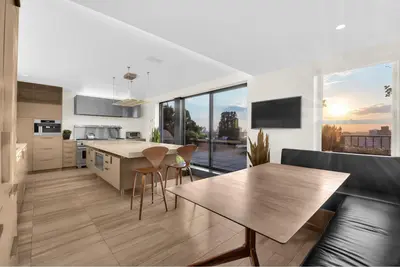
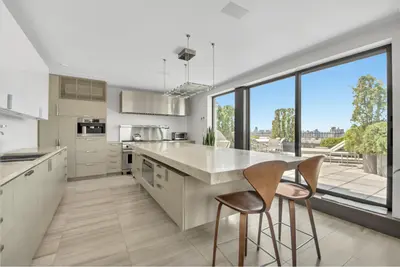
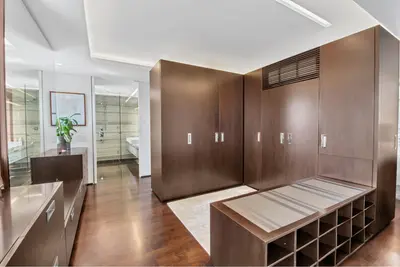
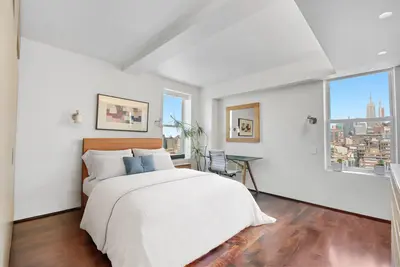


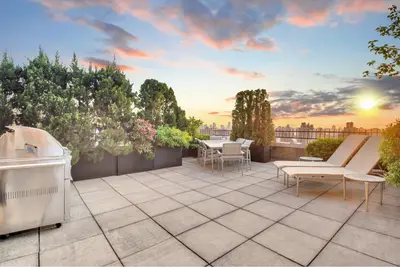

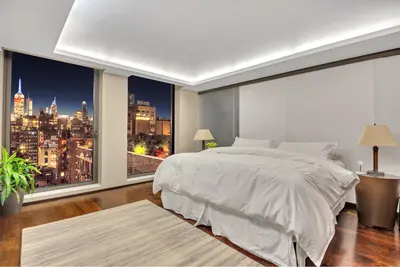
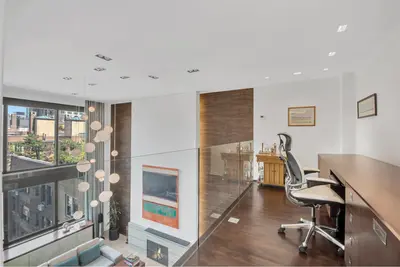
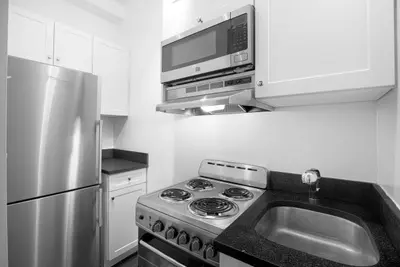
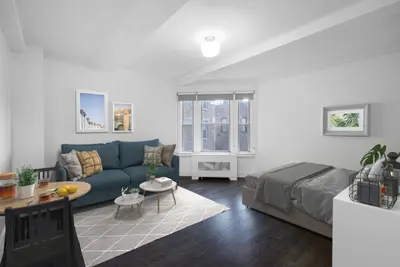
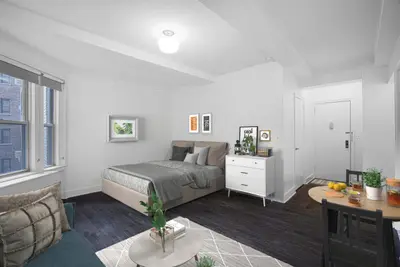
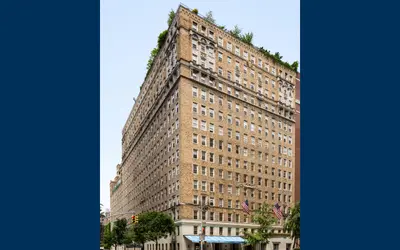
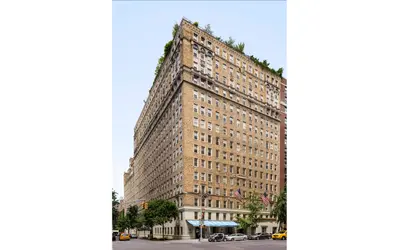

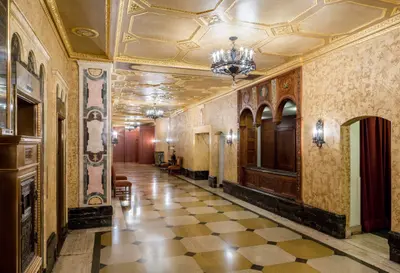


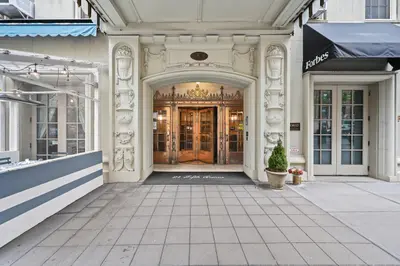

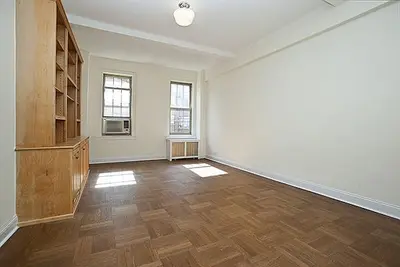

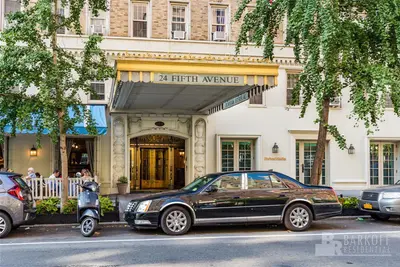
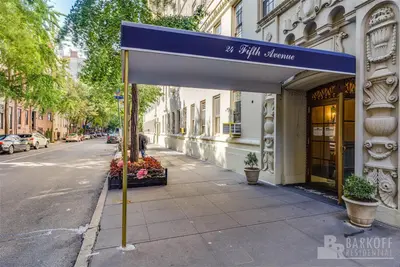
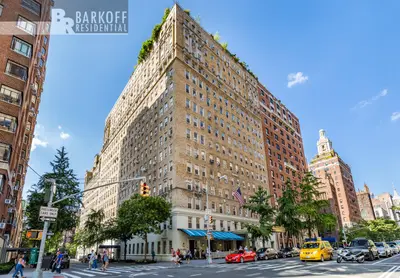


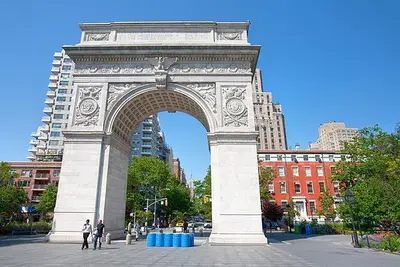
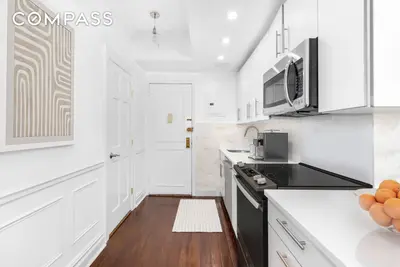
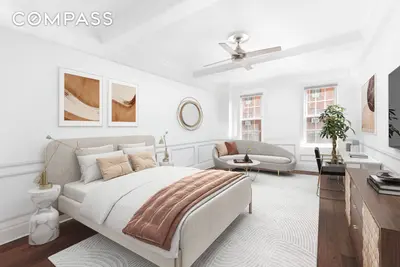
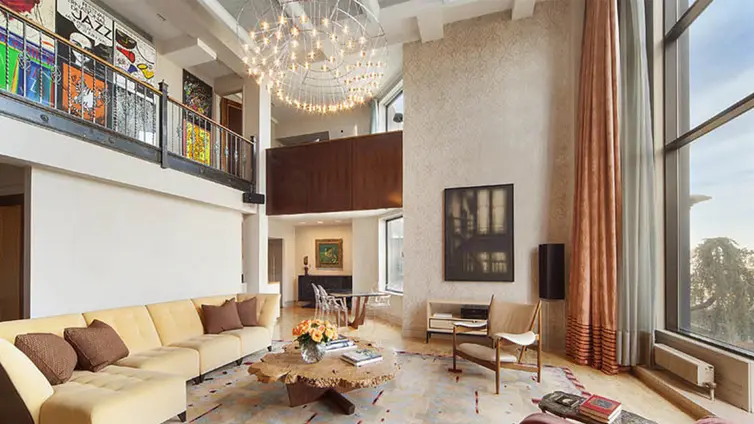
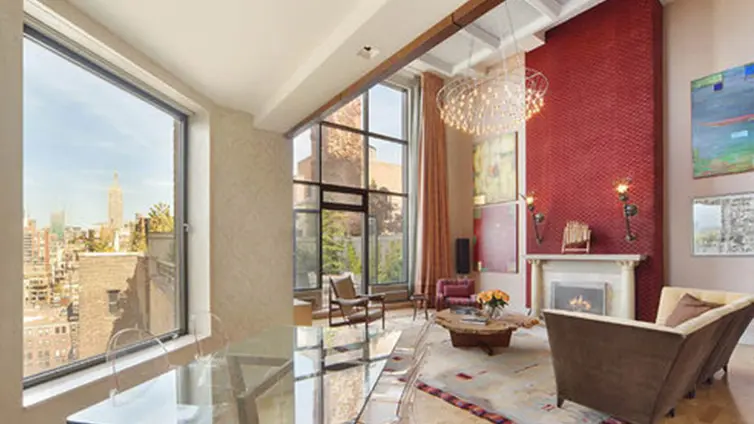
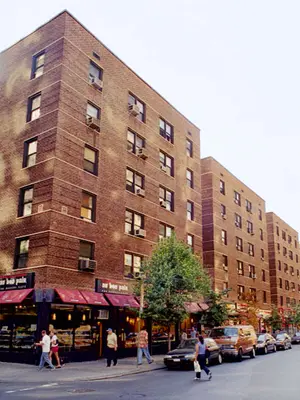
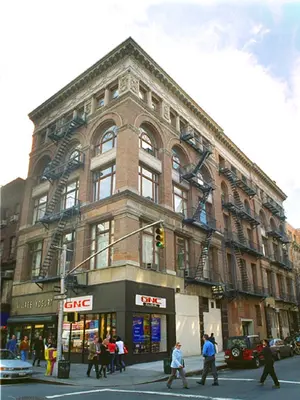
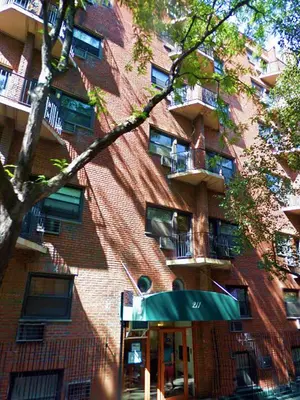
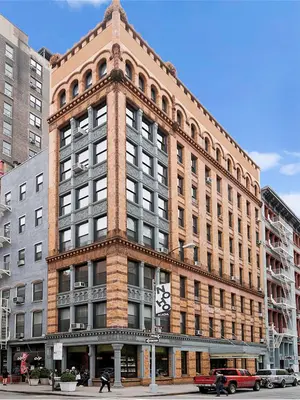
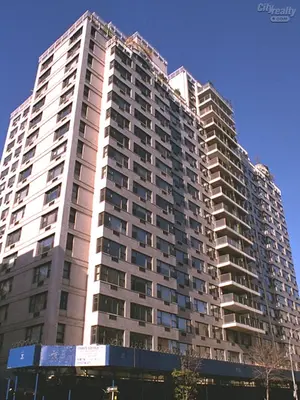
24 Fifth Avenue was designed by Emery Roth and completed in 1926. It initially opened as the Fifth Avenue Hotel on the site of the Brevoort Mansion, but has been coverted to a 15-story, 419-unit cooperative. In any era or incarnation, it is distinguished by its striking bronze canopy along Fifth Avenue.
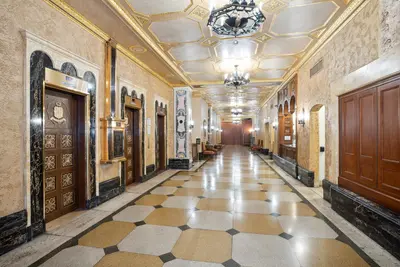
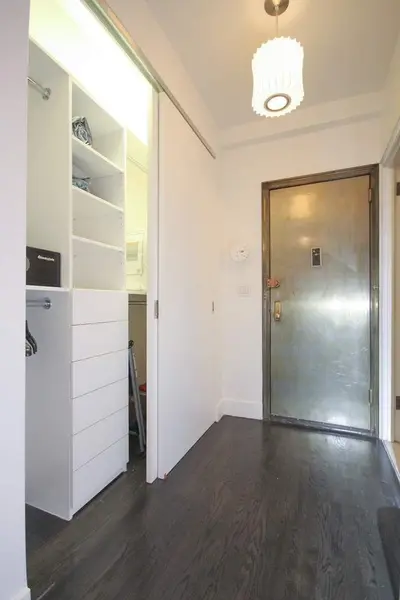
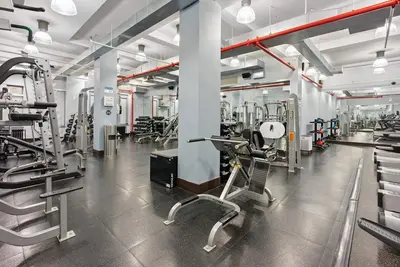
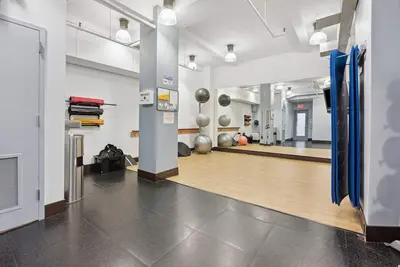
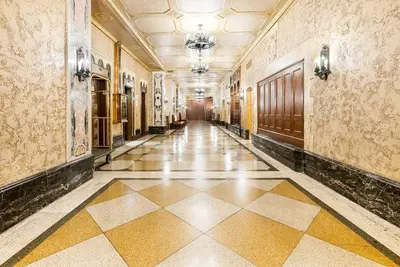
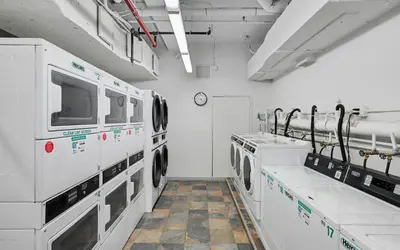
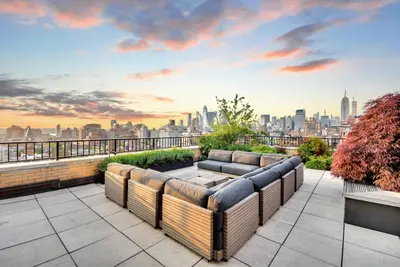
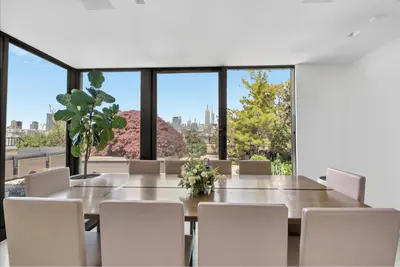
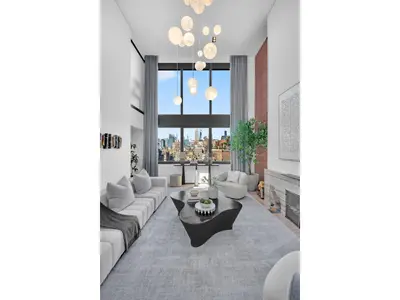
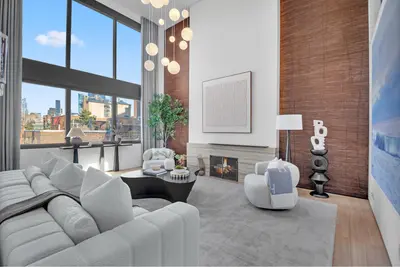
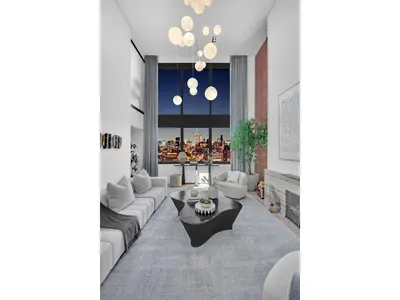
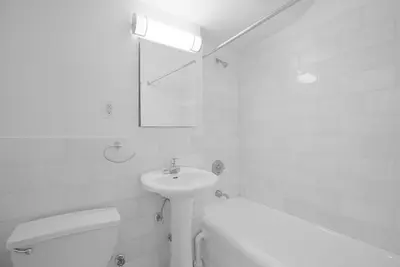
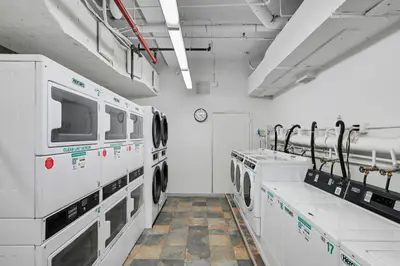
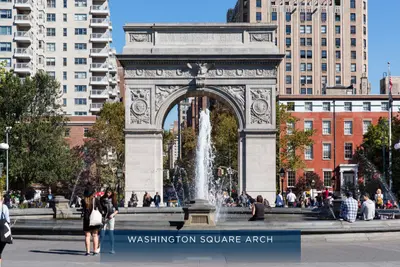
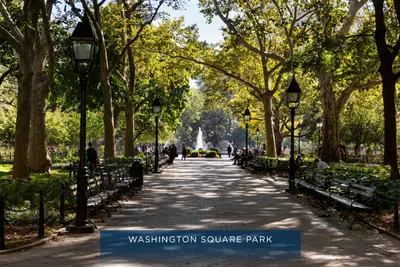
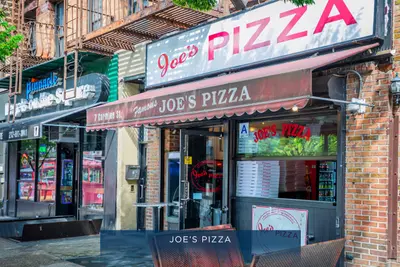
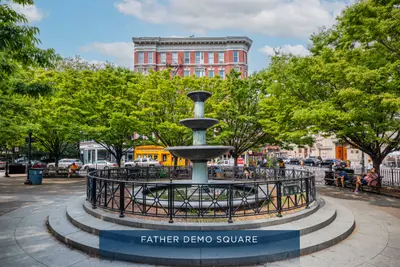
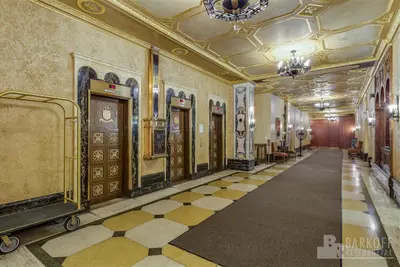
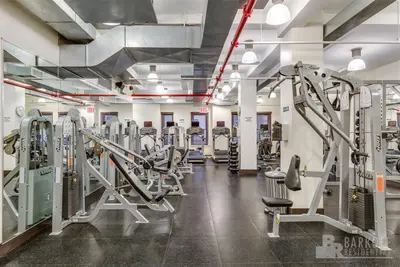
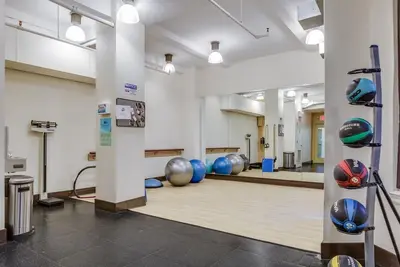
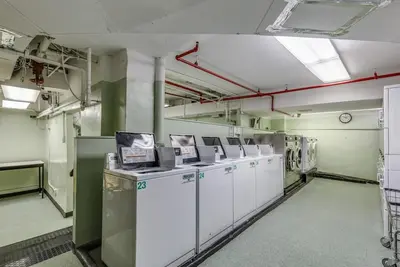
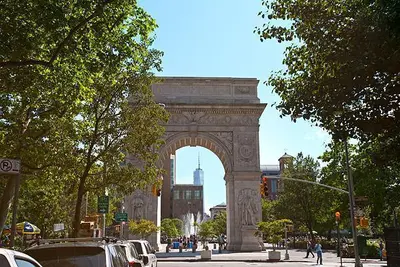
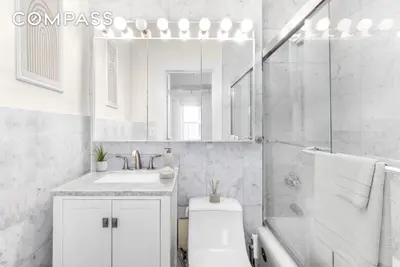
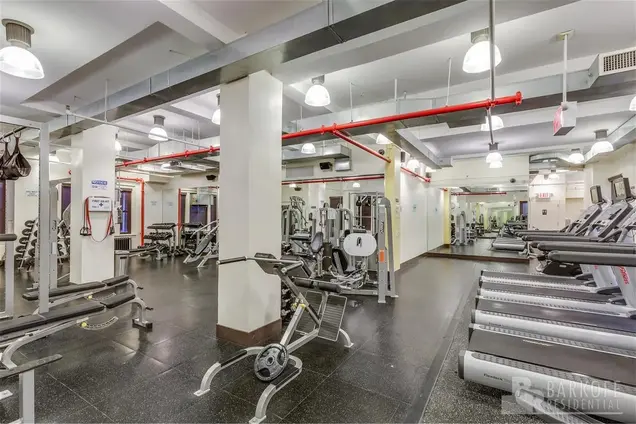
Residents of this doorman building enjoy a grand lobby, a state-of-the-art fitness center, on-site laundry room, storage, and the services of a live-in superintendent, porters, and concierge. It is conveniently located near Washington Square Park, top shopping and restaurants, and several transportation options.
The building allows pets, pied-a-terres, gifting, and parents buying with children. After three years as the primary residence, owners may rent out the apartments for three out of five years.


Looking for something special? Select off-market options at 24 Fifth Avenue may be available – connect with us for access.

View school info, local attractions, transportation options & more.
Experience amazing 3D aerial maps and fly throughs.
For some co-ops, instead of price per square foot, we use an estimate of the number of rooms for each sold apartment to chart price changes over time. This is because many co-op listings do not include square footage information, and this makes it challenging to calculate accurate square-foot averages.
By displaying the price per estimated room count, we are able to provide a more reliable and consistent metric for comparing sales in the building. While we hope that this gives you a clearer sense of price trends in the building, all data should be independently verified. All data provided are only estimates and should not be used to make any purchase or sale decision.
|
Year
Avg Price / Ft2 (Est)
Median Price / Ft2 (Est)
Avg. Actual Price
Med. Actual Price
Transactions
2025
-
$1,875,000
-
$1,875,000
2
2024
$1,191
$536,520
$1,203
$470,000
15
2023
$1,080
$886,907
$1,080
$513,420
17
2022
$1,184
$704,383
$1,183
$452,500
17
2021
$1,068
$604,462
$1,027
$470,000
19
2020
$1,066
$384,260
$938
$380,000
6
2019
$1,052
$502,640
$1,054
$425,000
9
2018
$1,106
$568,653
$1,076
$427,500
14
2017
$1,124
$558,929
$1,156
$520,000
7
2016
$1,053
$525,368
$1,053
$415,000
21
2015
$915
$627,291
$942
$423,084
25
2014
$1,031
$783,863
$1,036
$406,250
24
|
Year
Avg Price / Ft2 (Est)
Median Price / Ft2 (Est)
Avg. Actual Price
Med. Actual Price
Transactions
2013
$1,063
$719,810
$1,048
$680,000
12
2012
$944
$440,652
$938
$387,563
7
2011
$948
$523,646
$928
$415,000
9
2010
$1,077
$1,018,158
$884
$464,000
12
2009
$958
$477,222
$953
$460,000
6
2008
$1,033
$501,570
$1,007
$425,640
4
2007
$1,141
$652,000
$1,141
$670,000
6
2006
$959
$671,753
$908
$425,352
13
2005
$1,013
$664,500
$1,049
$345,000
14
2004
$731
$338,818
$707
$245,000
11
2003
$574
$330,083
$593
$385,000
12
Please note that price/ft2 calculations is from only 56% of total transactions during the period
|
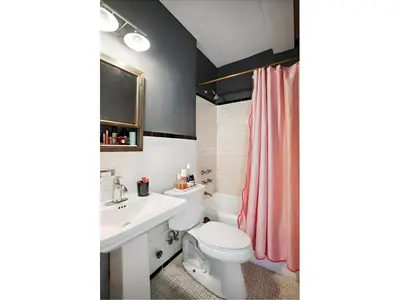
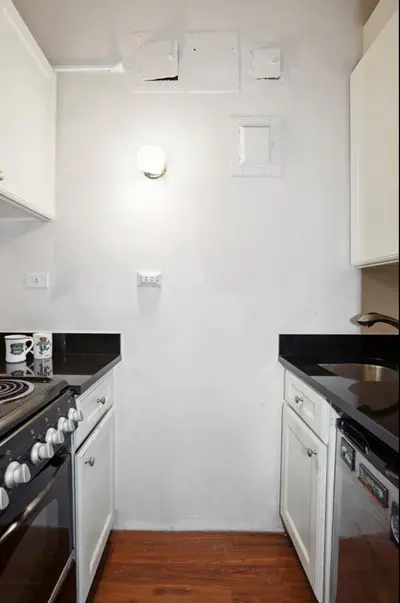
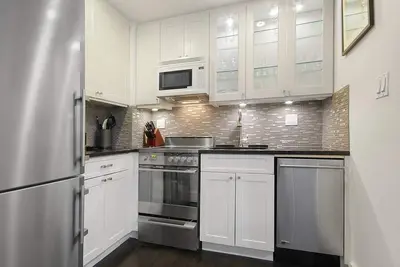
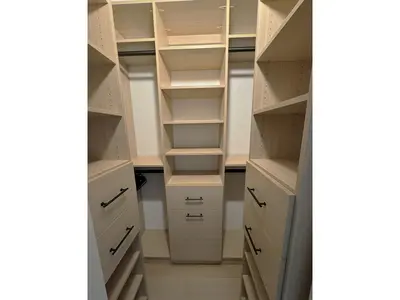
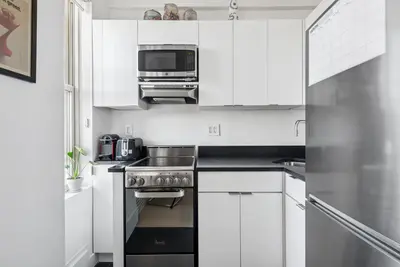
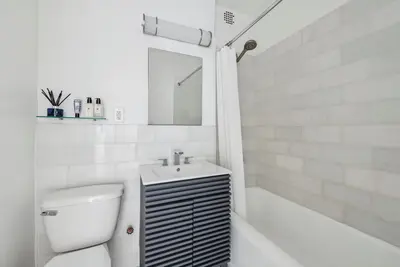
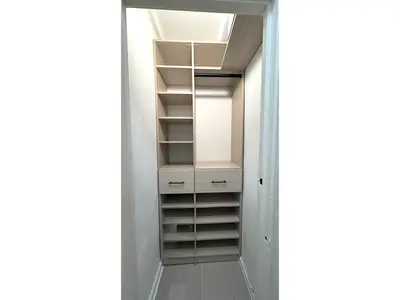
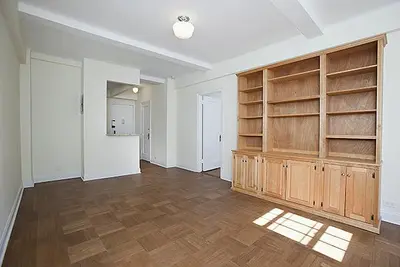
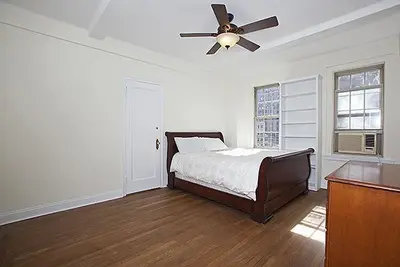
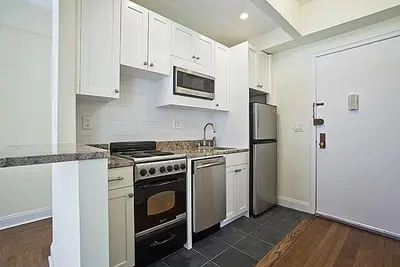
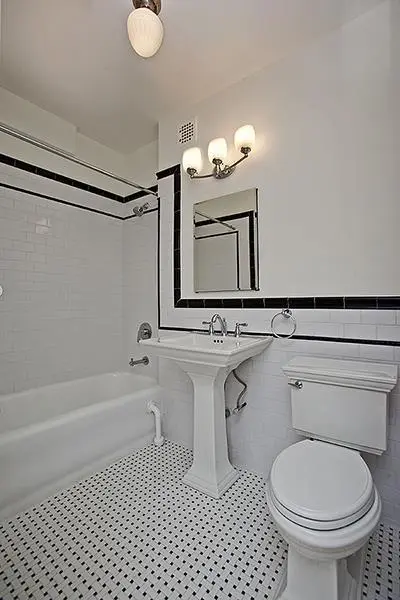
the following is a slider of images. For screen reader users, all slides are visible at all time so you may ignore control buttons.
Sign-up and we'll email you new listings in this building!
Whether you’re a buyer, investor, or simply curious, this report is your key to unlocking in-depth insights and analysis on .
Please confirm your details:


Broker & Buyer Comments