Shh... Many units sell without being publicly listed.
Discover hidden opportunities at 165 East 72nd Street! Reach out today to learn about select off-market listings.
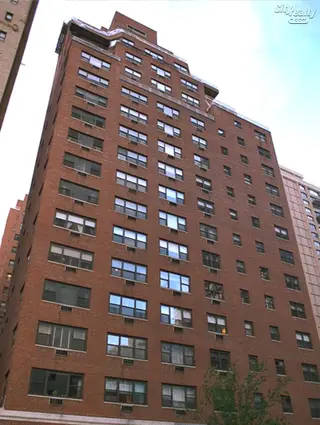
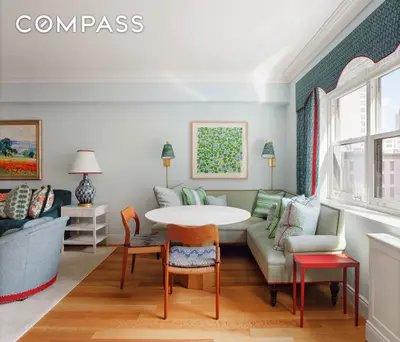
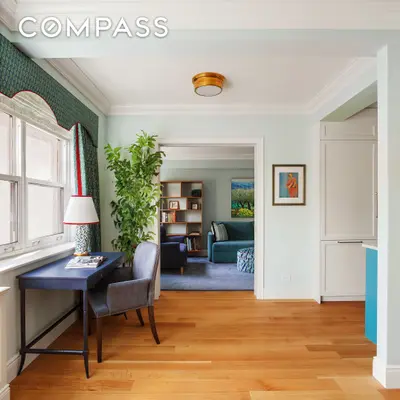
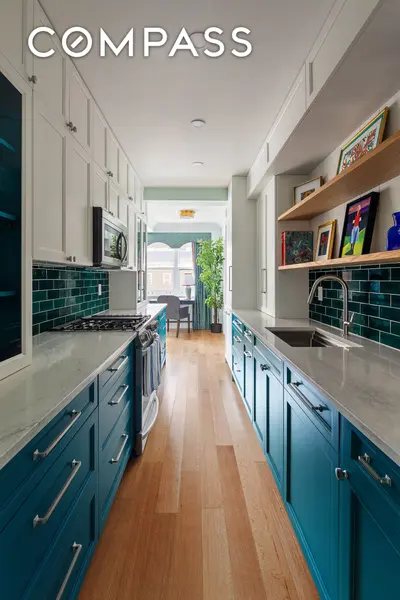
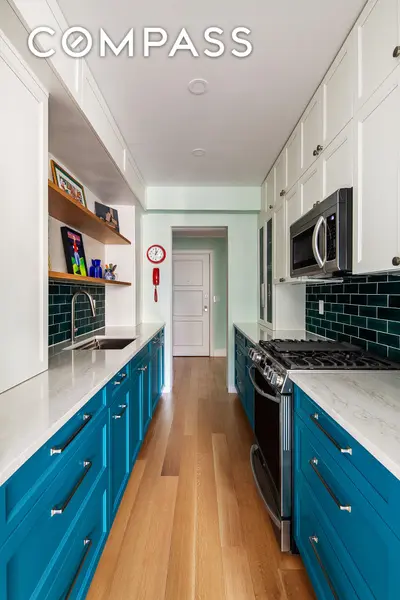
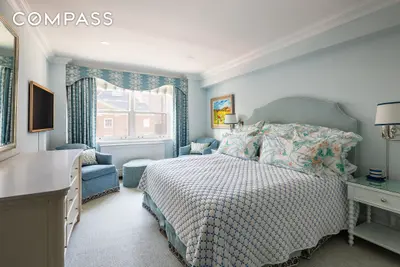
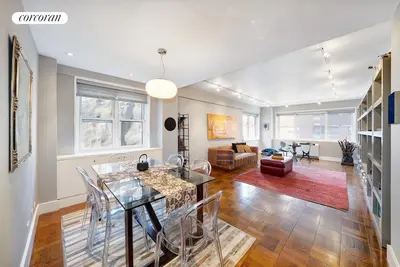
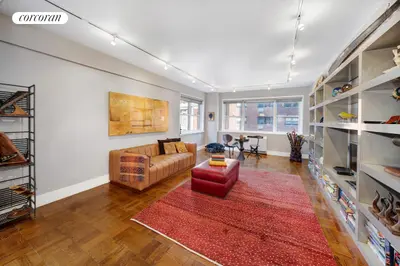
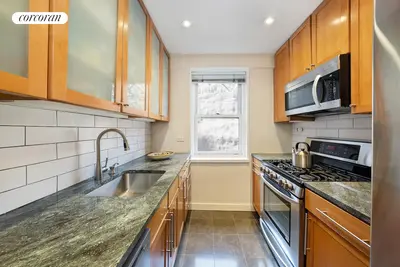
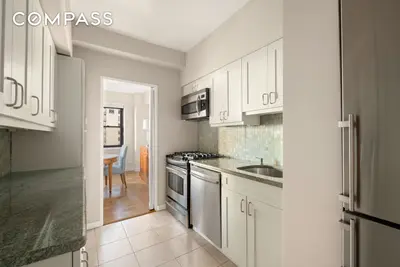
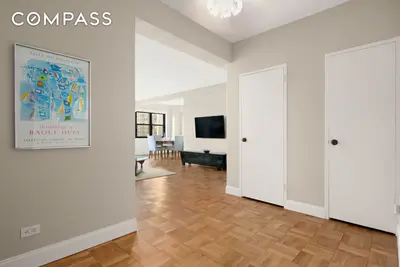
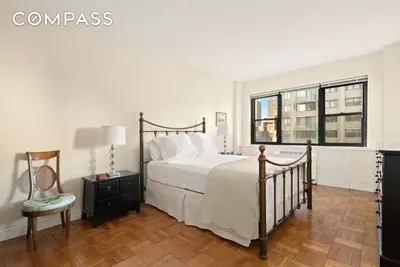
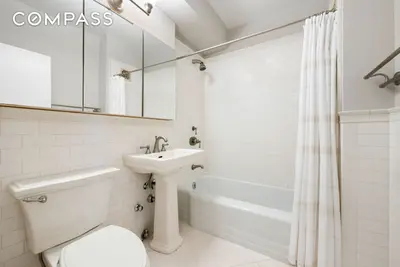
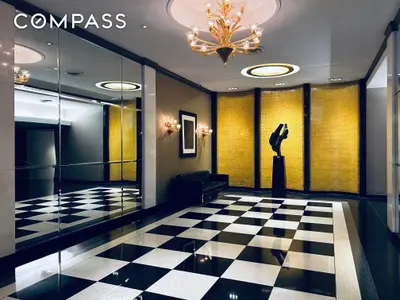
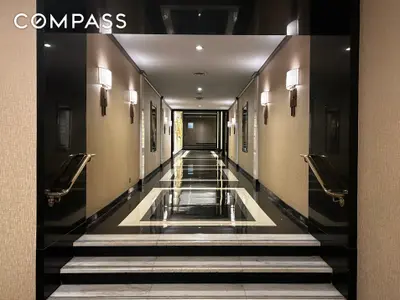
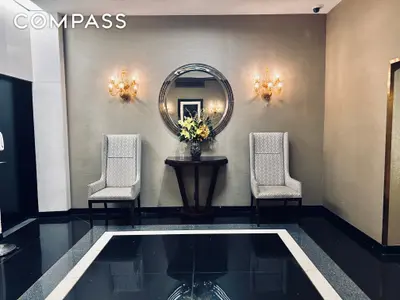
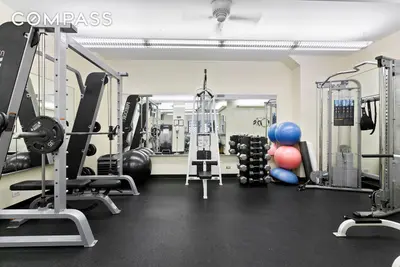
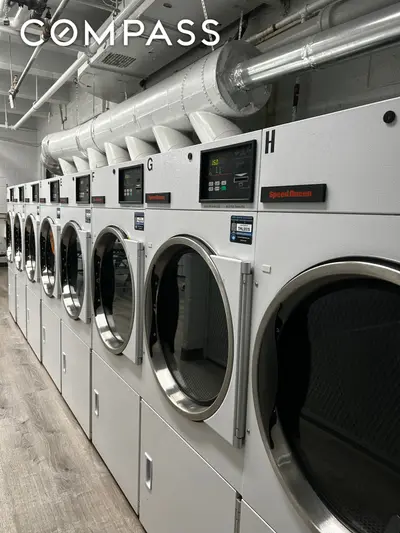
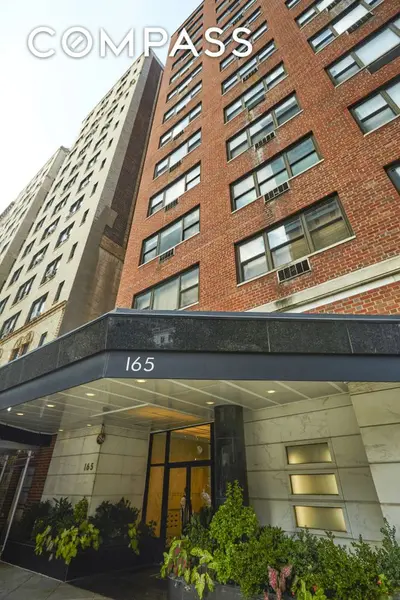
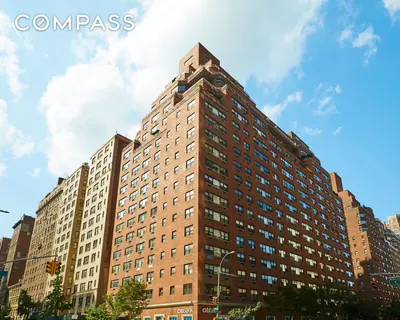

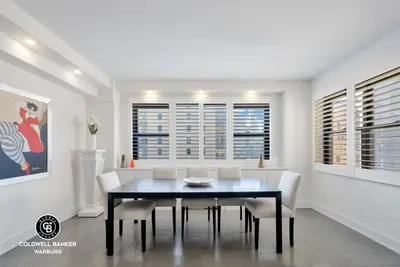

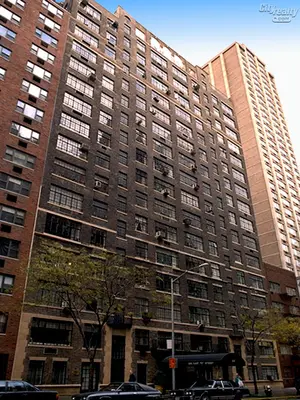
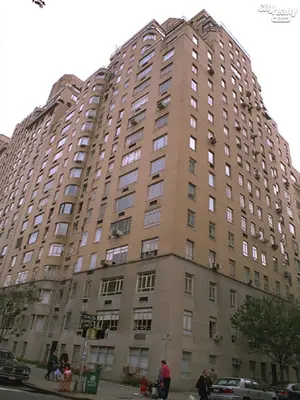
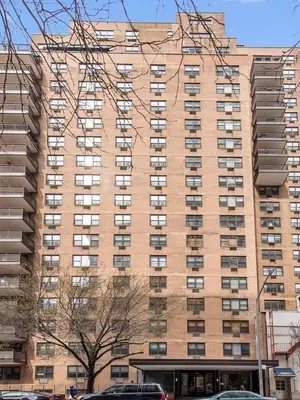
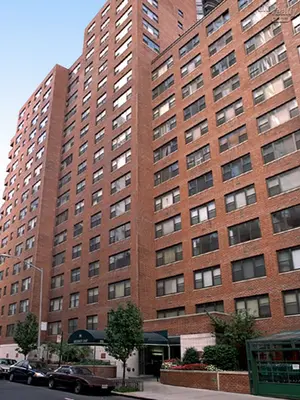
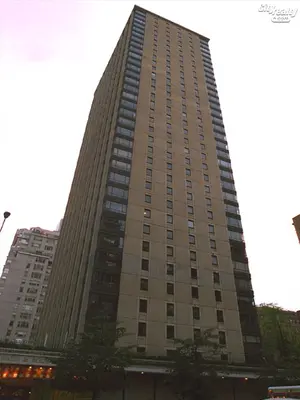
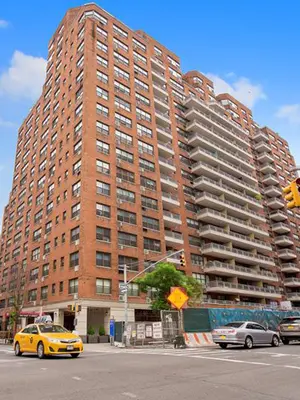
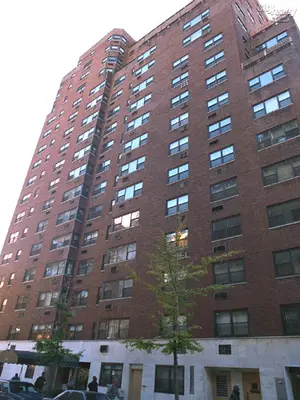
165 East 72nd Street is a full-service cooperative with a full-time doorman, resident manager, gym, parking, storage, and central laundry room. Pets are permitted. Pied-a-terres are allowed on a case-by-case basis, but subletting is not.
Discover hidden opportunities at 165 East 72nd Street! Reach out today to learn about select off-market listings.

View school info, local attractions, transportation options & more.
Experience amazing 3D aerial maps and fly throughs.
For some co-ops, instead of price per square foot, we use an estimate of the number of rooms for each sold apartment to chart price changes over time. This is because many co-op listings do not include square footage information, and this makes it challenging to calculate accurate square-foot averages.
By displaying the price per estimated room count, we are able to provide a more reliable and consistent metric for comparing sales in the building. While we hope that this gives you a clearer sense of price trends in the building, all data should be independently verified. All data provided are only estimates and should not be used to make any purchase or sale decision.
|
Year
Avg Price / Room (Est)
Avg. Actual Price
Med. Actual Price
Transactions
2025
$513,714
$1,798,000
1
2024
$289,503
$1,432,444
9
2023
$267,806
$1,454,375
8
2022
$313,151
$1,420,500
9
2021
$258,919
$1,219,573
13
2020
$230,467
$989,000
3
2019
$290,658
$1,071,750
8
2018
$337,306
$1,407,708
3
2017
$358,229
$1,813,281
8
2016
$312,775
$1,411,864
11
2015
$391,711
$1,632,125
8
2014
$315,244
$1,331,063
8
|
Year
Avg Price / Room (Est)
Avg. Actual Price
Med. Actual Price
Transactions
2013
$255,080
$1,076,479
12
2012
$281,457
$1,737,000
2
2011
$228,302
$904,000
8
2010
$234,590
$1,184,375
8
2009
$251,964
$1,143,750
4
2008
$361,203
$1,520,818
11
2007
$270,321
$1,233,200
5
2006
$249,286
$1,308,978
8
2005
$271,454
$1,440,618
10
2004
$179,700
$803,857
7
2003
$135,367
$660,917
10
|
the following is a slider of images. For screen reader users, all slides are visible at all time so you may ignore control buttons.
Sign-up and we'll email you new listings in this building!
Whether you’re a buyer, investor, or simply curious, this report is your key to unlocking in-depth insights and analysis on .
Please confirm your details: