Learn more about off-market listings at 315 East 72nd Street!
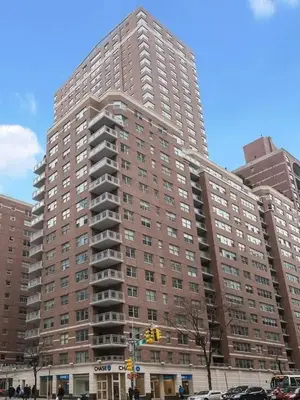
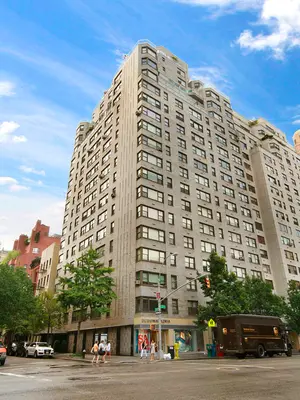
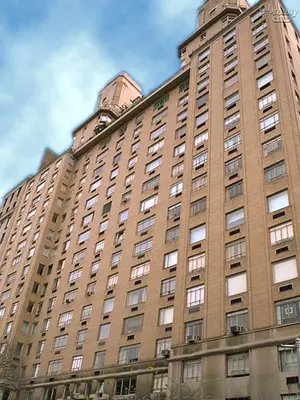
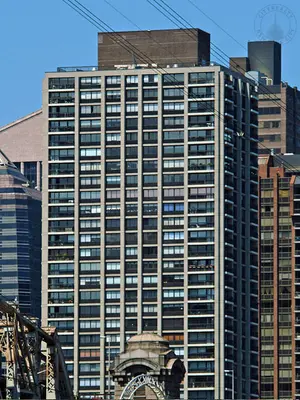
315 East 72nd Street
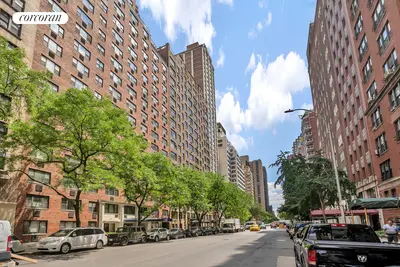
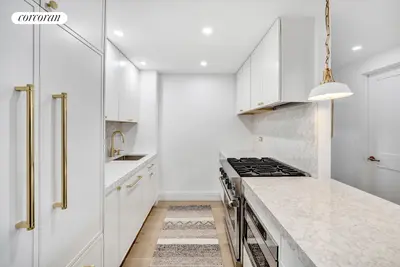
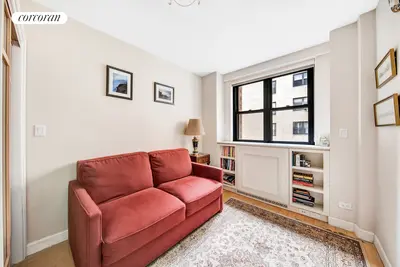
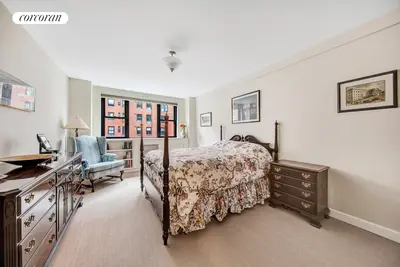
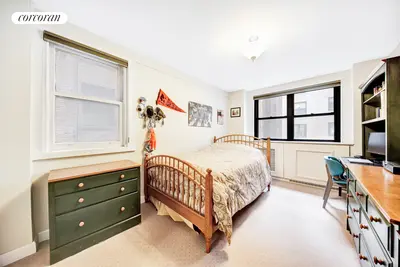
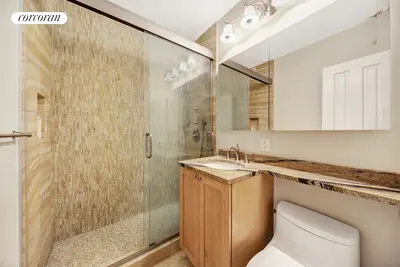
Doorman Co-Op in Lenox Hill
- Apartments
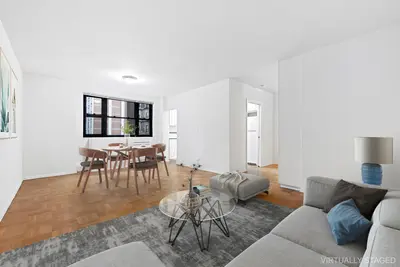
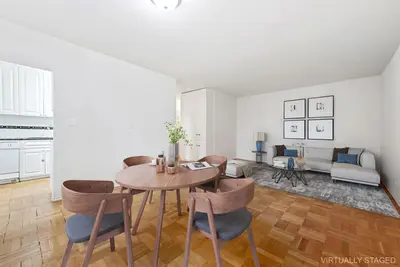
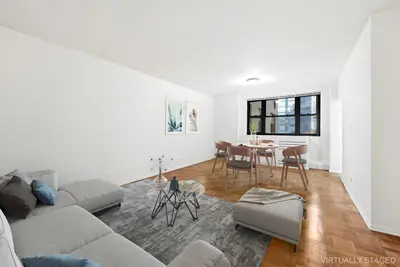
- Overview & Photos
- Maps
- Floorplans
- Sales Data & Comps
- Similar Buildings
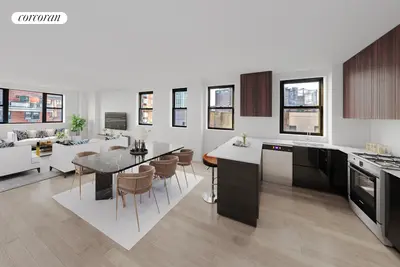
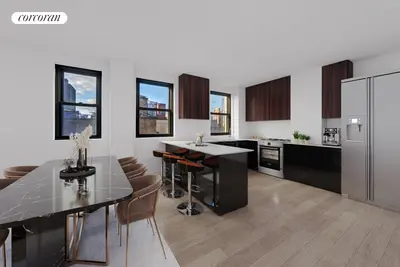
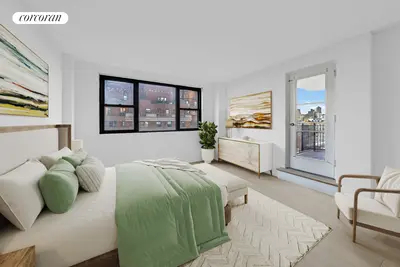

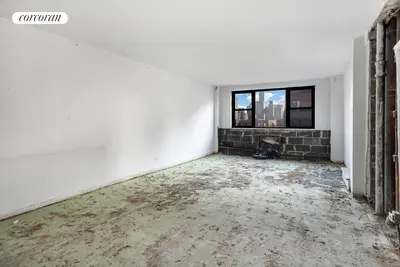
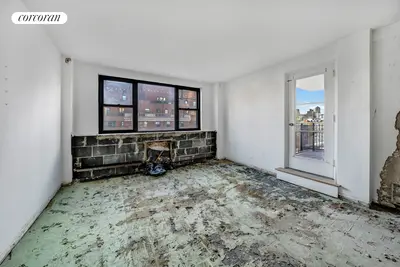
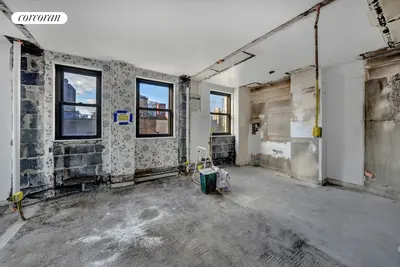
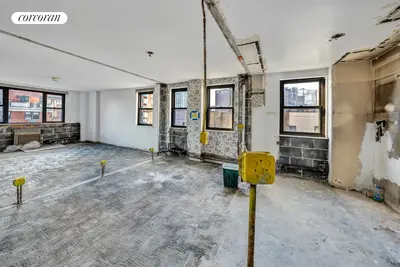
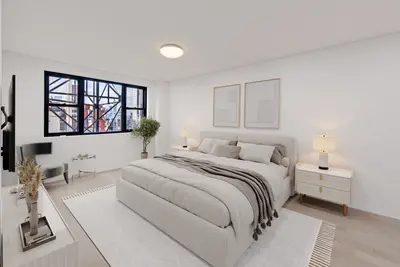
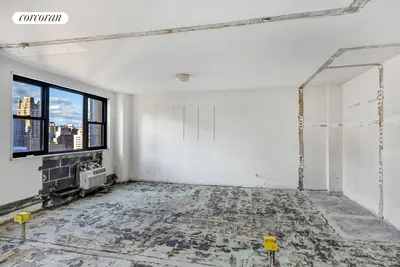
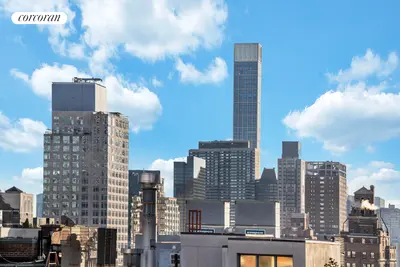
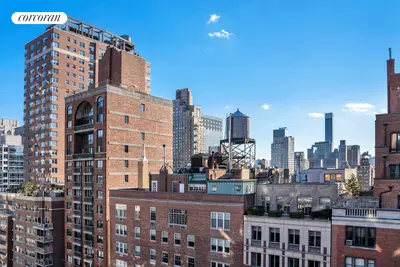
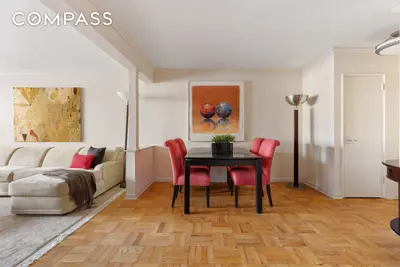
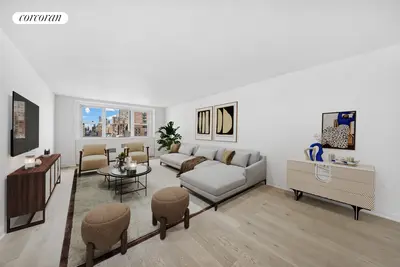
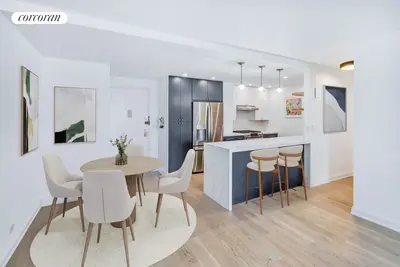
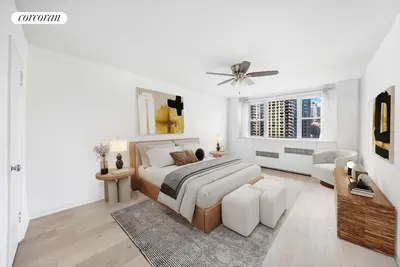
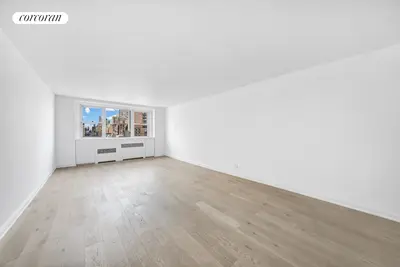
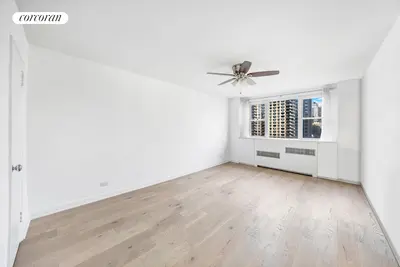
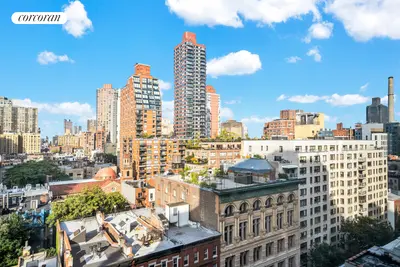
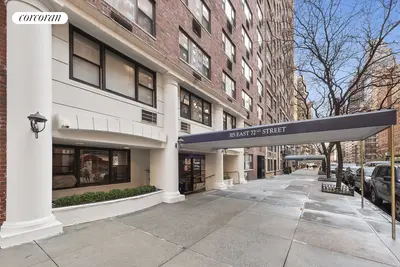
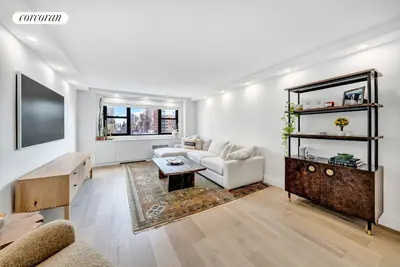
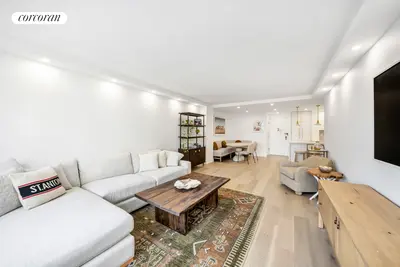
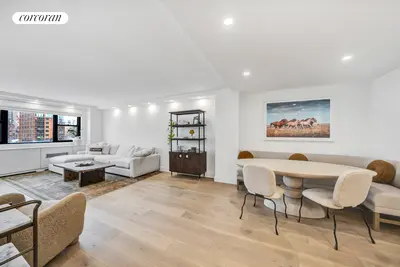
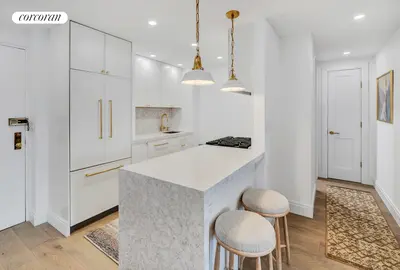
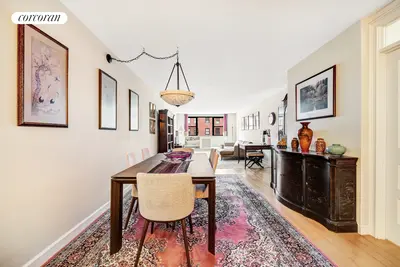
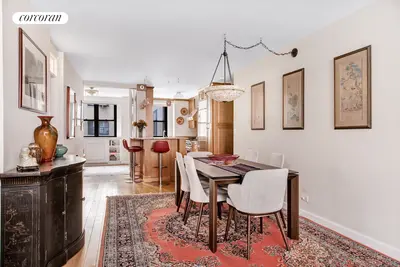
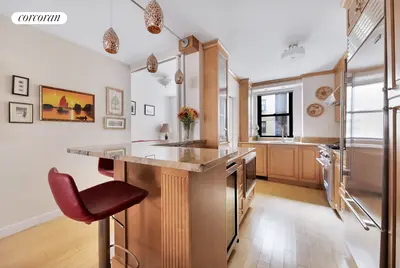
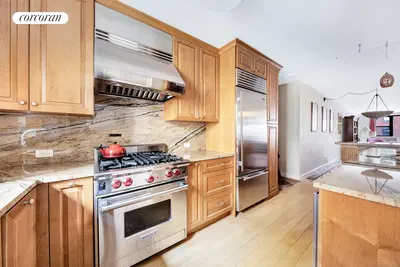
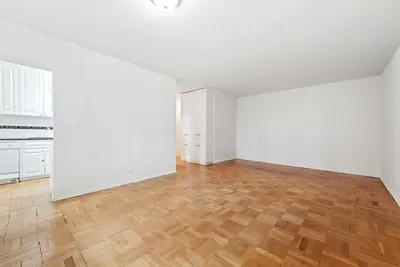
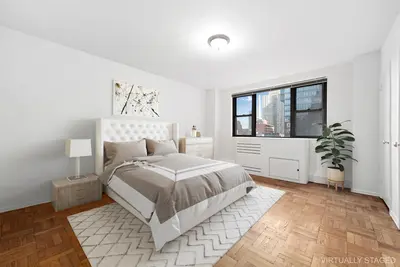
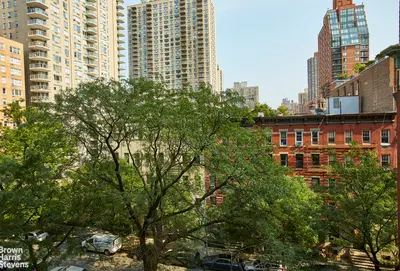
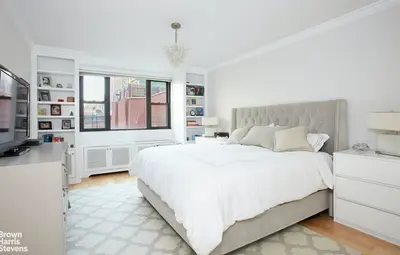
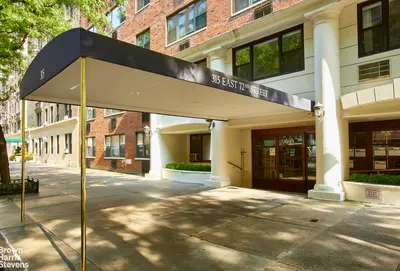
315 East 72nd Street was built in 1959 and has a total of 218 apartments. Located in Lenox Hill, 315 East 72nd Street is a short walk to the 6 subway line.
During the past two years, 14 apartments have sold: the most expensive was a two bedroom that sold for $1,899,000, and the least expensive was a one bedroom that sold for $625,000.
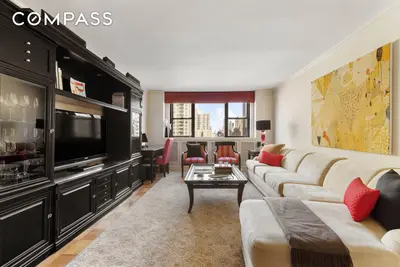
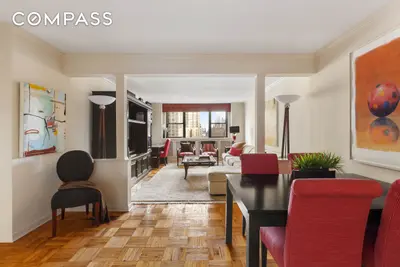
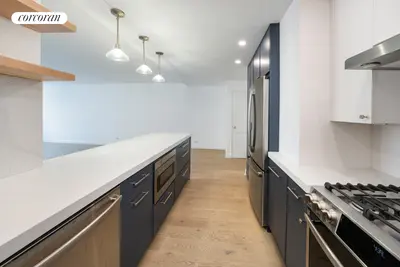
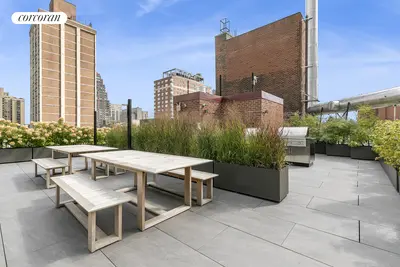
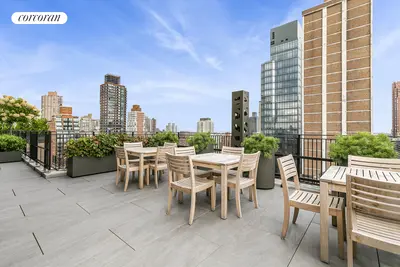
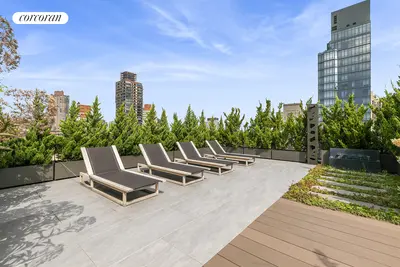
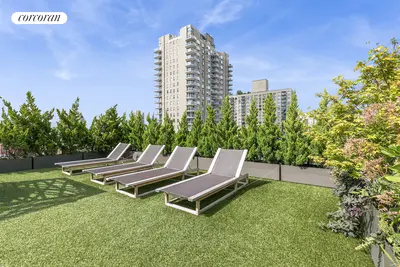
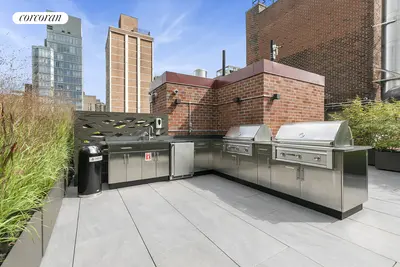
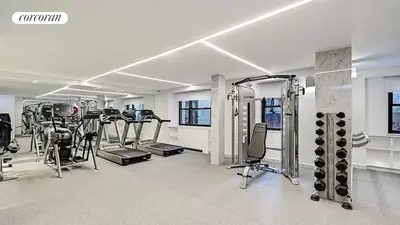
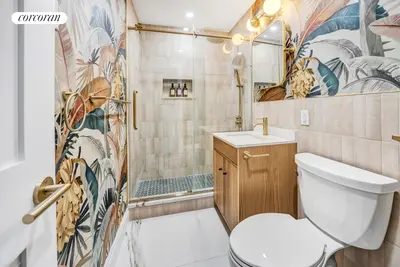
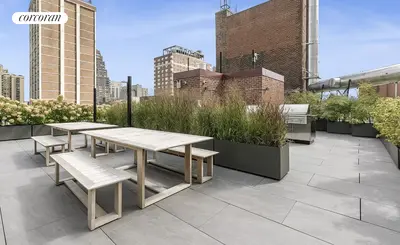
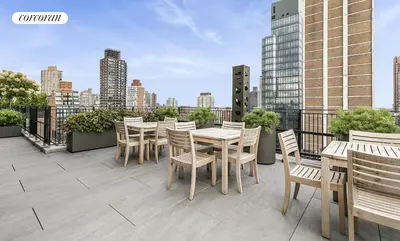
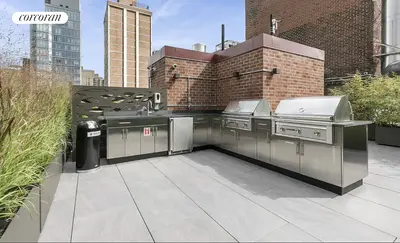
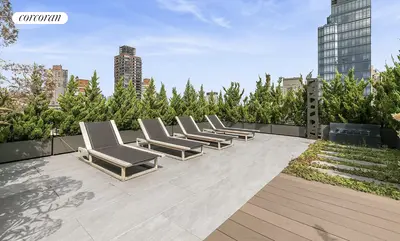
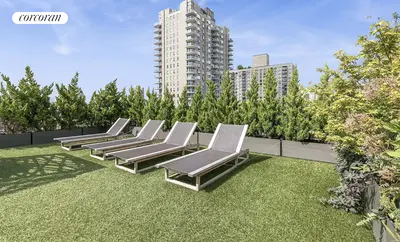
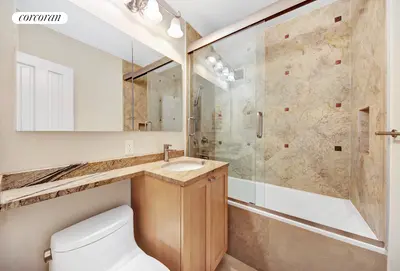
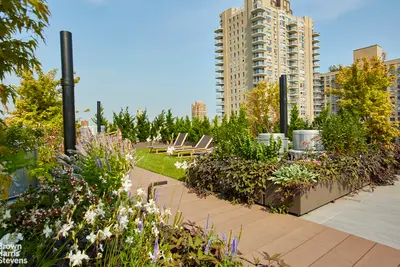
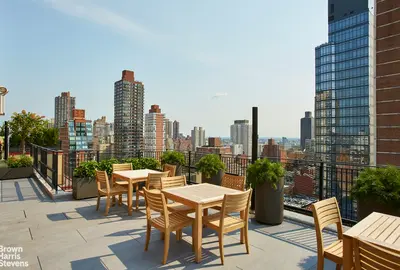
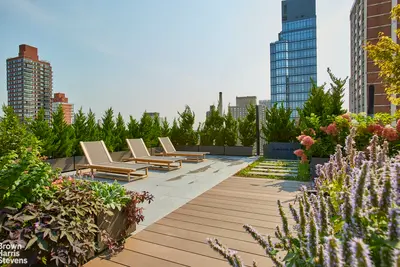
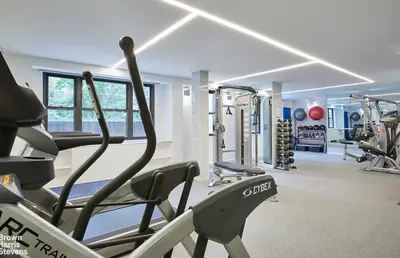
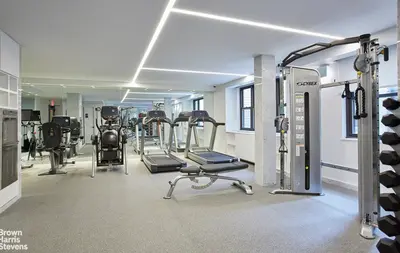
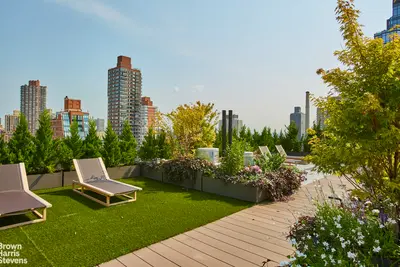
Amenities at this pet friendly post war building include doorman, resident storage, washer/dryer in building and garden.
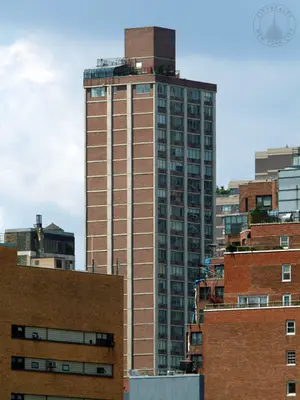
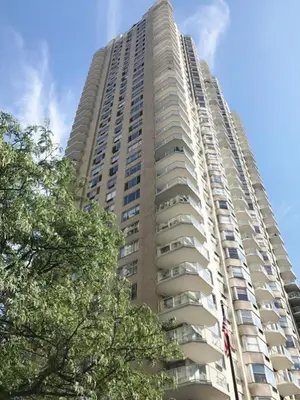
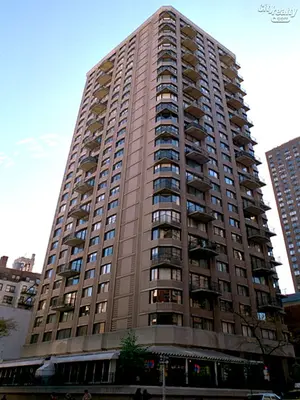
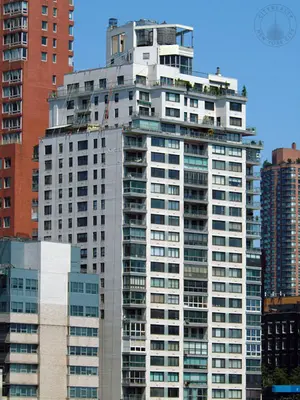
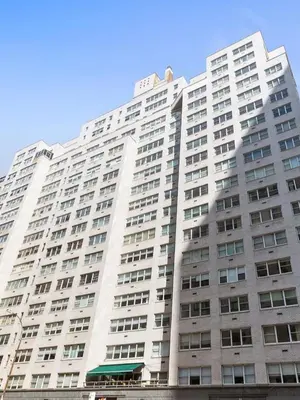
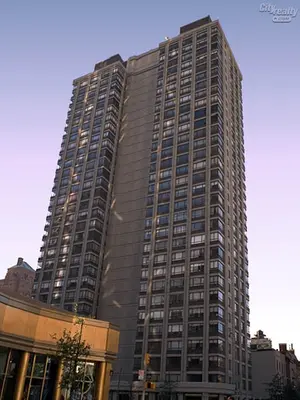
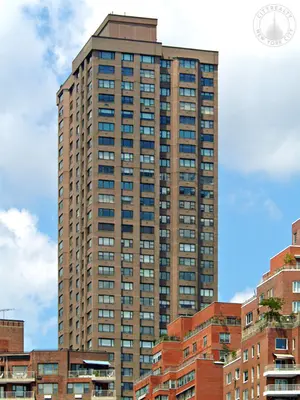
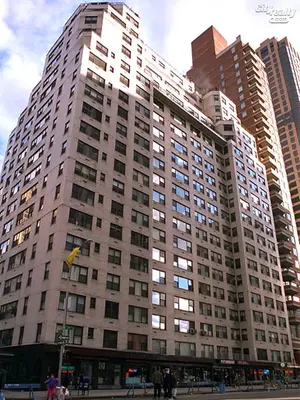
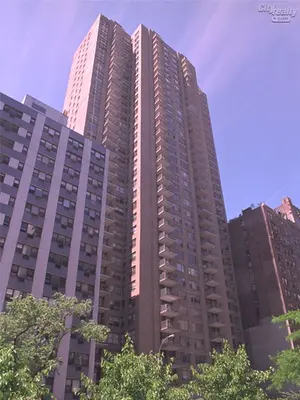
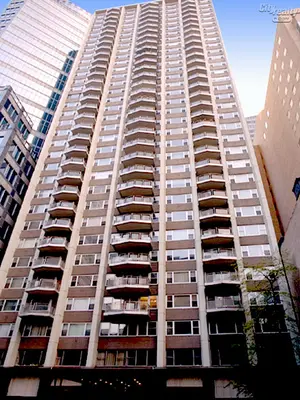
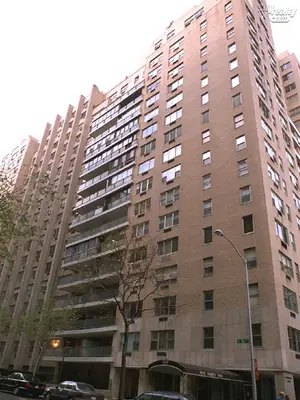
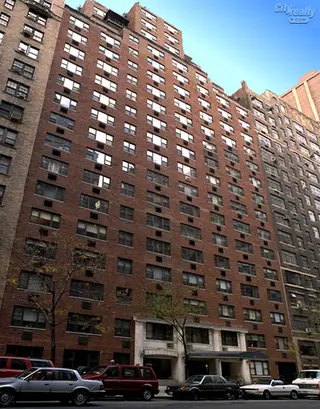
Similar nearby buildings include 353 East 72nd Street, 300 East 74th Street and 360 East 72nd Street.
Learn more about off-market listings at 315 East 72nd Street!

View school info, local attractions, transportation options & more.
Experience amazing 3D aerial maps and fly throughs.
For some co-ops, instead of price per square foot, we use an estimate of the number of rooms for each sold apartment to chart price changes over time. This is because many co-op listings do not include square footage information, and this makes it challenging to calculate accurate square-foot averages.
By displaying the price per estimated room count, we are able to provide a more reliable and consistent metric for comparing sales in the building. While we hope that this gives you a clearer sense of price trends in the building, all data should be independently verified. All data provided are only estimates and should not be used to make any purchase or sale decision.
|
Year
Avg Price / Room (Est)
Avg. Actual Price
Med. Actual Price
Transactions
2025
$280,000
$840,000
1
2024
$298,600
$1,161,125
8
2023
$255,333
$766,000
5
2022
$289,242
$1,323,846
13
2021
$306,456
$1,259,600
15
2020
$322,333
$1,664,833
6
2019
$256,097
$1,131,625
12
2018
$328,333
$1,646,429
7
2017
$312,942
$1,684,333
12
2016
$278,750
$1,321,250
4
2015
$236,422
$1,166,500
10
2014
$263,790
$1,587,400
10
|
Year
Avg Price / Room (Est)
Avg. Actual Price
Med. Actual Price
Transactions
2013
$230,220
$992,000
10
2012
$198,238
$872,857
7
2011
$212,544
$873,950
10
2010
$200,444
$773,833
6
2009
$171,361
$618,571
7
2008
$321,083
$1,309,569
9
2007
$254,741
$1,164,667
9
2006
$236,688
$937,799
14
2005
$206,251
$966,384
7
2004
$156,325
$629,350
15
2003
$148,111
$665,167
18
|
the following is a slider of images. For screen reader users, all slides are visible at all time so you may ignore control buttons.
Sign-up and we'll email you new listings in this building!
Whether you’re a buyer, investor, or simply curious, this report is your key to unlocking in-depth insights and analysis on .
Please confirm your details: