Turtle Bay Towers, 310 East 46th Street, NYC - Condo Apartments
- Apartments
- Overview & Photos
- Maps
- Floorplans
- Sales Data & Comps
- Similar Buildings
- All Units
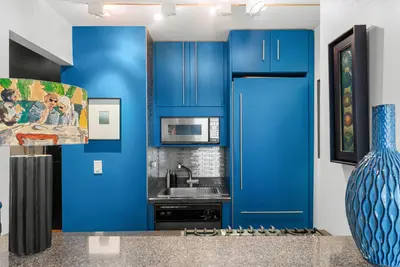
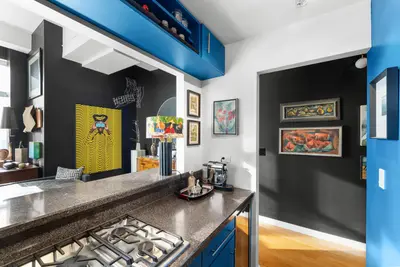
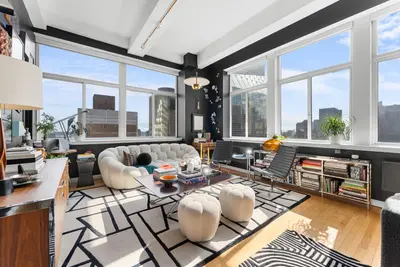
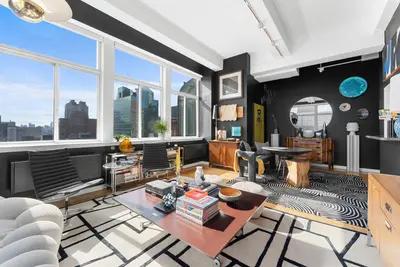
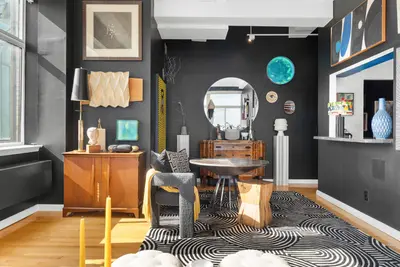
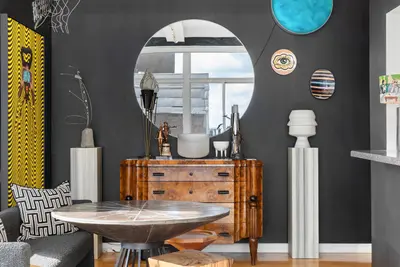
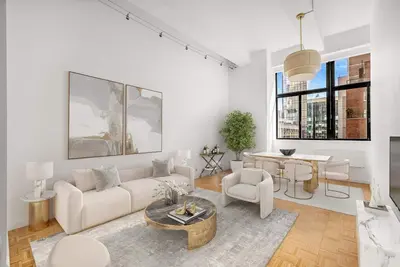
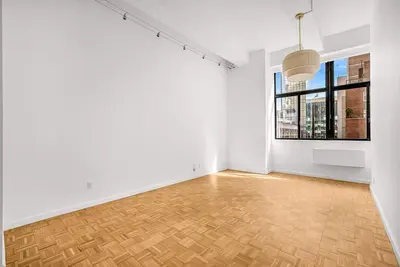
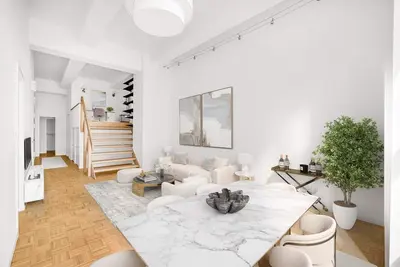
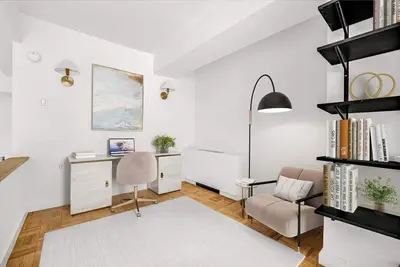
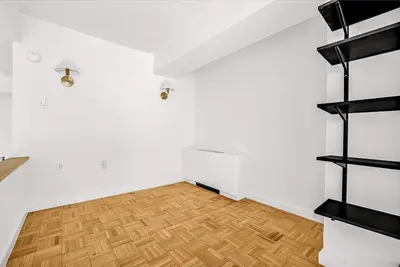
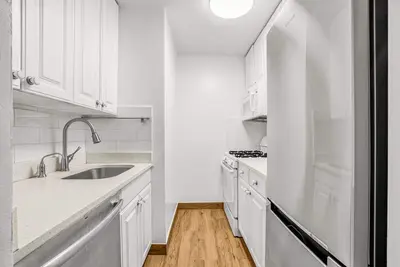
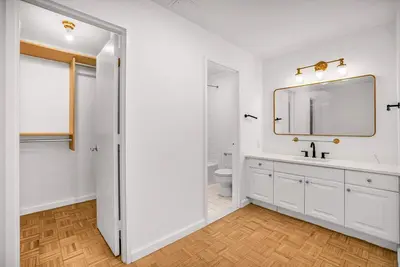
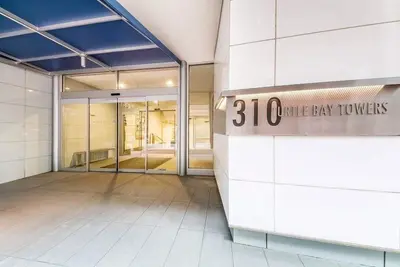
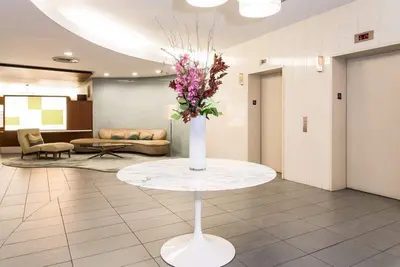
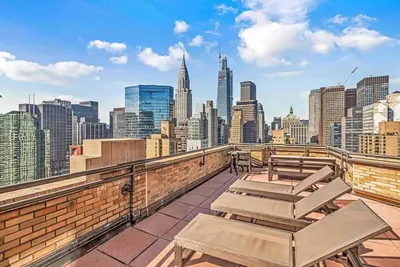
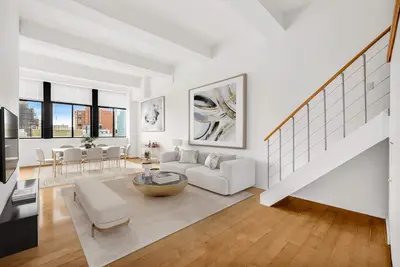
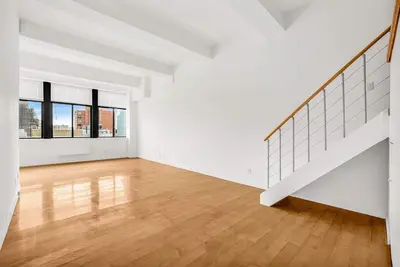
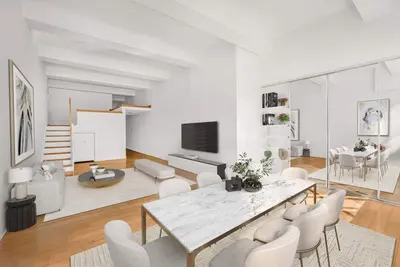
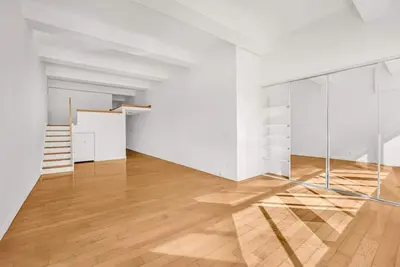
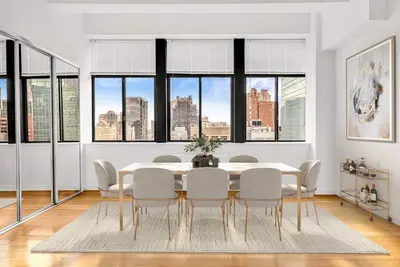
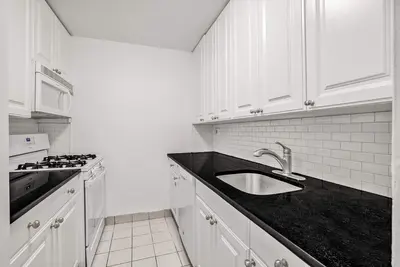
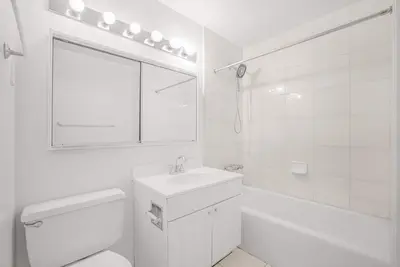

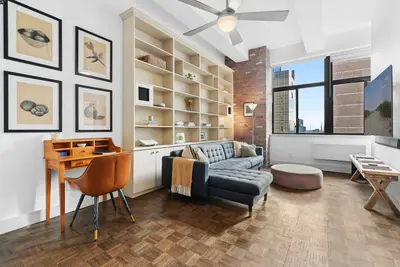
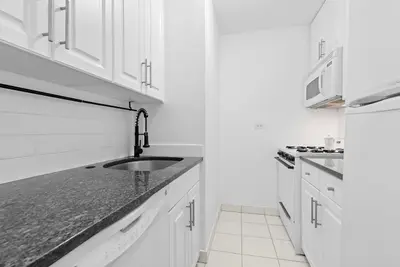
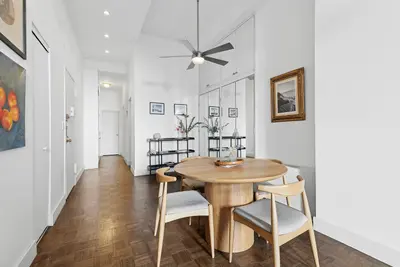
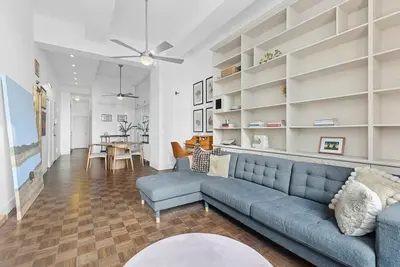
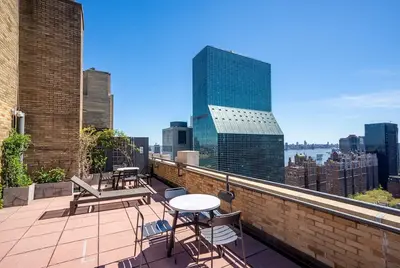
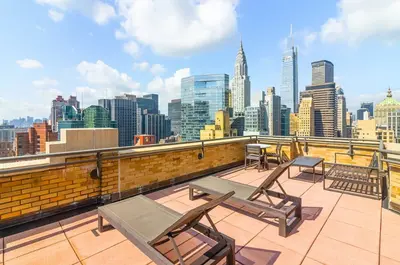
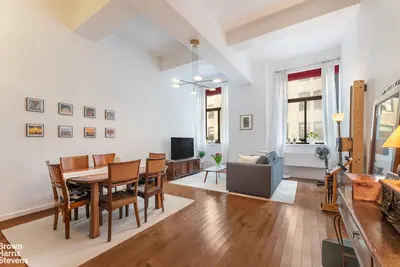
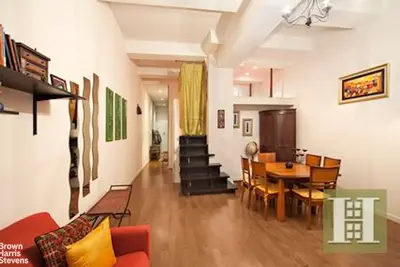
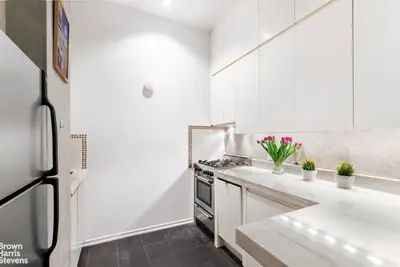
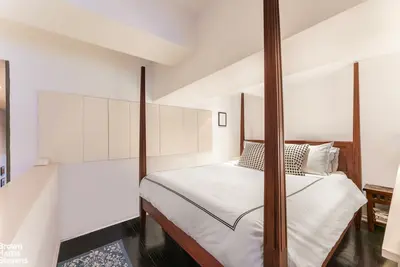

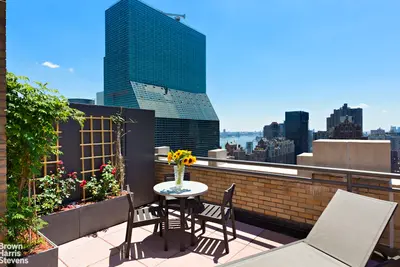
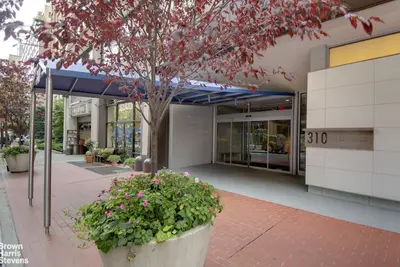

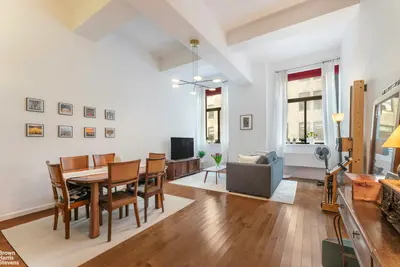


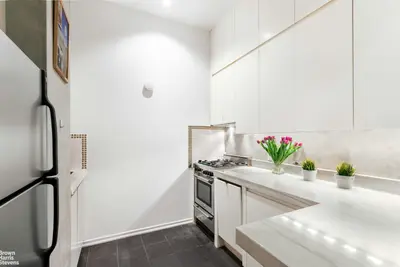

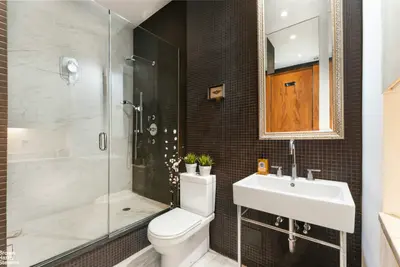


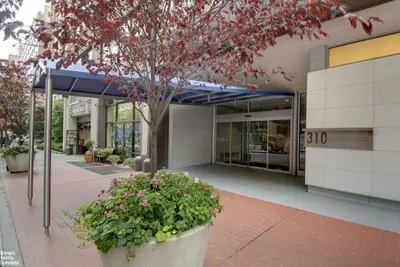
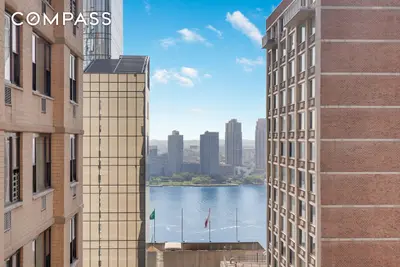
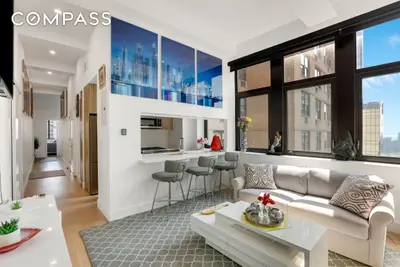
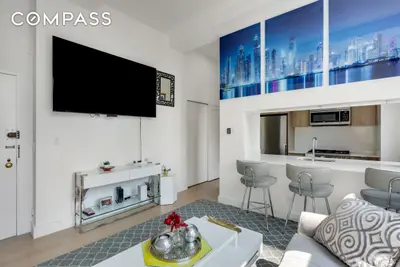
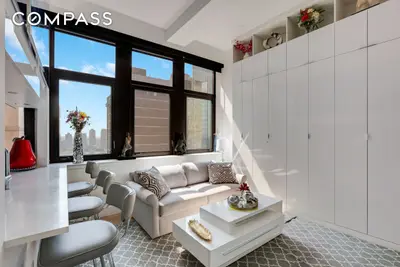
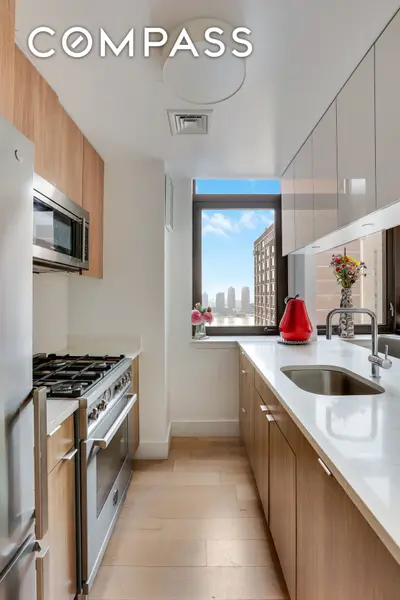
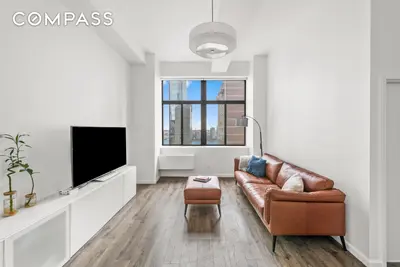
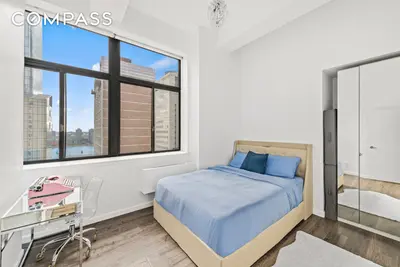
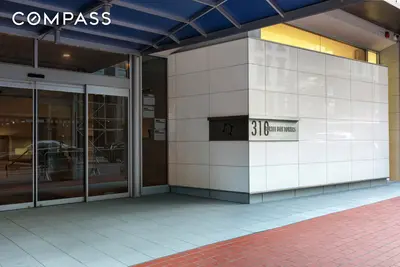
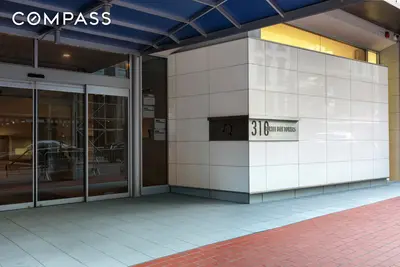
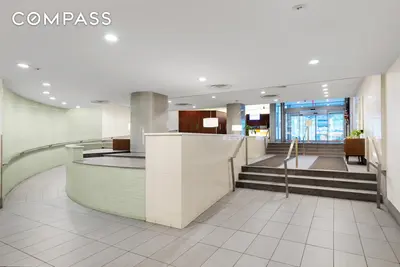


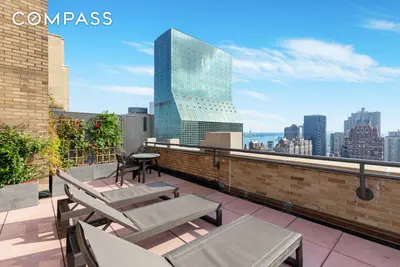

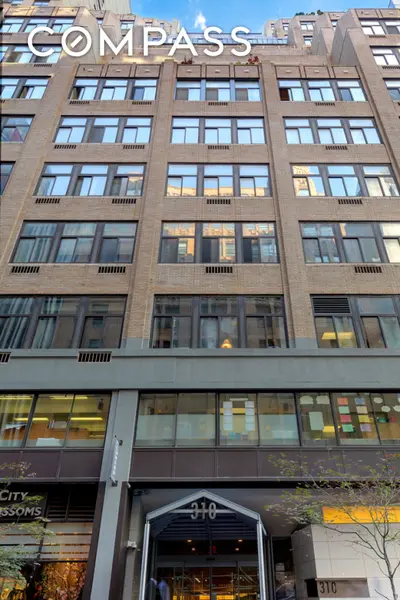

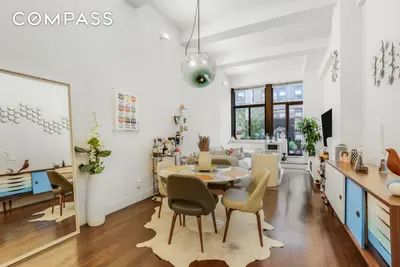
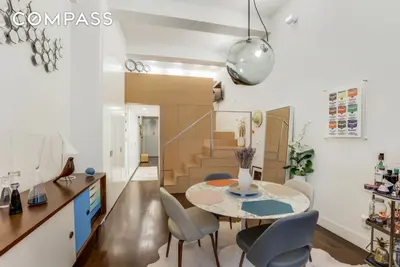
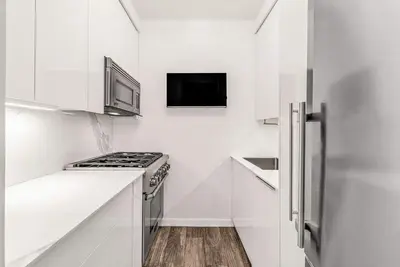

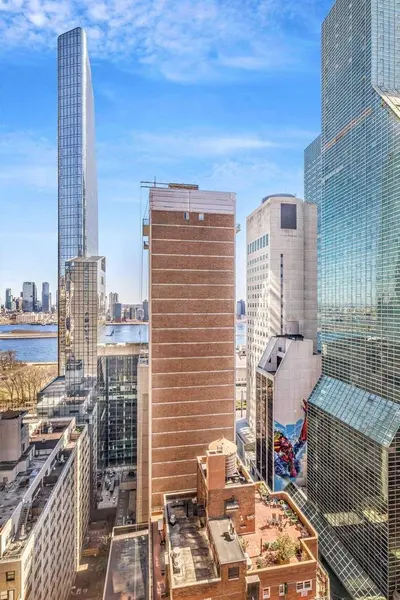

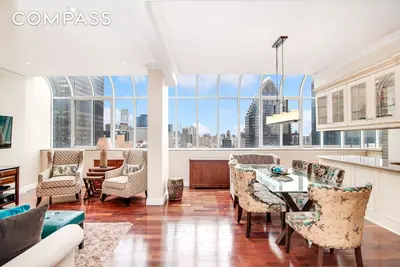


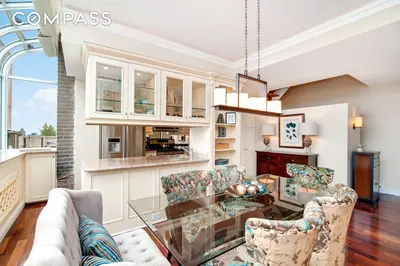

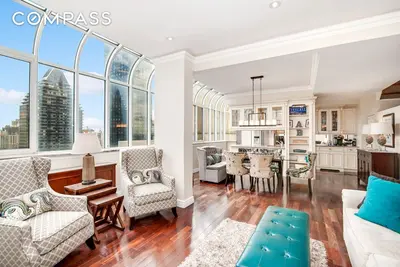


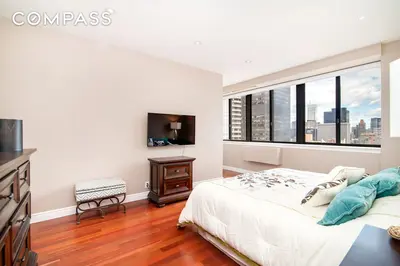
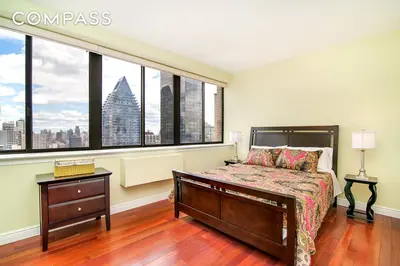


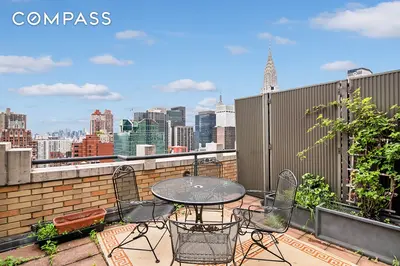


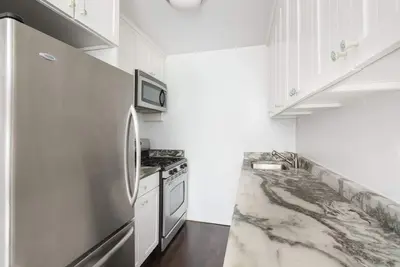
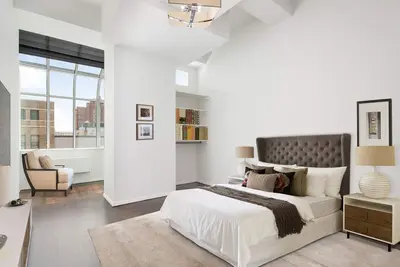
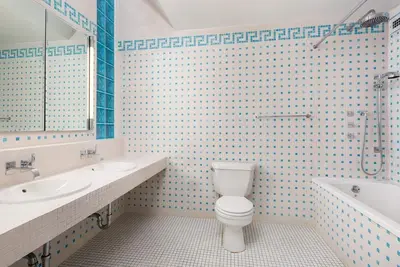

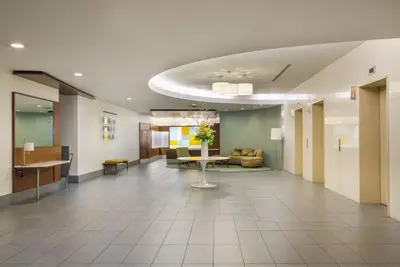
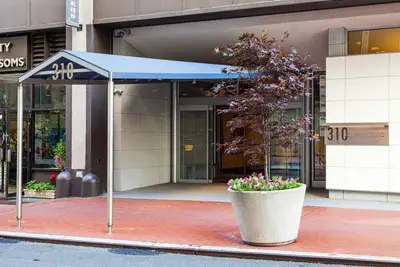
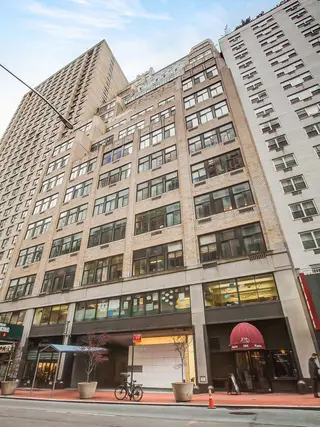
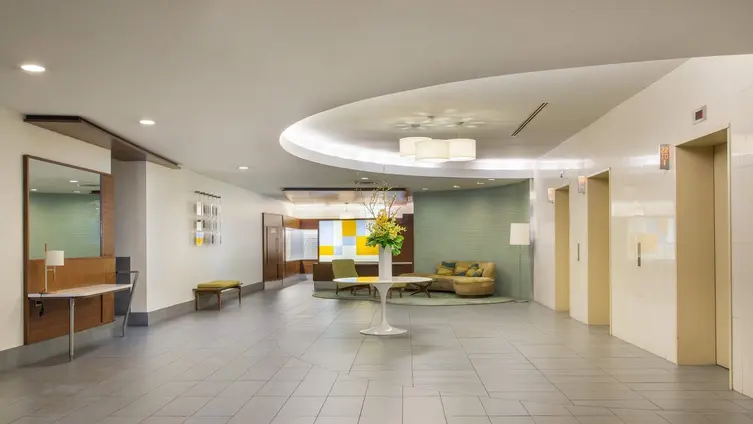
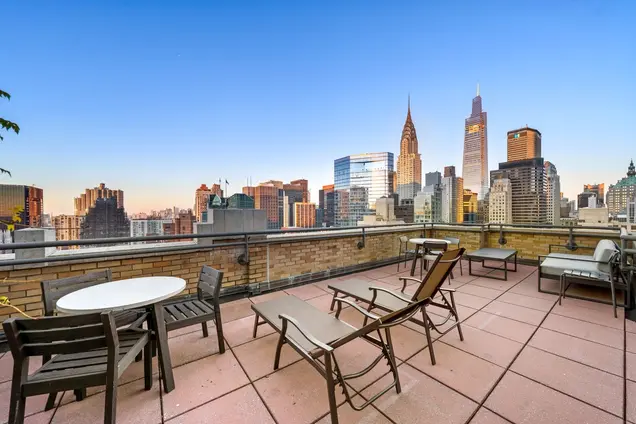
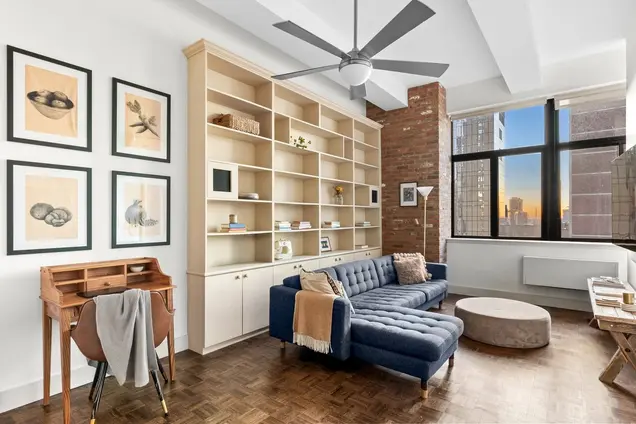
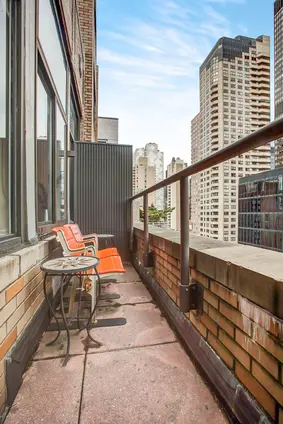
Turtle Bay Towers is a 27-story condop located at 310 East 46th Street. Built in 1929 as an design school and known for its striking terraced façade, the tower was briefly home to a print factory. In 1979, its careful conversion to 338 luxury apartments was noted with the First Honor Award from the American Institute of Architects. On-site amenities at this pet-friendly property include a large renovated lobby with two sitting areas, a rooftop terrace, laundry on floors 3-18, storage for rent, a bike room, and a parking garage adjacent to the lobby, plus 24-hour doorman service and a live-in super.
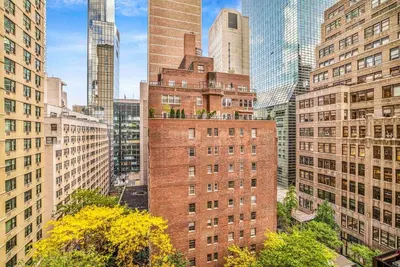
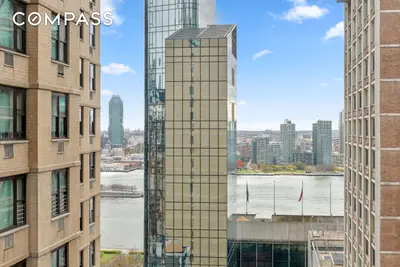
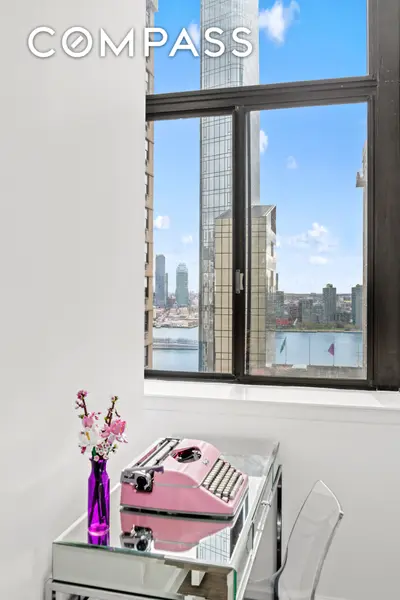
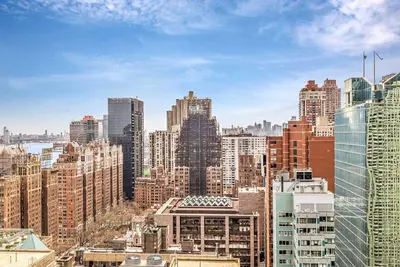
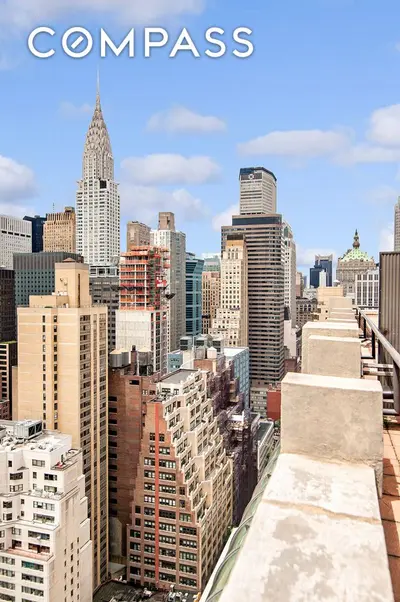
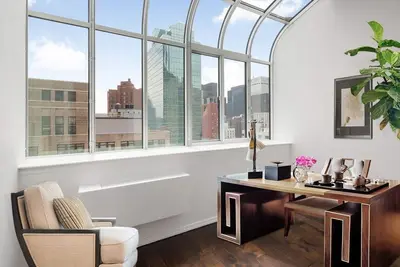
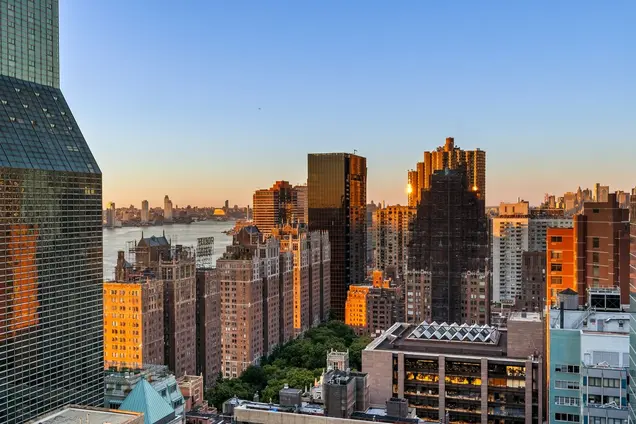
As a condop, Turtle Bay Towers combines all the attraction of a graceful prewar property with the flexibility of a condo: no formal board approval, an open sublet policy and pied-a-terres allowed. With a venerable history dating back to New Amsterdam, Turtle Bay is the most tranquil corner of Midtown Manhattan, known for its quiet tree-lined streets and beautiful green spaces. United Nations Plaza is just down the street, while Grand Central Station and Dag Hammarskjold Plaza are a few blocks in the other direction and all the appeal of living in the heart of Manhattan is moments away.


View school info, local attractions, transportation options & more.
Experience amazing 3D aerial maps and fly throughs.
Broker & Buyer Comments