Shh... Many units sell without being publicly listed.
Discover hidden opportunities at 333 East 14th Street! Reach out today to learn about select off-market listings.
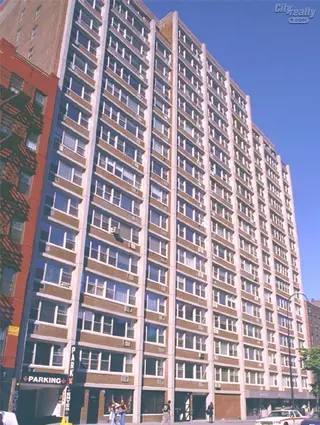
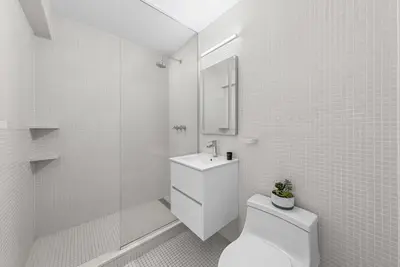
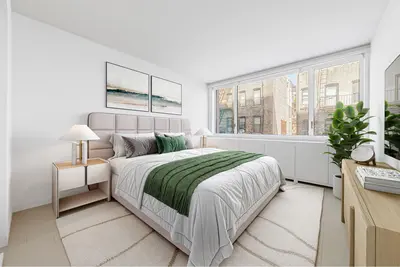
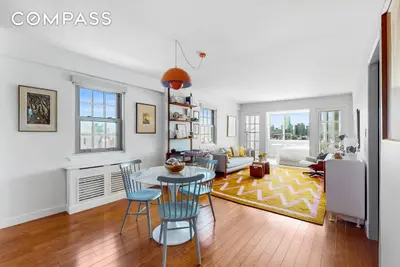
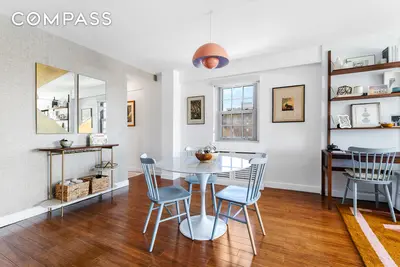
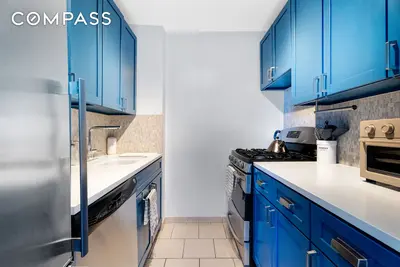
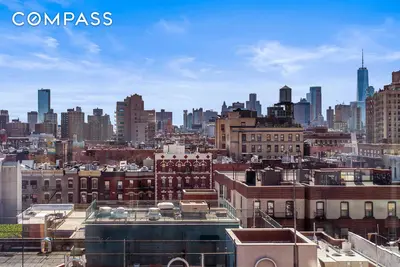

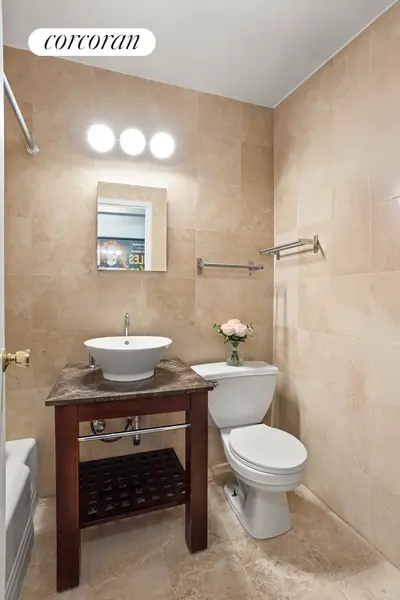

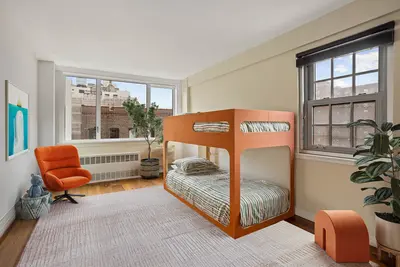
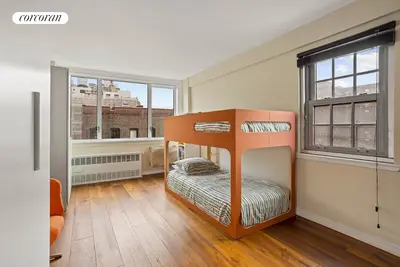
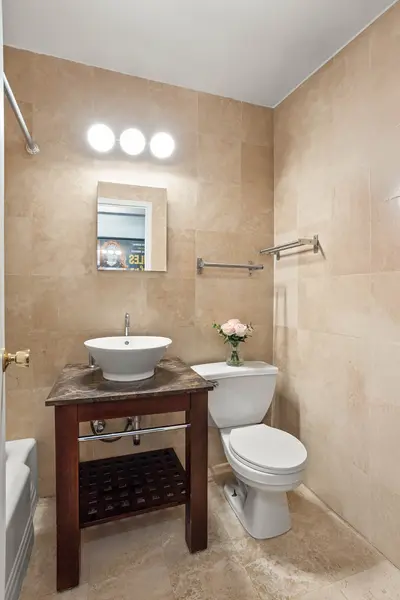
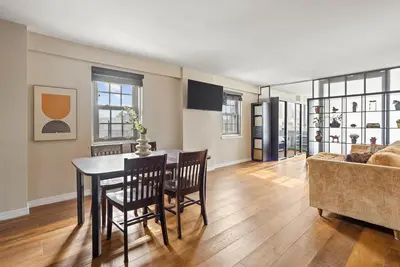
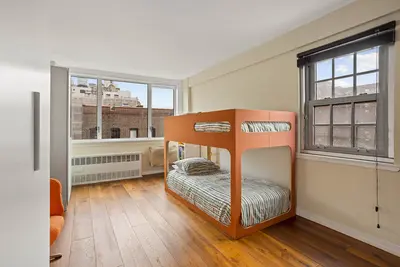
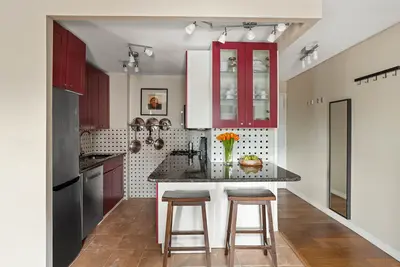
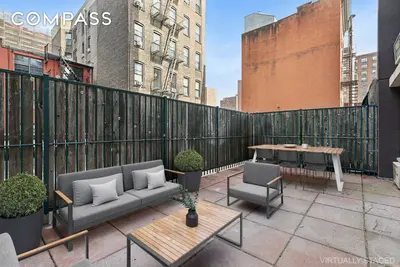
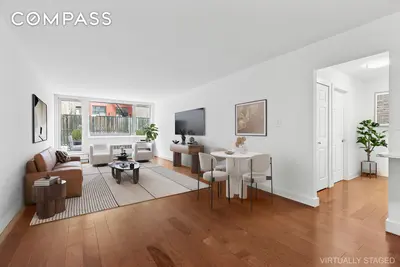
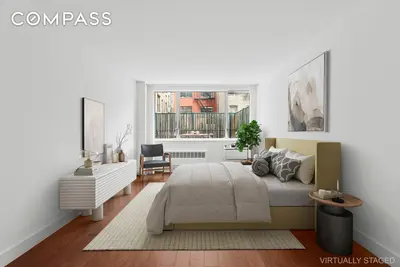
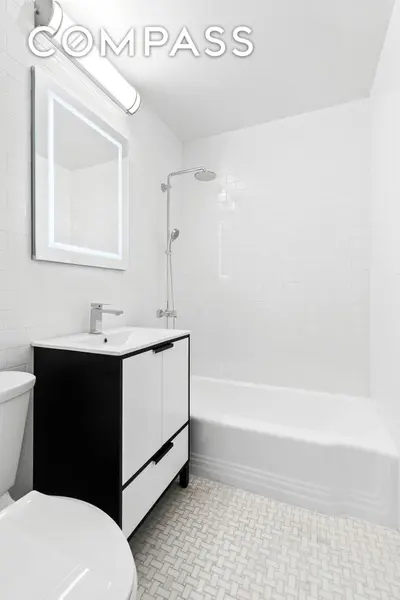
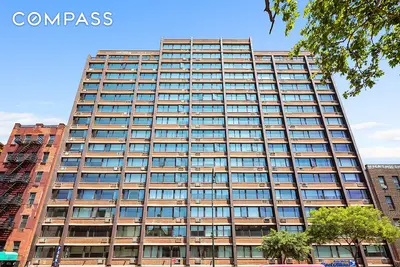
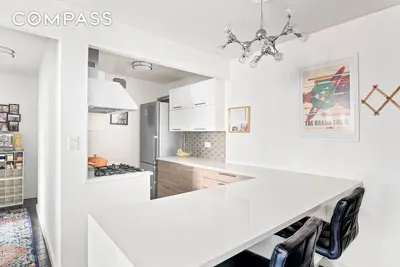
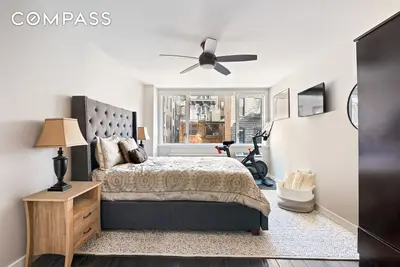
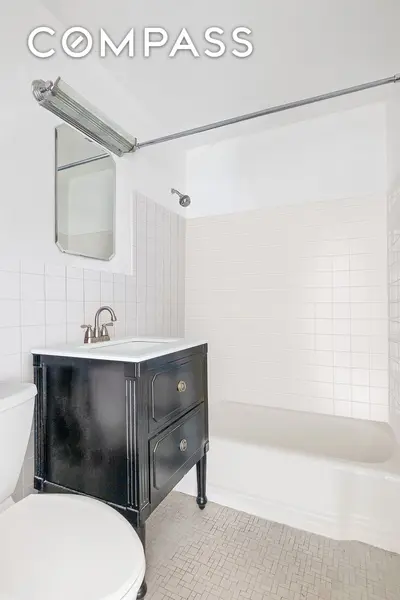
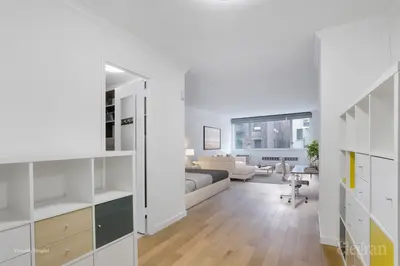

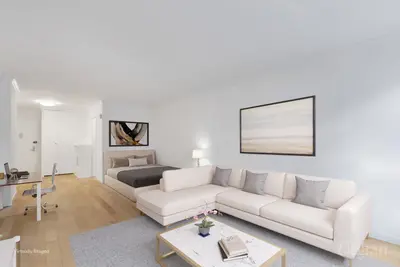
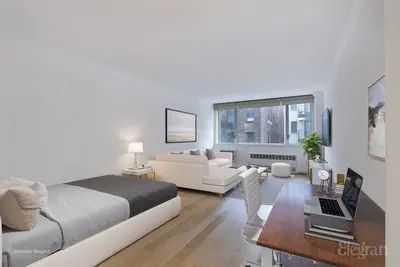
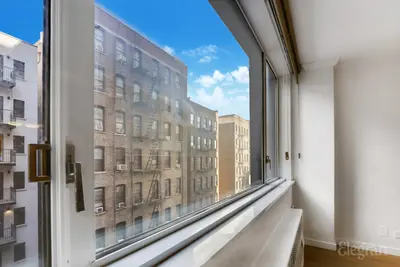
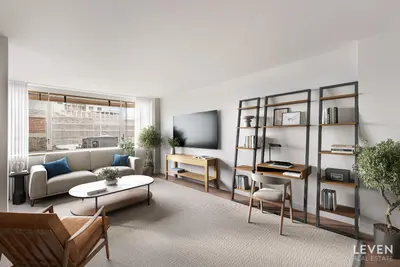
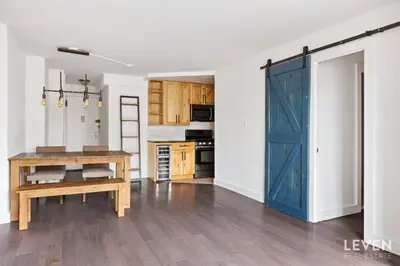
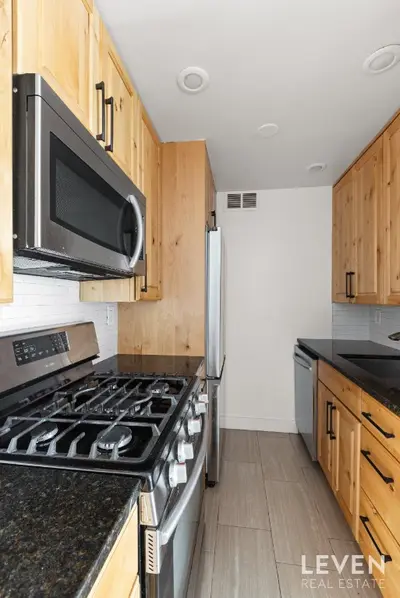
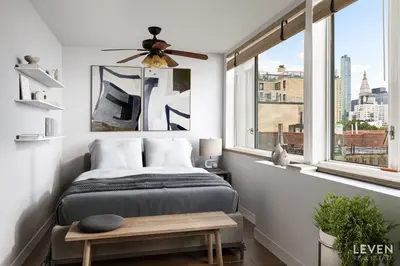

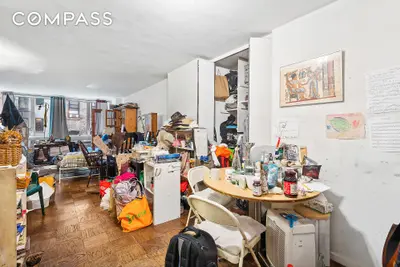
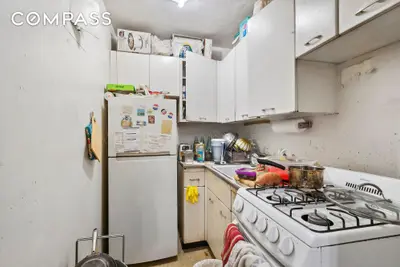
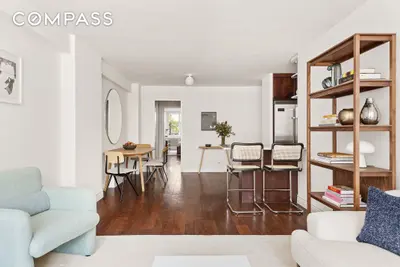
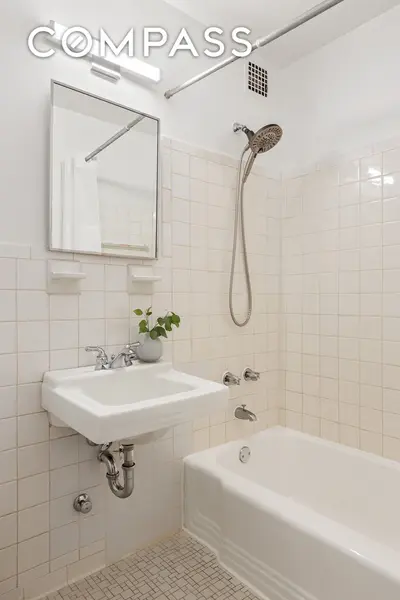
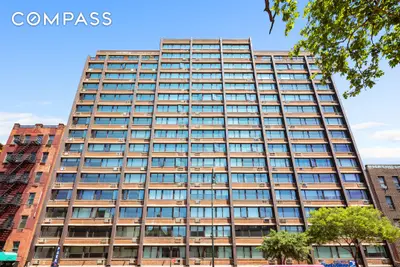
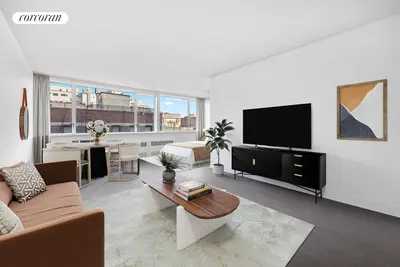
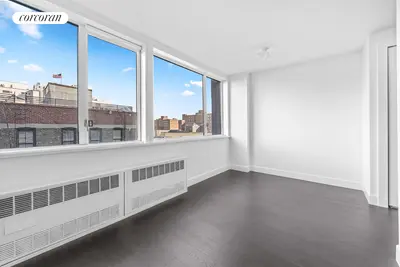
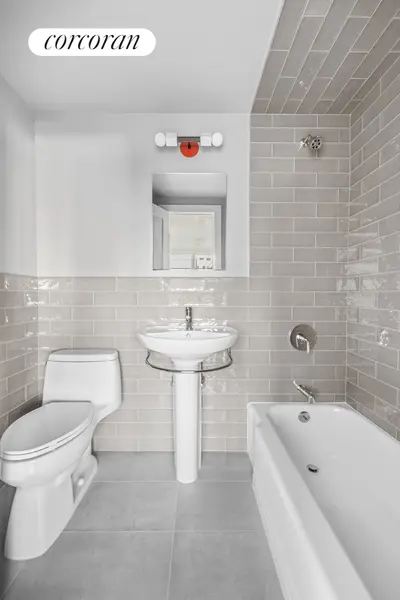
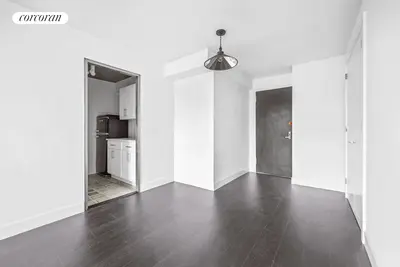
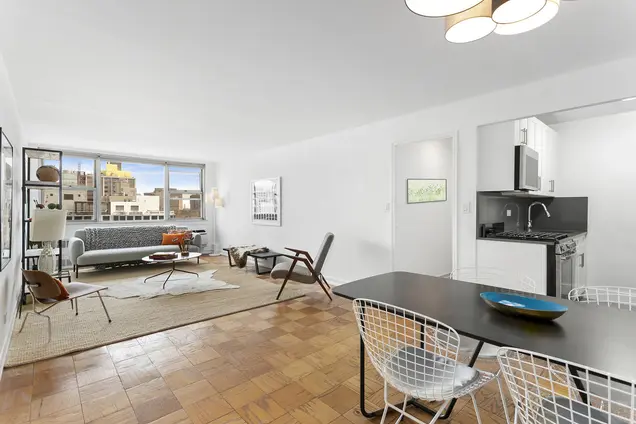
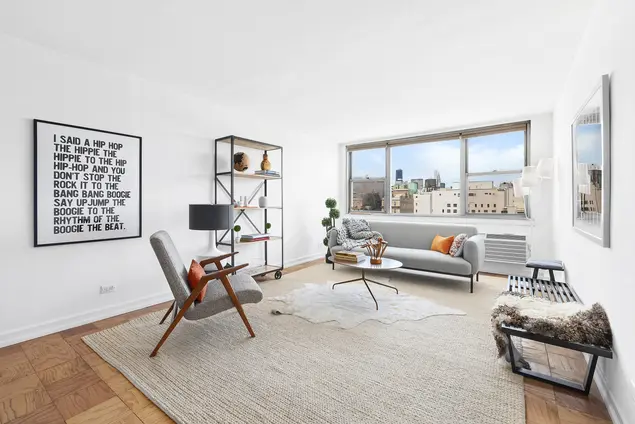
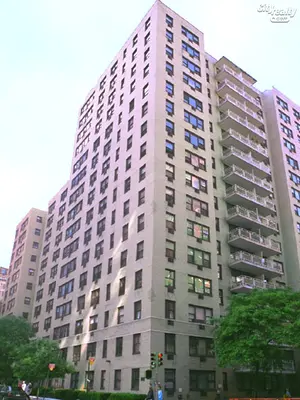
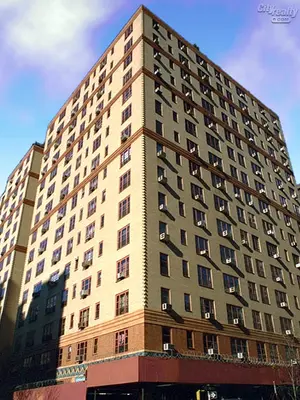
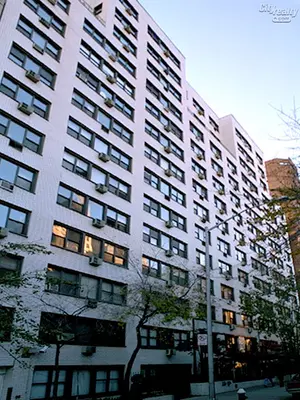
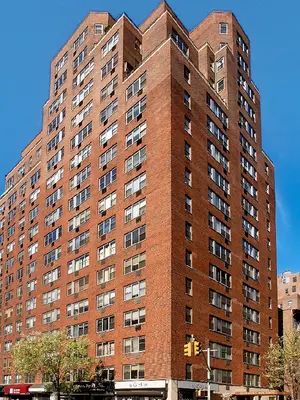
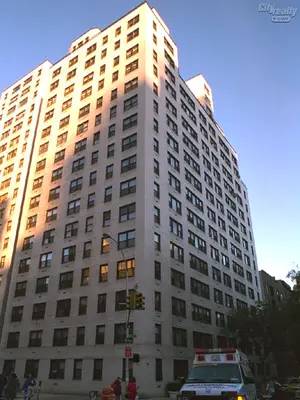
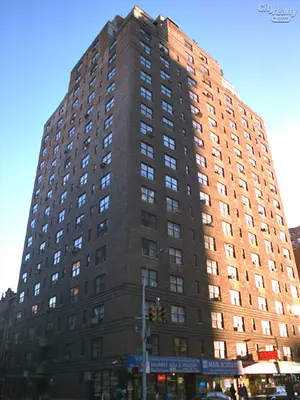
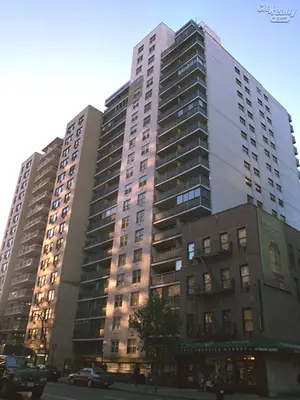
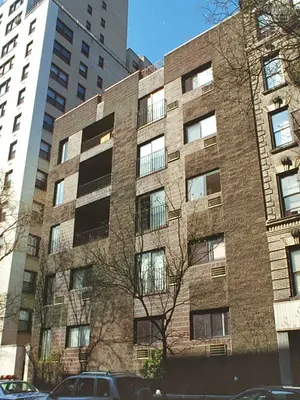
333 East 14th Street is a post-war cooperative finished in 1965, containing 17 stories and 210 units. The building welcomes pets, and residential staff and amenities include a recently renovated laundry room, bike room, live-in superintendent, and part-time doorman (2-10 Monday-Friday; 10-6 Saturday and Sunday). Well situated on the border of the East Village and Gramercy, estaurants and shopping abound, including Trader Joes and Target within blocks. With the L train across the street and Union Square just blocks away, transportation could not be easier.

Discover hidden opportunities at 333 East 14th Street! Reach out today to learn about select off-market listings.

View school info, local attractions, transportation options & more.
Experience amazing 3D aerial maps and fly throughs.
For some co-ops, instead of price per square foot, we use an estimate of the number of rooms for each sold apartment to chart price changes over time. This is because many co-op listings do not include square footage information, and this makes it challenging to calculate accurate square-foot averages.
By displaying the price per estimated room count, we are able to provide a more reliable and consistent metric for comparing sales in the building. While we hope that this gives you a clearer sense of price trends in the building, all data should be independently verified. All data provided are only estimates and should not be used to make any purchase or sale decision.
|
Year
Avg Price / Room (Est)
Avg. Actual Price
Med. Actual Price
Transactions
2025
$182,000
$455,000
1
2024
$235,786
$872,214
7
2023
$258,977
$763,188
8
2022
$253,417
$893,393
14
2021
$243,556
$655,556
9
2020
$231,689
$651,650
10
2019
$242,772
$669,650
6
2018
$243,027
$638,400
5
2017
$266,396
$823,722
9
2016
$222,155
$589,565
10
2015
$224,044
$621,325
20
2014
$205,305
$575,286
7
|
Year
Avg Price / Room (Est)
Avg. Actual Price
Med. Actual Price
Transactions
2013
$188,844
$511,346
13
2012
$178,868
$484,404
3
2011
$192,404
$527,450
10
2010
$180,492
$541,000
8
2009
$176,333
$466,722
9
2008
$199,708
$529,167
9
2007
$207,260
$564,178
15
2006
$171,250
$491,000
9
2005
$167,958
$457,000
9
2004
$136,560
$355,000
6
2003
$116,873
$326,200
15
|
the following is a slider of images. For screen reader users, all slides are visible at all time so you may ignore control buttons.
Sign-up and we'll email you new listings in this building!
Whether you’re a buyer, investor, or simply curious, this report is your key to unlocking in-depth insights and analysis on .
Please confirm your details:


Broker & Buyer Comments